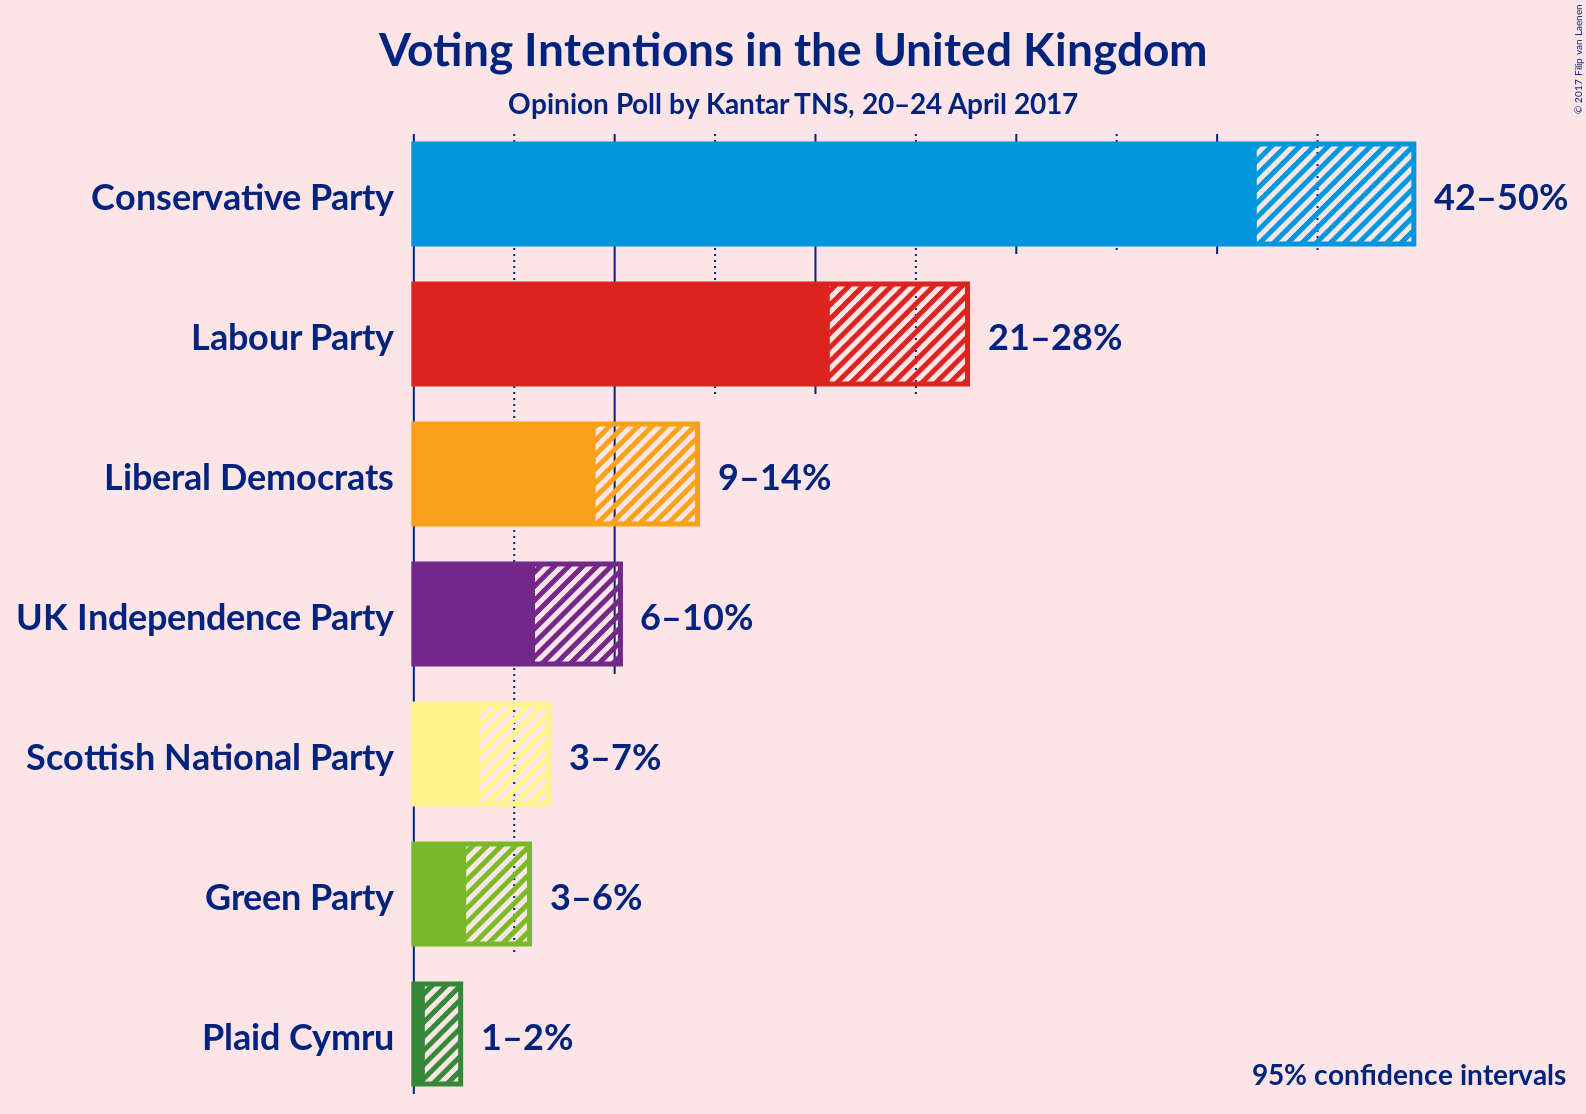
Opinion Poll by Kantar TNS, 20–24 April 2017
Voting Intentions | Seats | Coalitions | Technical Information
Voting Intentions

Confidence Intervals
| Party | Last Result | Poll Result | 80% Confidence Interval | 90% Confidence Interval | 95% Confidence Interval | 99% Confidence Interval |
|---|---|---|---|---|---|---|
| Conservative Party | 36.9% | 46.4% | 43.3–48.6% | 42.7–49.2% | 42.0–49.8% | 40.7–51.0% |
| Labour Party | 30.4% | 24.2% | 21.8–26.3% | 21.3–27.0% | 20.7–27.6% | 19.8–28.7% |
| Liberal Democrats | 7.9% | 11.5% | 9.9–13.2% | 9.5–13.7% | 9.1–14.1% | 8.4–15.0% |
| UK Independence Party | 12.6% | 8.0% | 6.6–9.5% | 6.3–9.9% | 6.0–10.3% | 5.5–11.1% |
| Scottish National Party | 4.7% | 4.8% | 3.7–6.0% | 3.4–6.4% | 3.3–6.7% | 2.9–7.4% |
| Green Party | 3.8% | 4.0% | 3.0–5.2% | 2.9–5.5% | 2.6–5.8% | 2.3–6.4% |
| Plaid Cymru | 0.6% | 1.1% | 0.7–1.9% | 0.5–2.2% | 0.5–2.3% | 0.4–2.7% |
Note: The poll result column reflects the actual value used in the calculations. Published results may vary slightly, and in addition be rounded to fewer digits.
Seats

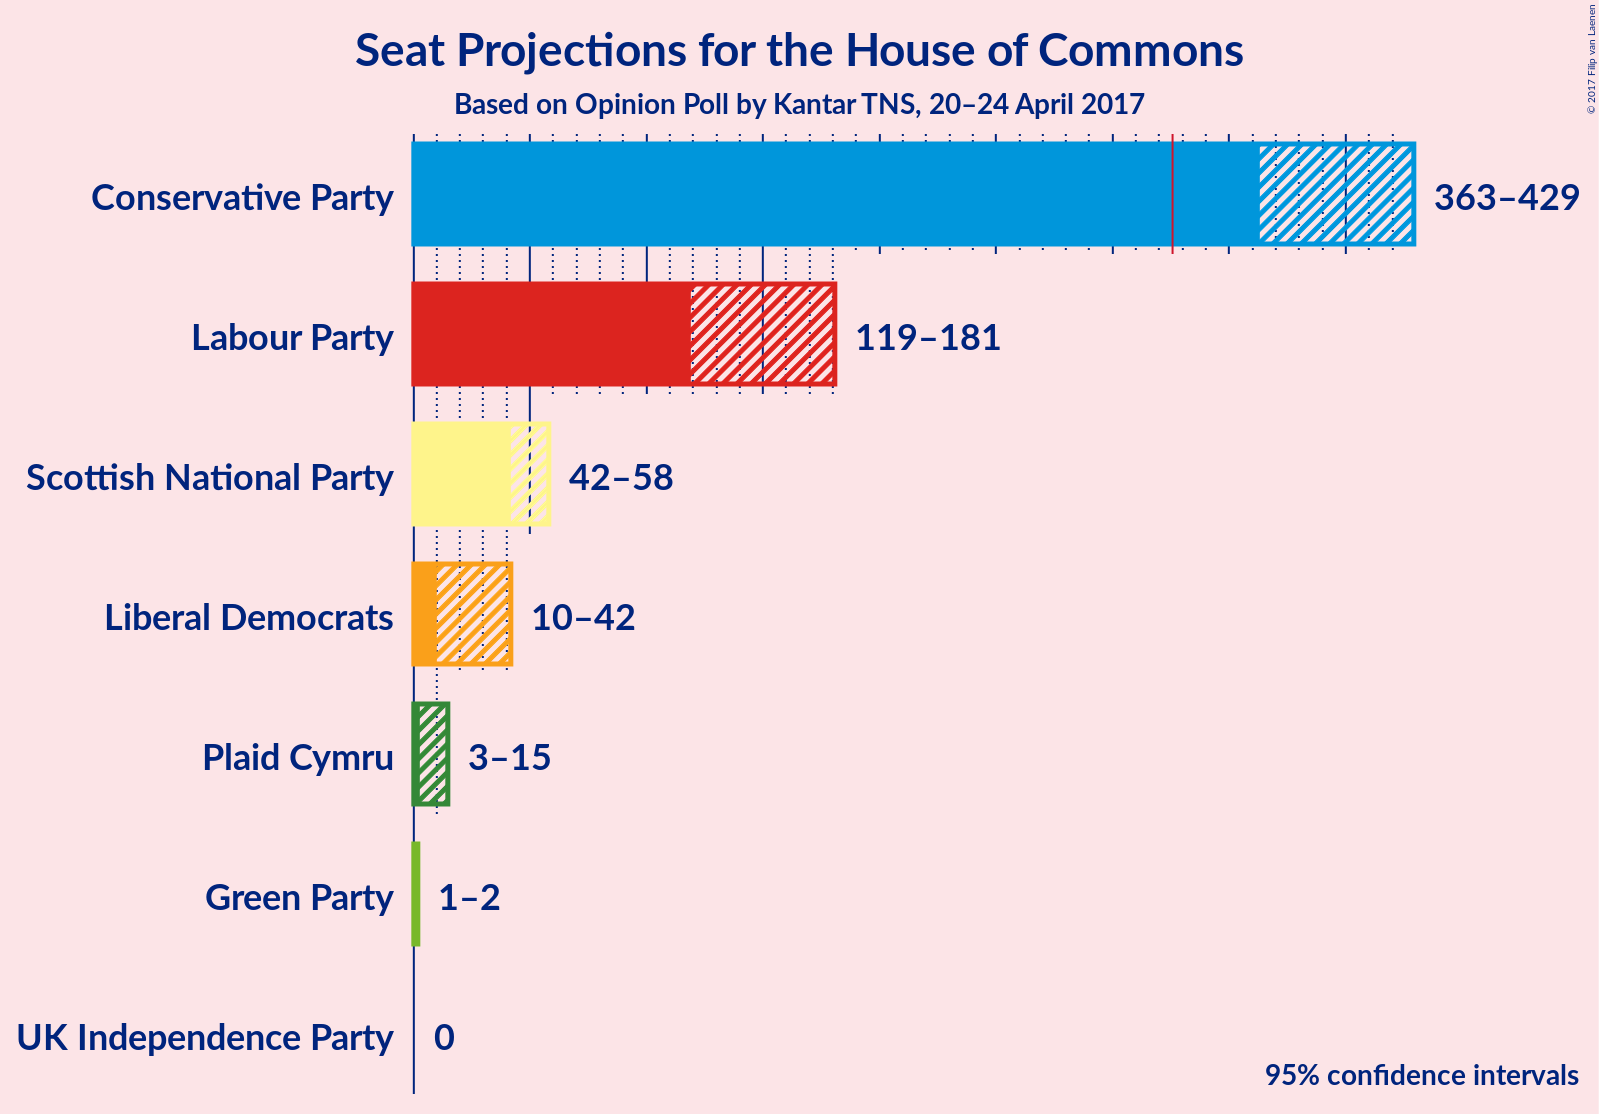
Confidence Intervals
| Party | Last Result | Median | 80% Confidence Interval | 90% Confidence Interval | 95% Confidence Interval | 99% Confidence Interval |
|---|---|---|---|---|---|---|
| Conservative Party | 331 | N/A | 374–419 | 369–424 | 363–429 | 352–439 |
| Labour Party | 232 | N/A | 130–173 | 124–177 | 119–181 | 110–193 |
| Liberal Democrats | 8 | N/A | 15–34 | 12–37 | 10–42 | 8–48 |
| UK Independence Party | 1 | N/A | 0 | 0 | 0 | 0 |
| Scottish National Party | 56 | N/A | 45–56 | 43–58 | 42–58 | 37–59 |
| Green Party | 1 | N/A | 1–2 | 1–2 | 1–2 | 0–2 |
| Plaid Cymru | 3 | N/A | 4–12 | 4–14 | 3–15 | 1–19 |
Coalitions

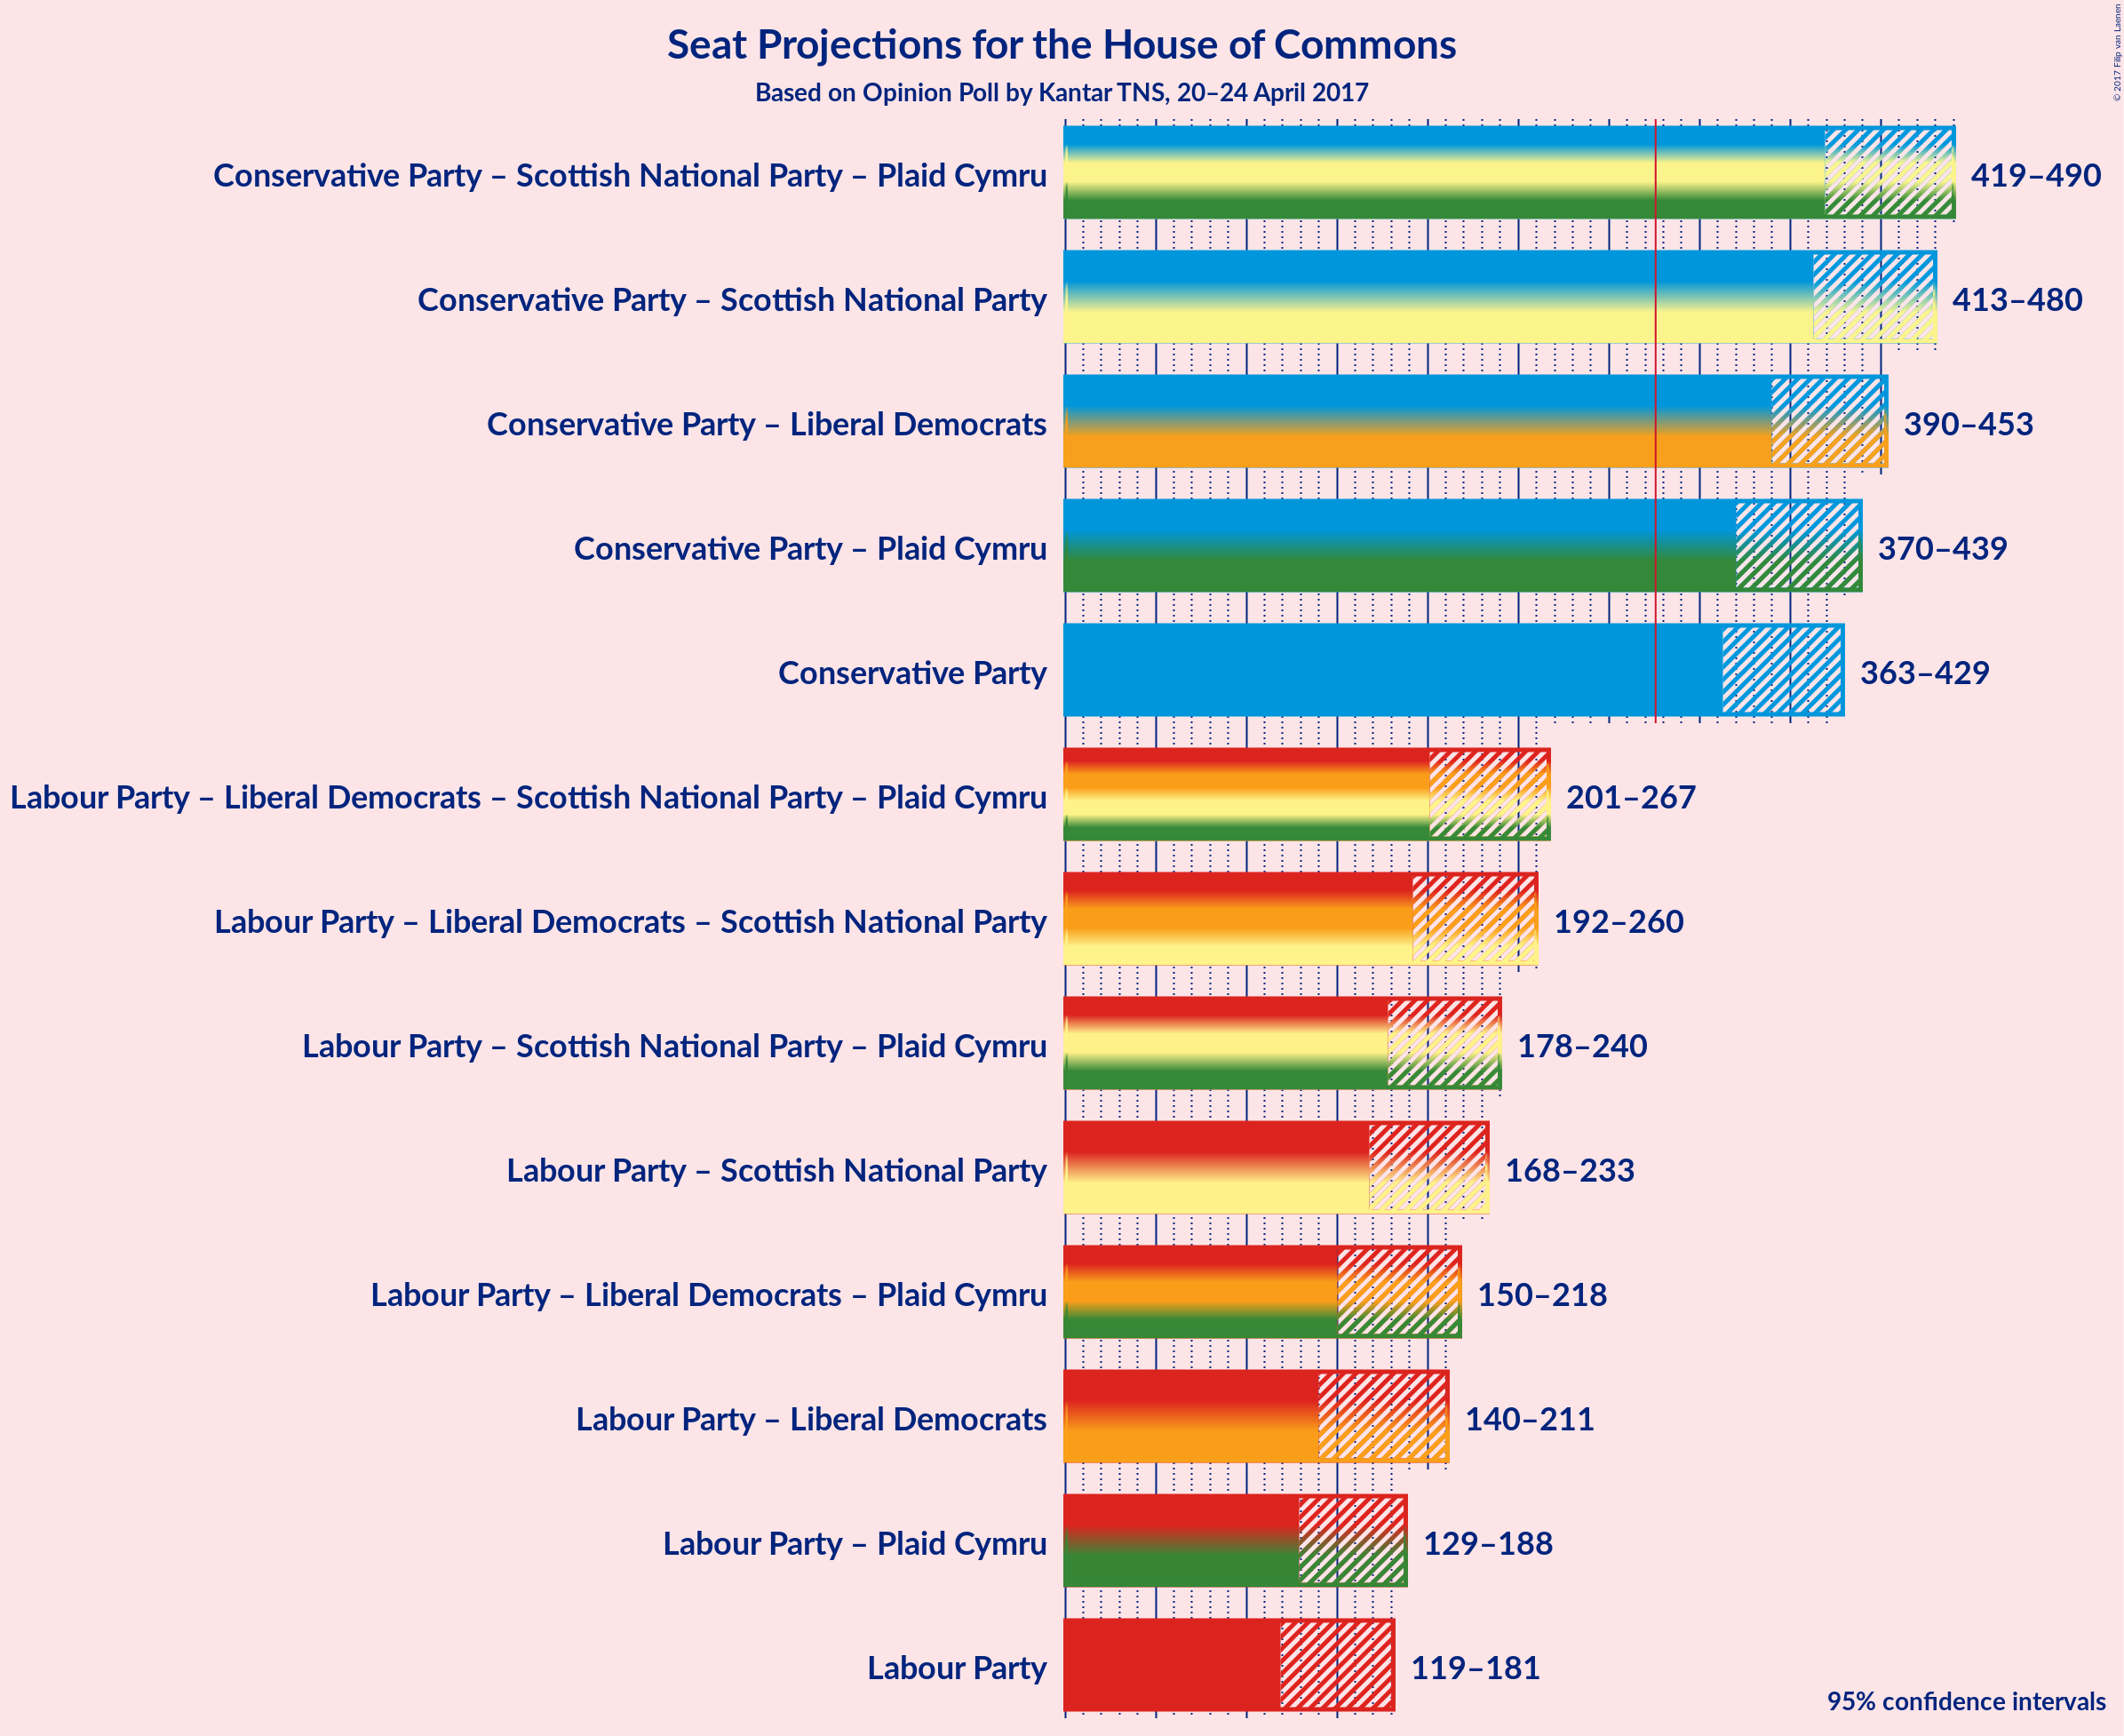
Confidence Intervals
| Coalition | Last Result | Median | 80% Confidence Interval | 90% Confidence Interval | 95% Confidence Interval | 99% Confidence Interval |
|---|---|---|---|---|---|---|
| Conservative Party – Scottish National Party – Plaid Cymru | 390 | N/A | 431–478 | 425–484 | 419–490 | 408–500 |
| Conservative Party – Scottish National Party | 387 | N/A | 424–469 | 418–475 | 413–480 | 401–489 |
| Conservative Party – Liberal Democrats | 339 | N/A | 400–442 | 394–448 | 390–453 | 379–463 |
| Conservative Party – Plaid Cymru | 334 | N/A | 382–427 | 376–434 | 370–439 | 359–449 |
| Conservative Party | 331 | N/A | 374–419 | 369–424 | 363–429 | 352–439 |
| Labour Party – Liberal Democrats – Scottish National Party – Plaid Cymru | 299 | N/A | 212–256 | 206–262 | 201–267 | 192–279 |
| Labour Party – Liberal Democrats – Scottish National Party | 296 | N/A | 203–249 | 197–255 | 192–260 | 182–272 |
| Labour Party – Scottish National Party – Plaid Cymru | 291 | N/A | 188–231 | 182–236 | 178–240 | 168–252 |
| Labour Party – Scottish National Party | 288 | N/A | 179–224 | 174–229 | 168–233 | 158–244 |
| Labour Party – Liberal Democrats – Plaid Cymru | 243 | N/A | 161–207 | 155–213 | 150–218 | 141–230 |
| Labour Party – Liberal Democrats | 240 | N/A | 152–199 | 146–206 | 140–211 | 130–223 |
| Labour Party – Plaid Cymru | 235 | N/A | 140–180 | 133–184 | 129–188 | 120–200 |
| Labour Party | 232 | N/A | 130–173 | 124–177 | 119–181 | 110–193 |
Technical Information
Opinion Poll
- Pollster: Kantar TNS
- Media: —
- Fieldwork period: 20–24 April 2017
Calculations
- Sample size: 627
- Simulations done: 1,048,576
- Error estimate: 0.82%