Opinion Poll by Panelbase, 20–24 April 2017
Voting Intentions | Seats | Coalitions | Technical Information
Voting Intentions

Confidence Intervals
| Party | Last Result | Poll Result | 80% Confidence Interval | 90% Confidence Interval | 95% Confidence Interval | 99% Confidence Interval |
|---|---|---|---|---|---|---|
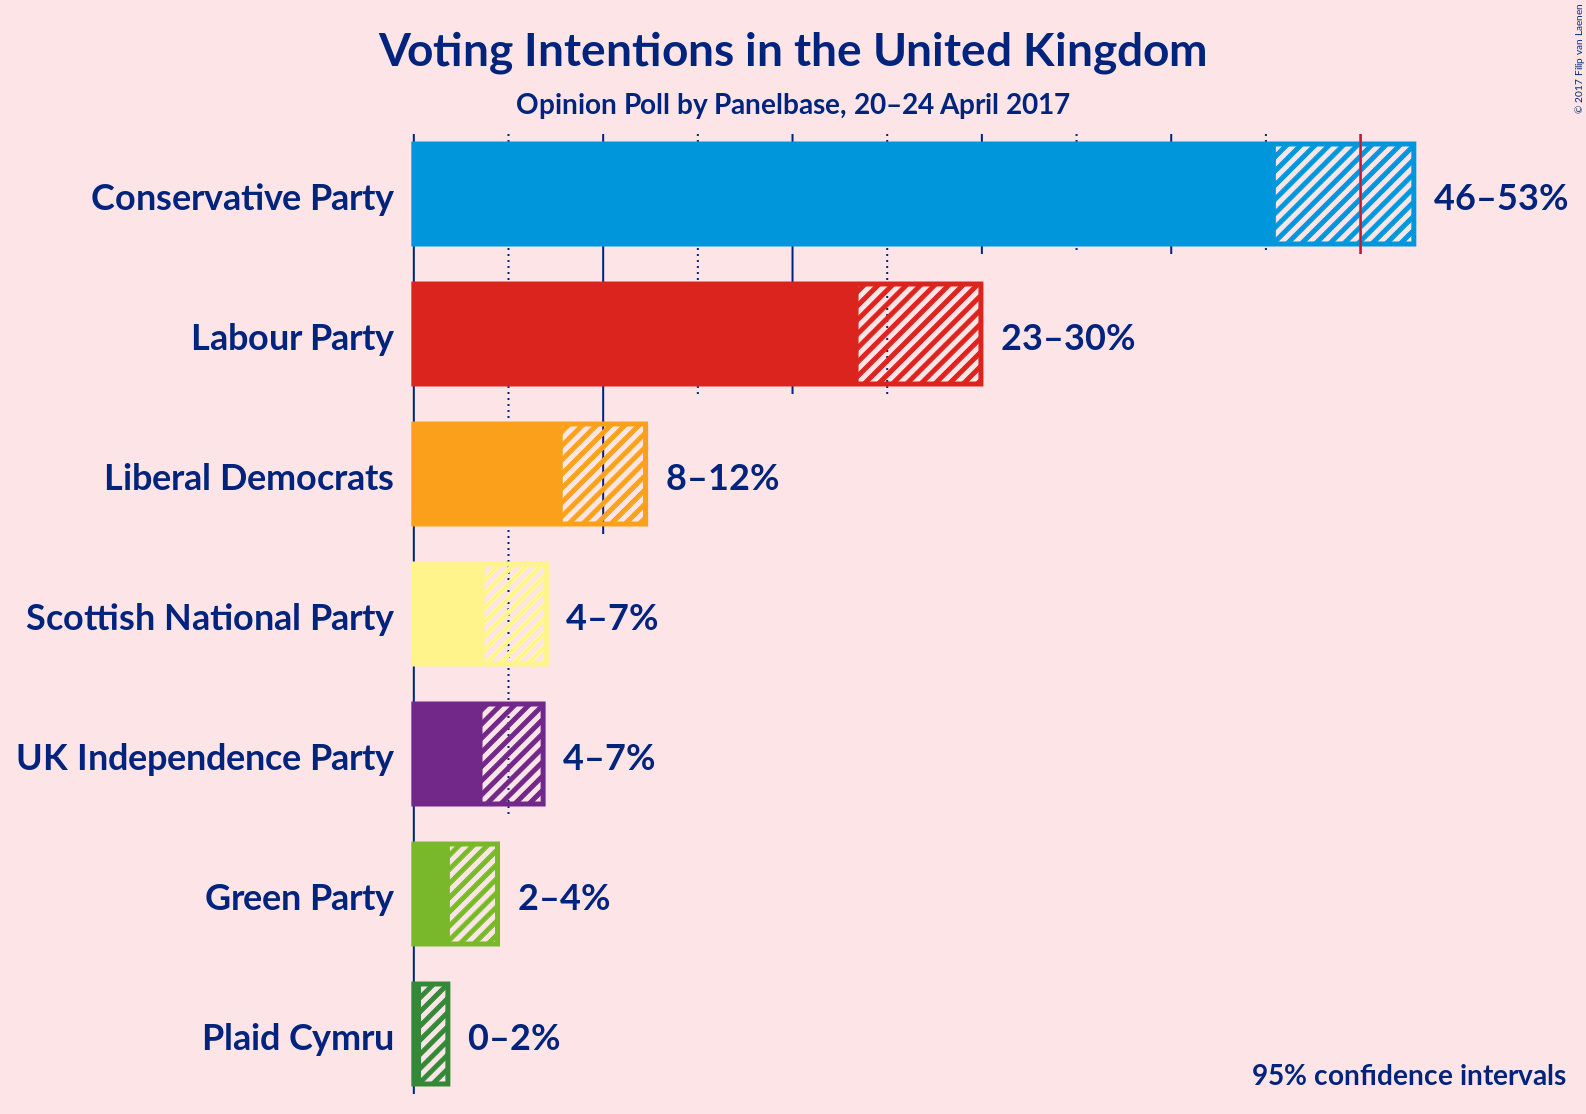
| Conservative Party | 36.9% | 49.4% | 46.8–51.6% | 46.1–52.2% | 45.5–52.8% | 44.4–54.0% |
| Labour Party | 30.4% | 26.7% | 24.6–28.8% | 24.0–29.4% | 23.5–29.9% | 22.5–31.0% |
| Liberal Democrats | 7.9% | 9.9% | 8.5–11.4% | 8.2–11.8% | 7.9–12.2% | 7.3–13.0% |
| Scottish National Party | 4.7% | 5.2% | 4.2–6.3% | 3.9–6.7% | 3.7–7.0% | 3.3–7.6% |
| UK Independence Party | 12.6% | 5.0% | 4.1–6.2% | 3.8–6.5% | 3.6–6.8% | 3.2–7.5% |
| Green Party | 3.8% | 2.9% | 2.2–3.9% | 2.1–4.2% | 1.9–4.4% | 1.6–4.9% |
| Plaid Cymru | 0.6% | 0.8% | 0.5–1.5% | 0.4–1.6% | 0.4–1.8% | 0.3–2.2% |
Note: The poll result column reflects the actual value used in the calculations. Published results may vary slightly, and in addition be rounded to fewer digits.
Seats

Confidence Intervals
| Party | Last Result | Median | 80% Confidence Interval | 90% Confidence Interval | 95% Confidence Interval | 99% Confidence Interval |
|---|---|---|---|---|---|---|
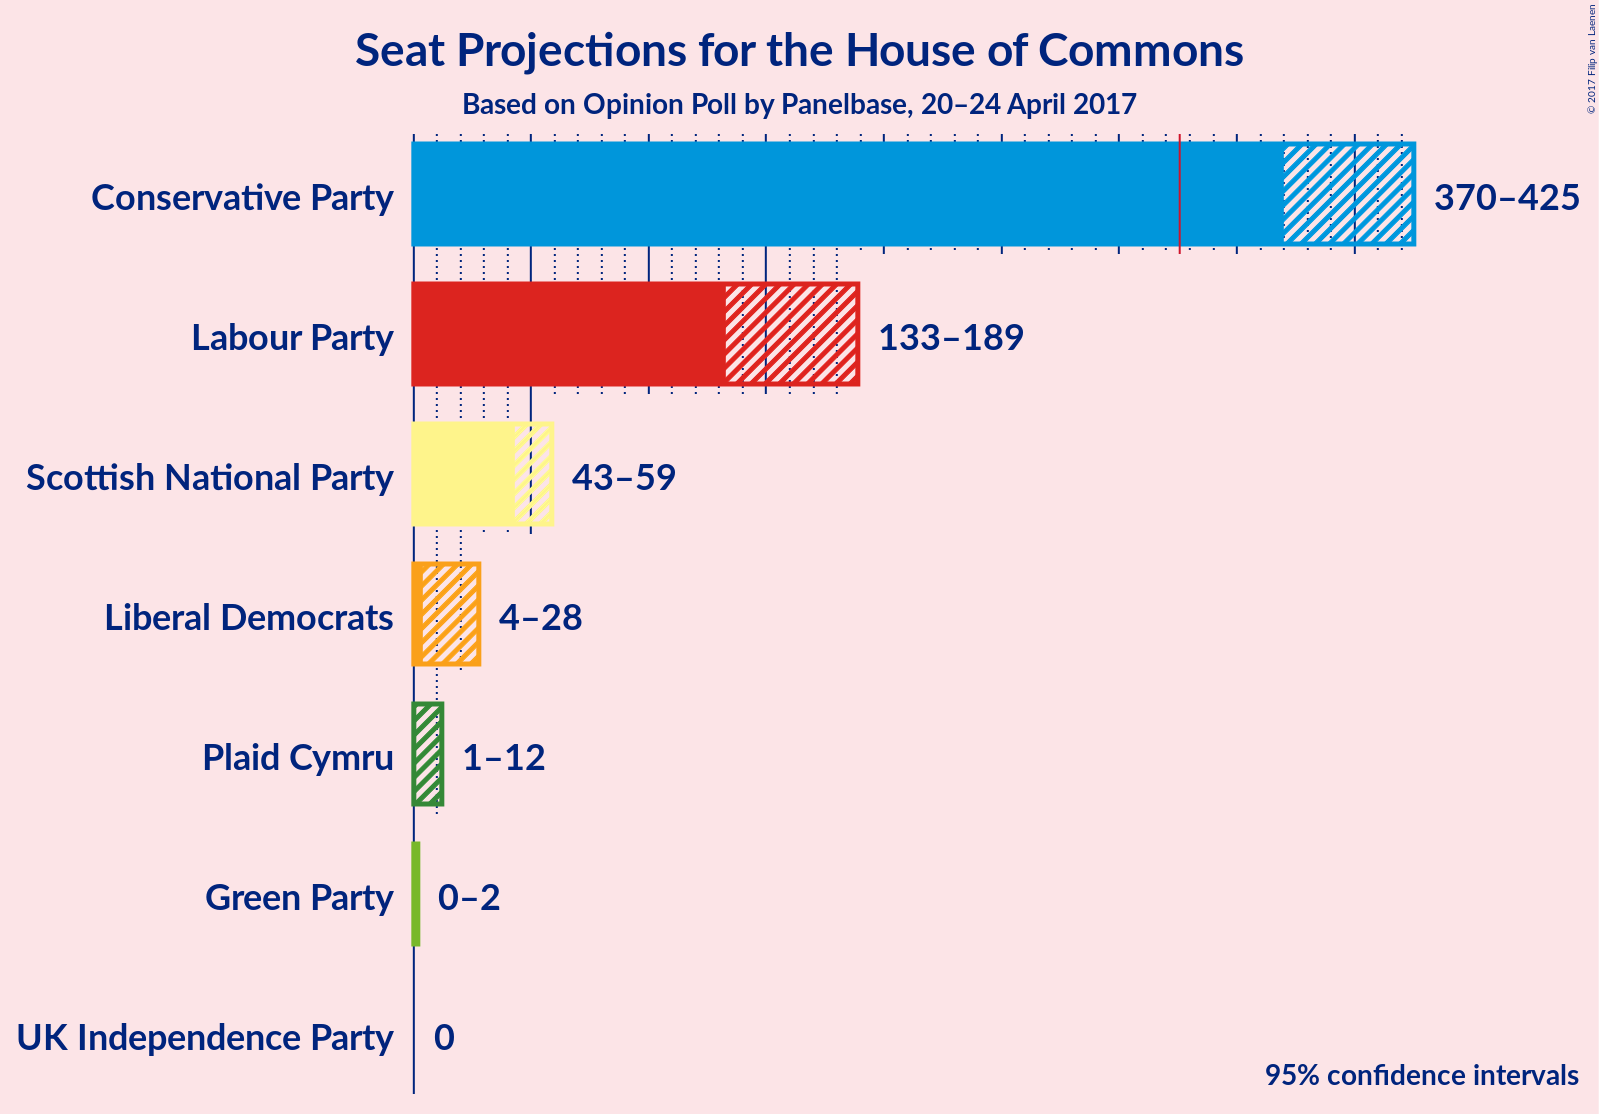
| Conservative Party | 331 | N/A | 380–418 | 374–421 | 370–425 | 360–434 |
| Labour Party | 232 | N/A | 141–180 | 138–183 | 133–189 | 123–199 |
| Liberal Democrats | 8 | N/A | 6–23 | 5–26 | 4–28 | 4–31 |
| Scottish National Party | 56 | N/A | 47–58 | 45–59 | 43–59 | 40–59 |
| UK Independence Party | 1 | N/A | 0 | 0 | 0 | 0 |
| Green Party | 1 | N/A | 0–1 | 0–1 | 0–2 | 0–2 |
| Plaid Cymru | 3 | N/A | 4–8 | 3–11 | 1–12 | 0–13 |
Coalitions

Confidence Intervals
| Coalition | Last Result | Median | 80% Confidence Interval | 90% Confidence Interval | 95% Confidence Interval | 99% Confidence Interval |
|---|---|---|---|---|---|---|
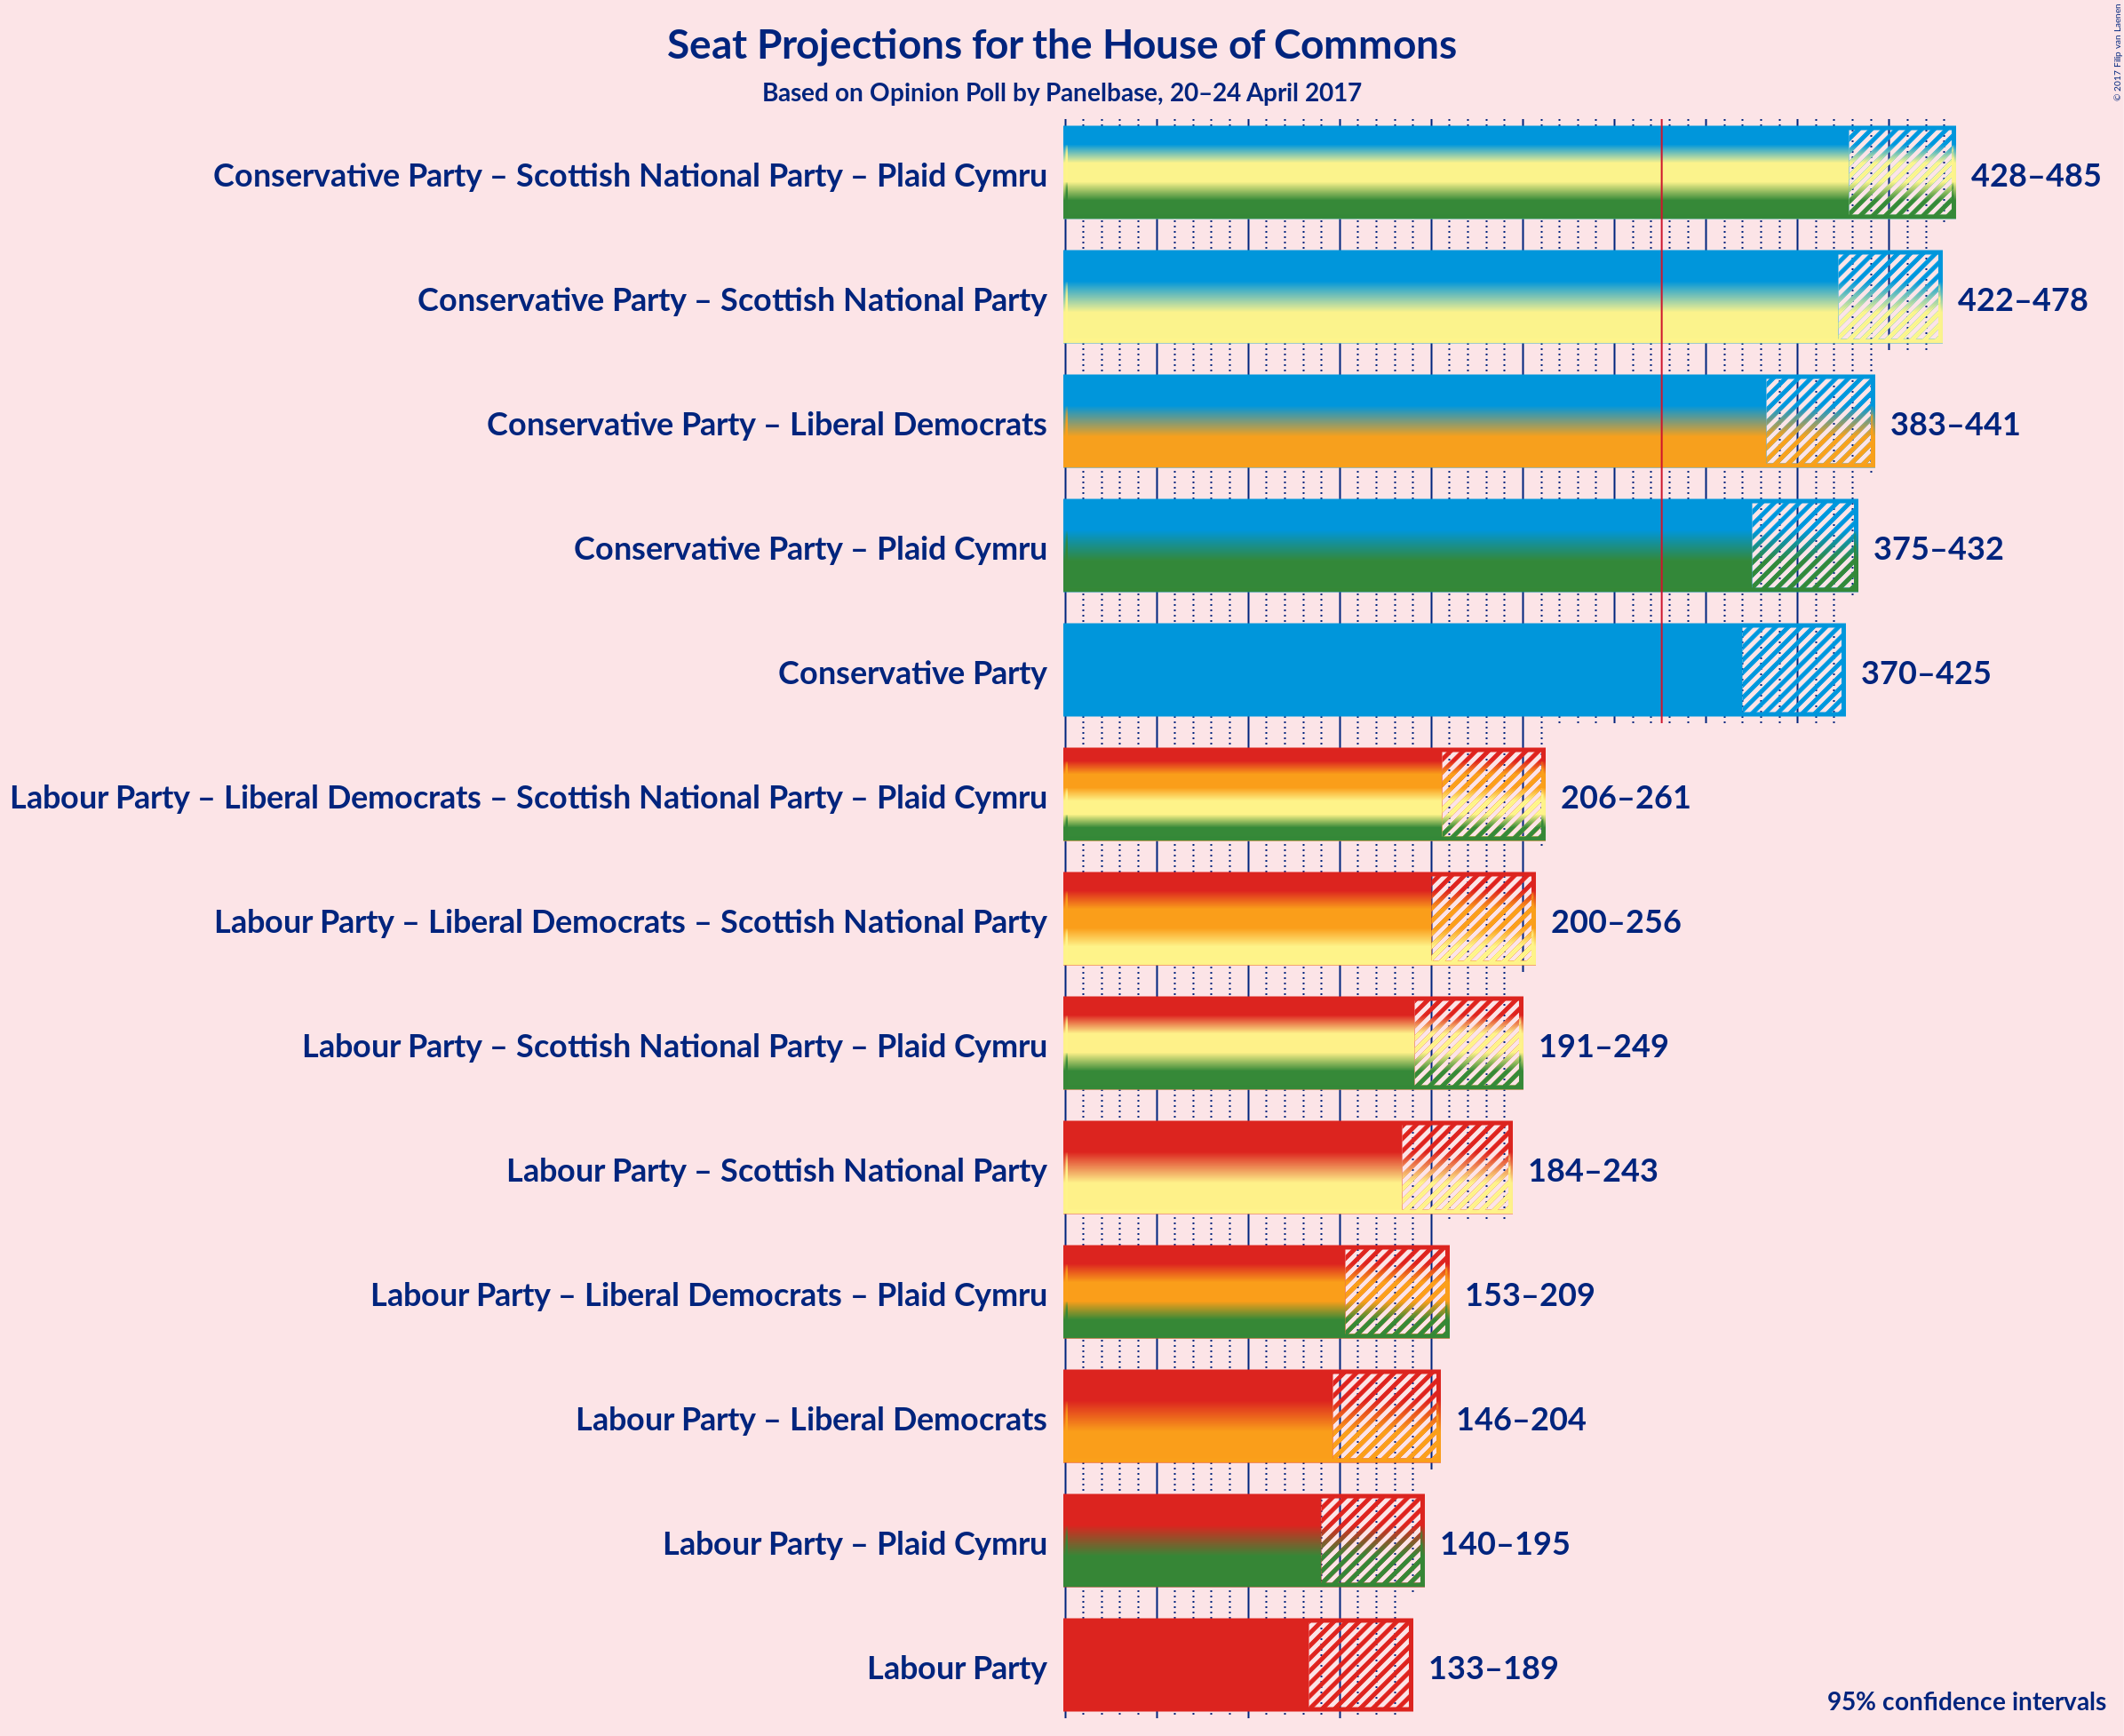
| Conservative Party – Scottish National Party – Plaid Cymru | 390 | N/A | 437–477 | 432–481 | 428–485 | 417–495 |
| Conservative Party – Scottish National Party | 387 | N/A | 432–471 | 427–475 | 422–478 | 412–487 |
| Conservative Party – Liberal Democrats | 339 | N/A | 392–433 | 387–437 | 383–441 | 372–451 |
| Conservative Party – Plaid Cymru | 334 | N/A | 384–423 | 380–428 | 375–432 | 364–442 |
| Conservative Party | 331 | N/A | 380–418 | 374–421 | 370–425 | 360–434 |
| Labour Party – Liberal Democrats – Scottish National Party – Plaid Cymru | 299 | N/A | 214–252 | 210–257 | 206–261 | 198–271 |
| Labour Party – Liberal Democrats – Scottish National Party | 296 | N/A | 209–247 | 204–252 | 200–256 | 190–267 |
| Labour Party – Scottish National Party – Plaid Cymru | 291 | N/A | 199–239 | 194–244 | 191–249 | 181–259 |
| Labour Party – Scottish National Party | 288 | N/A | 193–234 | 189–239 | 184–243 | 174–255 |
| Labour Party – Liberal Democrats – Plaid Cymru | 243 | N/A | 160–199 | 156–204 | 153–209 | 144–219 |
| Labour Party – Liberal Democrats | 240 | N/A | 154–194 | 150–199 | 146–204 | 136–214 |
| Labour Party – Plaid Cymru | 235 | N/A | 146–185 | 143–189 | 140–195 | 132–204 |
| Labour Party | 232 | N/A | 141–180 | 138–183 | 133–189 | 123–199 |
Technical Information
Opinion Poll
- Pollster: Panelbase
- Media: —
- Fieldwork period: 20–24 April 2017
Calculations
- Sample size: 718
- Simulations done: 2,097,152
- Error estimate: 1.63%