Opinion Poll by Ipsos MORI for Evening Standard, 21–25 April 2017
Voting Intentions | Seats | Coalitions | Technical Information
Voting Intentions

Confidence Intervals
| Party | Last Result | Poll Result | 80% Confidence Interval | 90% Confidence Interval | 95% Confidence Interval | 99% Confidence Interval |
|---|---|---|---|---|---|---|
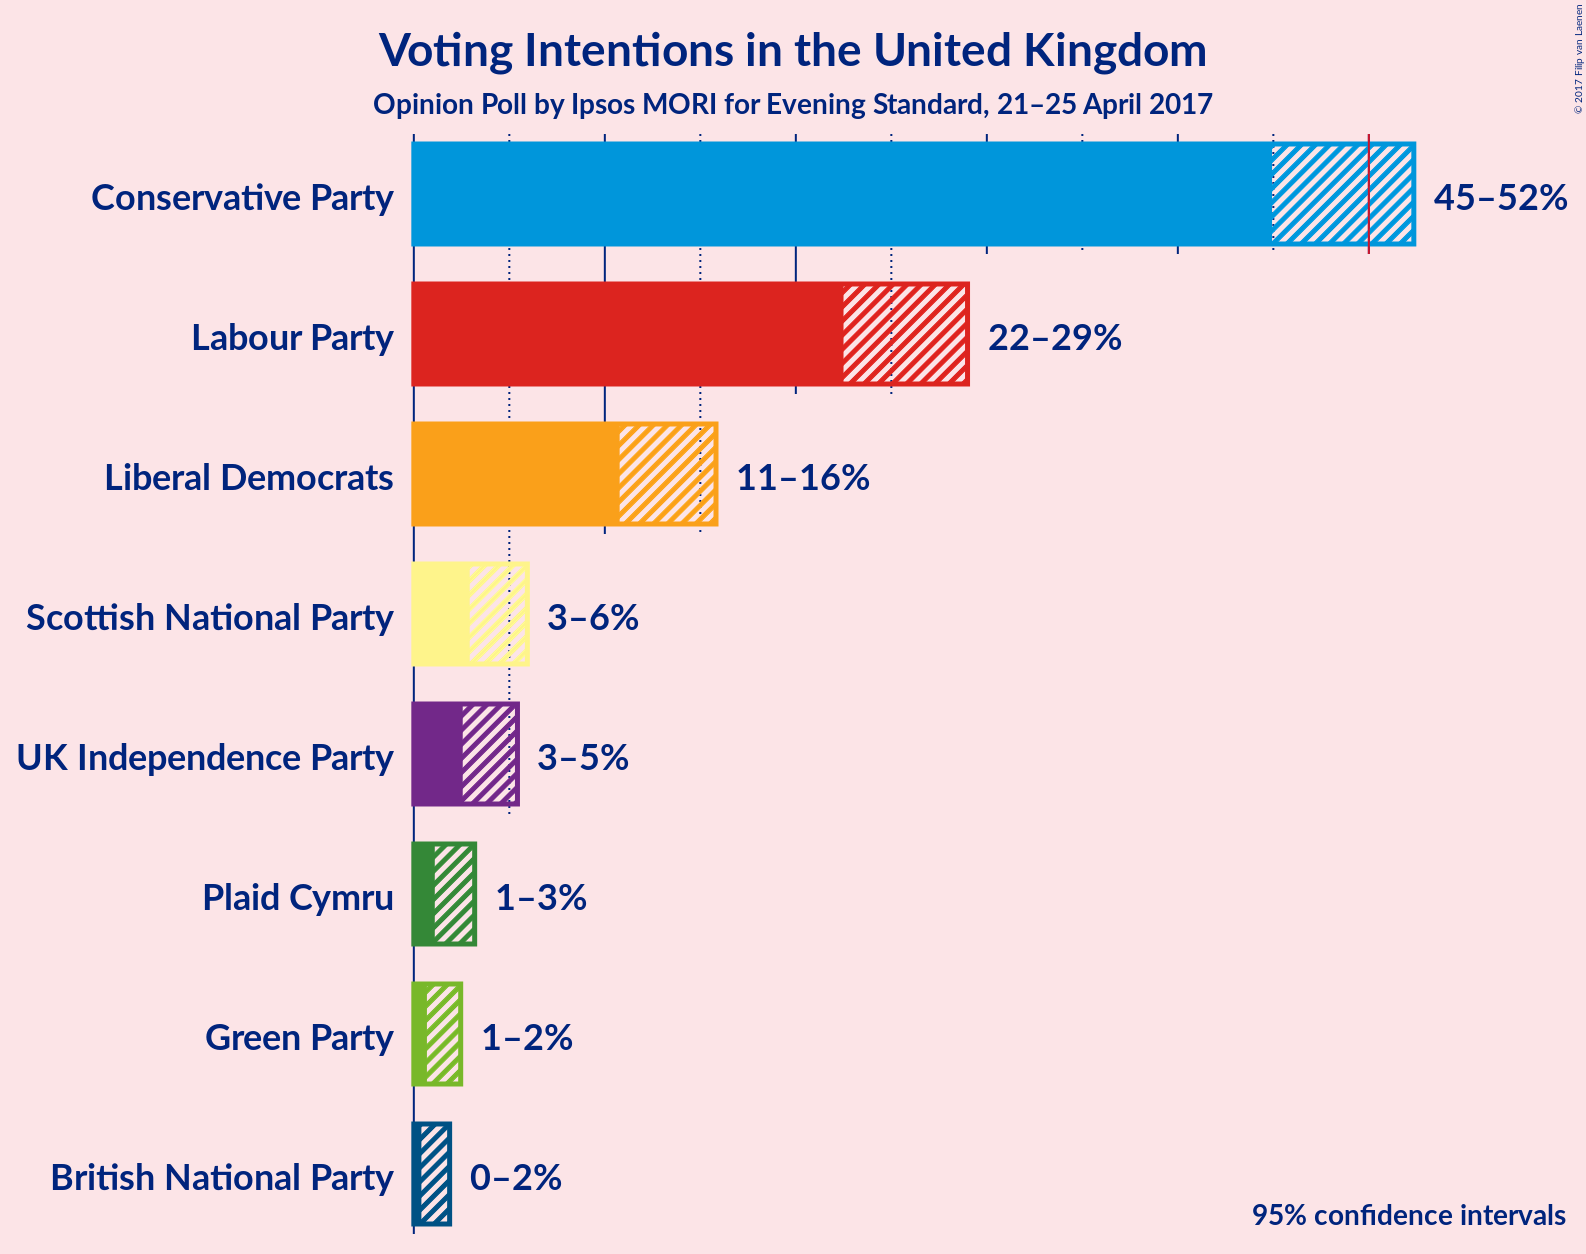
| Conservative Party | 36.9% | 49.0% | 46.2–51.1% | 45.5–51.8% | 44.9–52.4% | 43.8–53.5% |
| Labour Party | 30.4% | 25.8% | 23.6–27.8% | 23.0–28.5% | 22.5–29.0% | 21.6–30.1% |
| Liberal Democrats | 7.9% | 13.2% | 11.6–14.9% | 11.1–15.4% | 10.8–15.8% | 10.1–16.7% |
| Scottish National Party | 4.7% | 4.2% | 3.3–5.3% | 3.1–5.6% | 2.9–5.9% | 2.6–6.5% |
| UK Independence Party | 12.6% | 3.8% | 3.0–4.8% | 2.7–5.2% | 2.6–5.4% | 2.2–6.0% |
| Plaid Cymru | 0.6% | 1.9% | 1.4–2.7% | 1.2–3.0% | 1.1–3.2% | 0.9–3.6% |
| Green Party | 3.8% | 1.3% | 0.9–2.0% | 0.8–2.3% | 0.7–2.5% | 0.5–2.9% |
| British National Party | 0.0% | 0.9% | 0.5–1.5% | 0.5–1.7% | 0.4–1.9% | 0.3–2.2% |
Note: The poll result column reflects the actual value used in the calculations. Published results may vary slightly, and in addition be rounded to fewer digits.
Seats

Confidence Intervals
| Party | Last Result | Median | 80% Confidence Interval | 90% Confidence Interval | 95% Confidence Interval | 99% Confidence Interval |
|---|---|---|---|---|---|---|
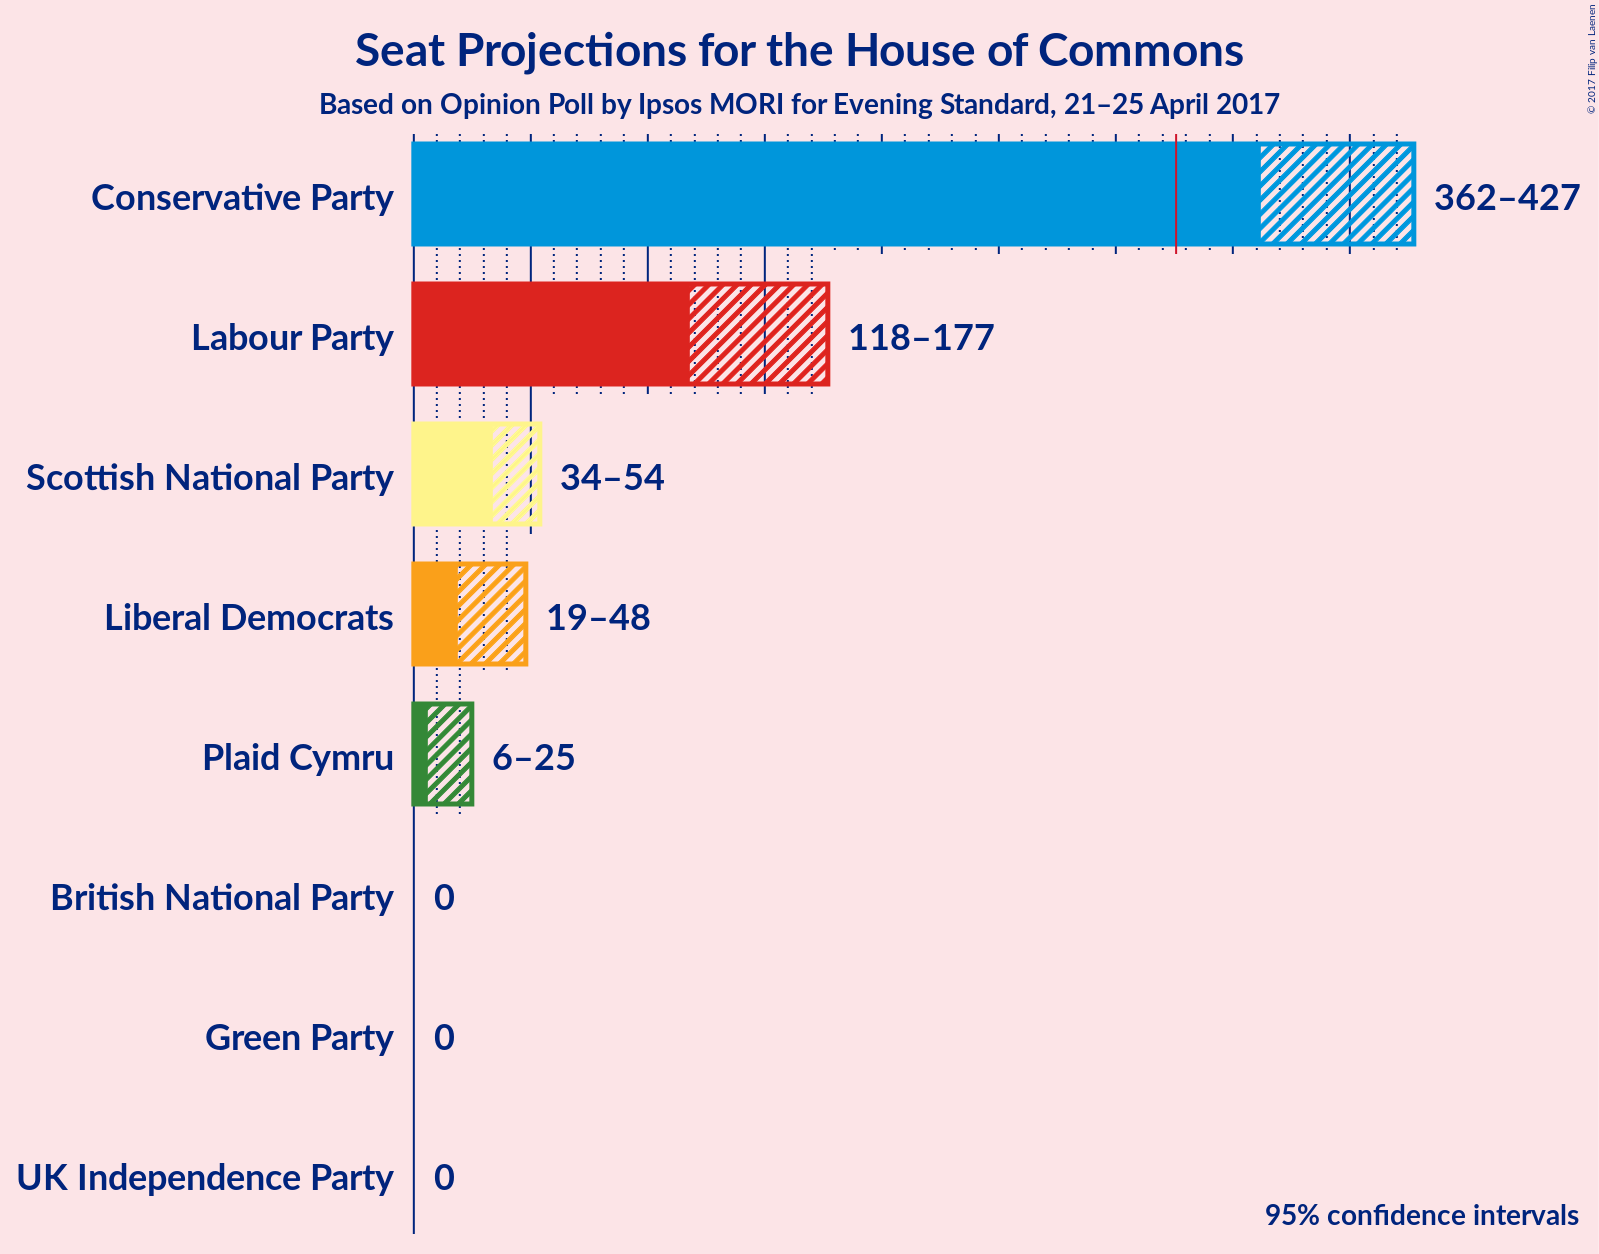
| Conservative Party | 331 | N/A | 373–419 | 367–422 | 362–427 | 352–438 |
| Labour Party | 232 | N/A | 129–169 | 122–175 | 118–177 | 110–189 |
| Liberal Democrats | 8 | N/A | 22–44 | 20–45 | 19–48 | 13–50 |
| Scottish National Party | 56 | N/A | 40–51 | 37–54 | 34–54 | 26–57 |
| UK Independence Party | 1 | N/A | 0 | 0 | 0 | 0 |
| Plaid Cymru | 3 | N/A | 8–18 | 7–21 | 6–25 | 4–26 |
| Green Party | 1 | N/A | 0 | 0 | 0 | 0–1 |
| British National Party | 0 | N/A | 0 | 0 | 0 | 0 |
Coalitions

Confidence Intervals
| Coalition | Last Result | Median | 80% Confidence Interval | 90% Confidence Interval | 95% Confidence Interval | 99% Confidence Interval |
|---|---|---|---|---|---|---|
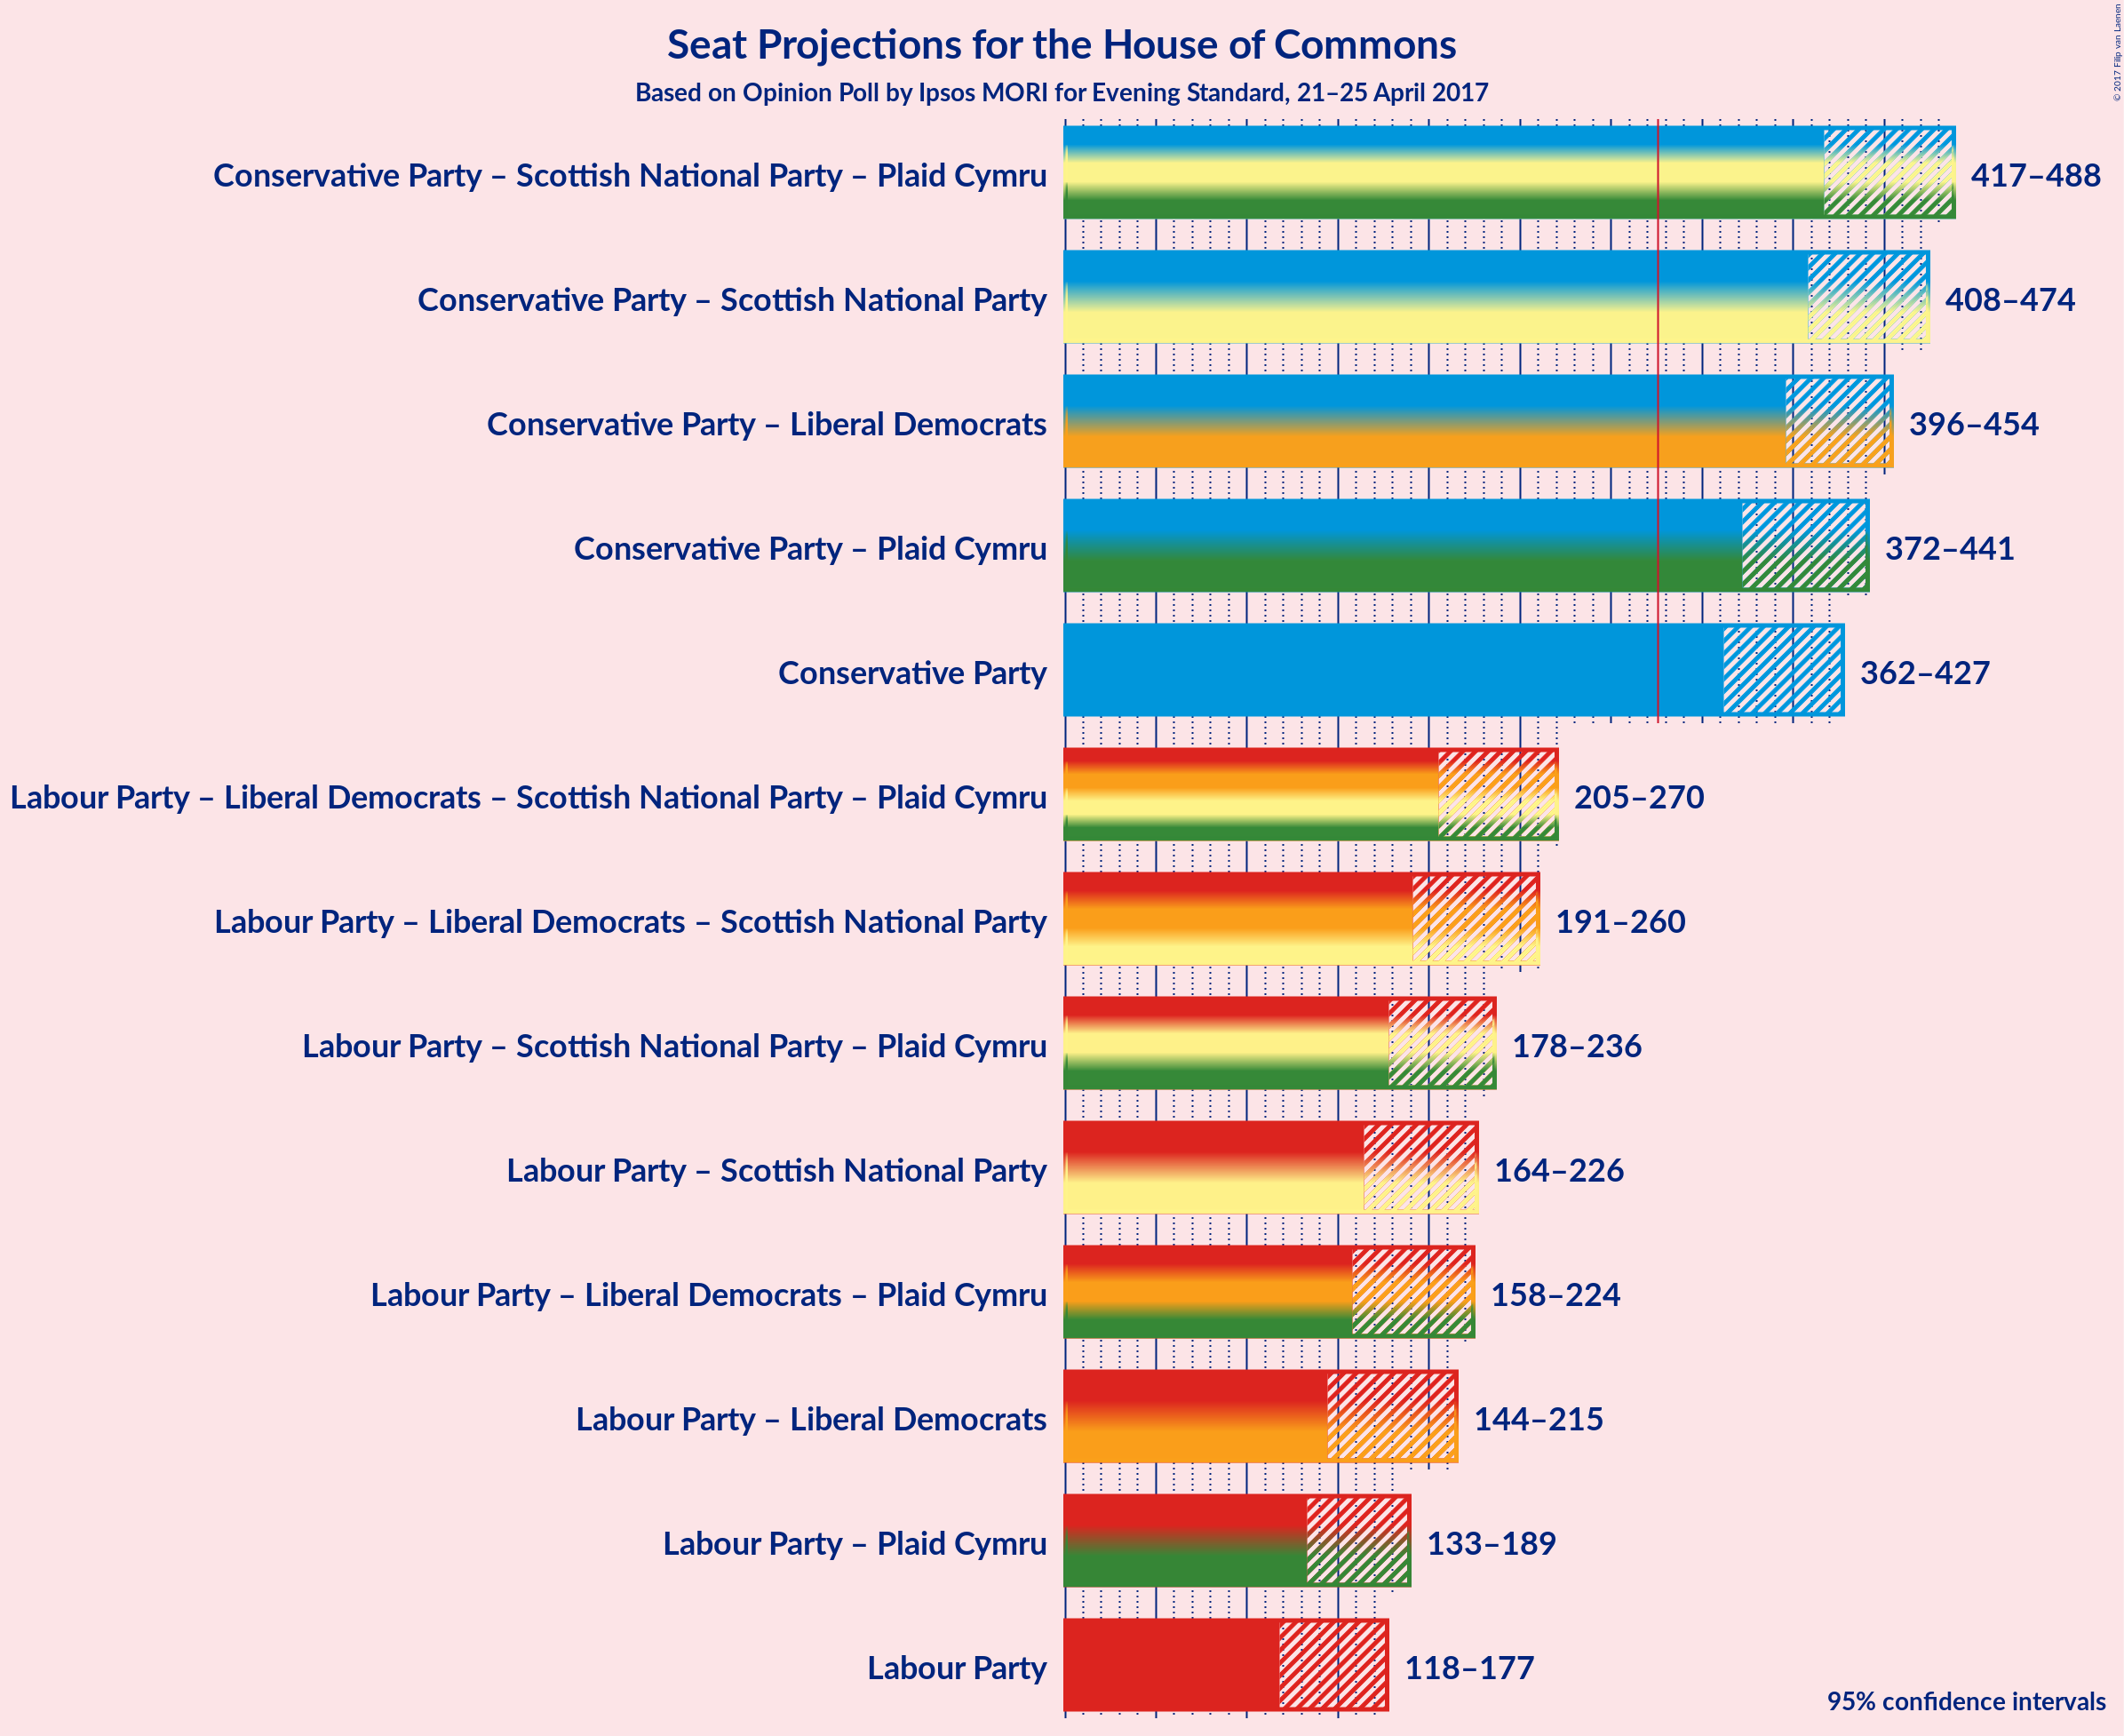
| Conservative Party – Scottish National Party – Plaid Cymru | 390 | N/A | 431–476 | 422–483 | 417–488 | 406–495 |
| Conservative Party – Scottish National Party | 387 | N/A | 418–463 | 413–467 | 408–474 | 396–480 |
| Conservative Party – Liberal Democrats | 339 | N/A | 406–446 | 398–449 | 396–454 | 388–465 |
| Conservative Party – Plaid Cymru | 334 | N/A | 384–433 | 377–436 | 372–441 | 362–453 |
| Conservative Party | 331 | N/A | 373–419 | 367–422 | 362–427 | 352–438 |
| Labour Party – Liberal Democrats – Scottish National Party – Plaid Cymru | 299 | N/A | 213–259 | 210–265 | 205–270 | 194–280 |
| Labour Party – Liberal Democrats – Scottish National Party | 296 | N/A | 199–248 | 196–255 | 191–260 | 179–270 |
| Labour Party – Scottish National Party – Plaid Cymru | 291 | N/A | 186–226 | 183–234 | 178–236 | 167–244 |
| Labour Party – Scottish National Party | 288 | N/A | 172–214 | 168–221 | 164–226 | 152–235 |
| Labour Party – Liberal Democrats – Plaid Cymru | 243 | N/A | 169–214 | 165–219 | 158–224 | 152–236 |
| Labour Party – Liberal Democrats | 240 | N/A | 156–201 | 149–209 | 144–215 | 137–226 |
| Labour Party – Plaid Cymru | 235 | N/A | 143–181 | 136–186 | 133–189 | 126–201 |
| Labour Party | 232 | N/A | 129–169 | 122–175 | 118–177 | 110–189 |
Technical Information
Opinion Poll
- Pollster: Ipsos MORI
- Media: Evening Standard
- Fieldwork period: 21–25 April 2017
Calculations
- Sample size: 690
- Simulations done: 1,048,576
- Error estimate: 1.19%