Opinion Poll by GfK for Business Insider, 3–14 May 2017
Voting Intentions | Seats | Coalitions | Technical Information
Voting Intentions

Confidence Intervals
| Party |
Last Result |
Poll Result |
80% Confidence Interval |
90% Confidence Interval |
95% Confidence Interval |
99% Confidence Interval |
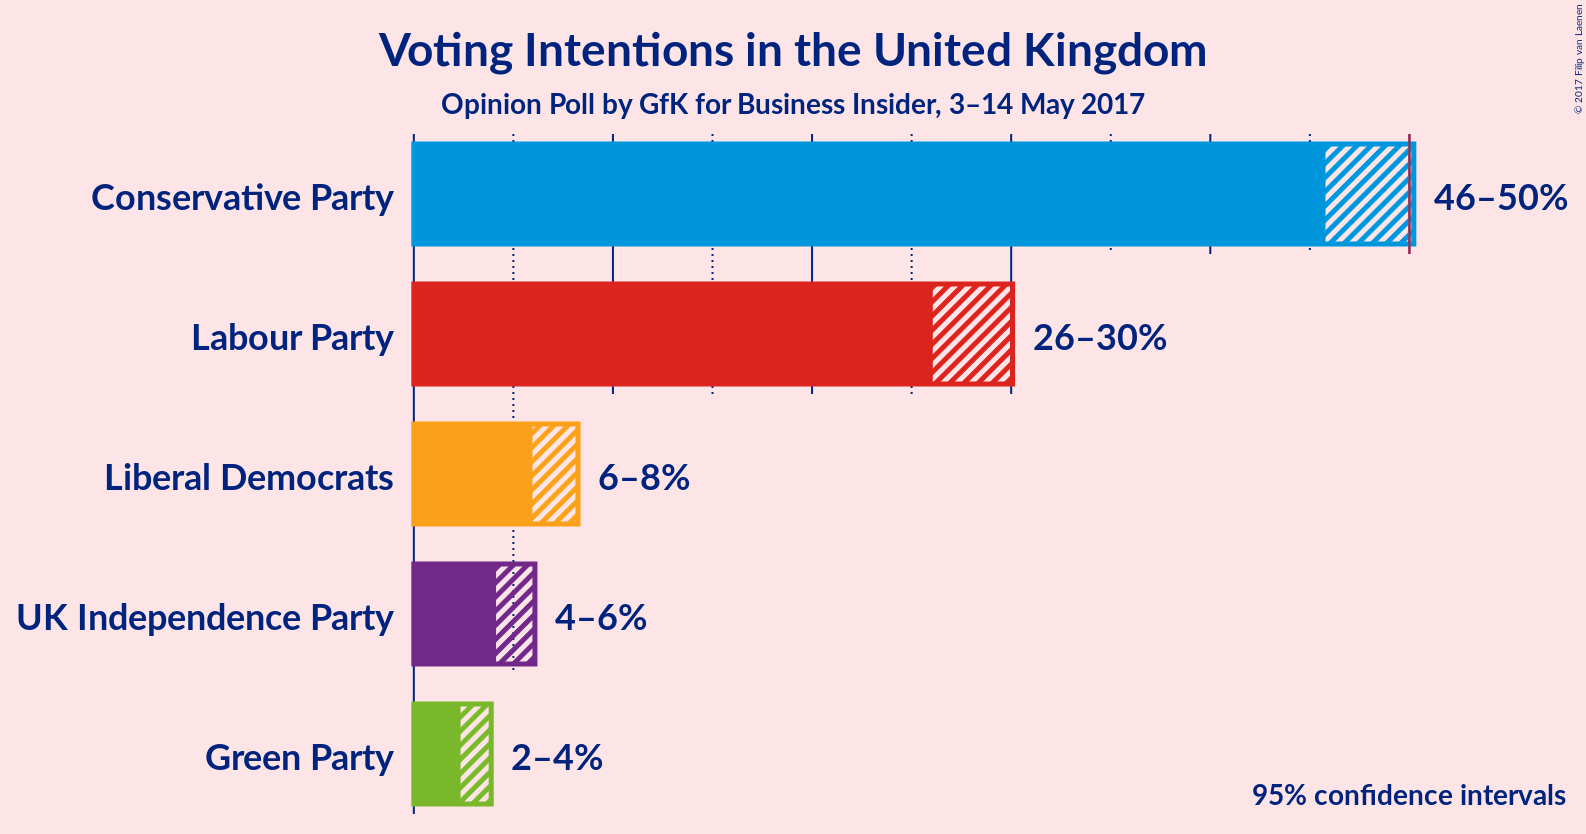
| Conservative Party |
36.9% |
52.7% |
46.5–49.5% |
46.1–49.9% |
45.8–50.2% |
45.1–50.9% |
| Labour Party |
30.4% |
30.8% |
26.7–29.4% |
26.4–29.7% |
26.1–30.1% |
25.5–30.7% |
| Liberal Democrats |
7.9% |
7.7% |
6.3–7.8% |
6.1–8.0% |
6.0–8.2% |
5.6–8.6% |
| UK Independence Party |
12.6% |
5.5% |
4.4–5.7% |
4.3–5.9% |
4.1–6.1% |
3.9–6.4% |
| Green Party |
3.8% |
3.3% |
2.6–3.6% |
2.5–3.7% |
2.3–3.9% |
2.1–4.2% |
Note: The poll result column reflects the actual value used in the calculations. Published results may vary slightly, and in addition be rounded to fewer digits.
Seats

Confidence Intervals
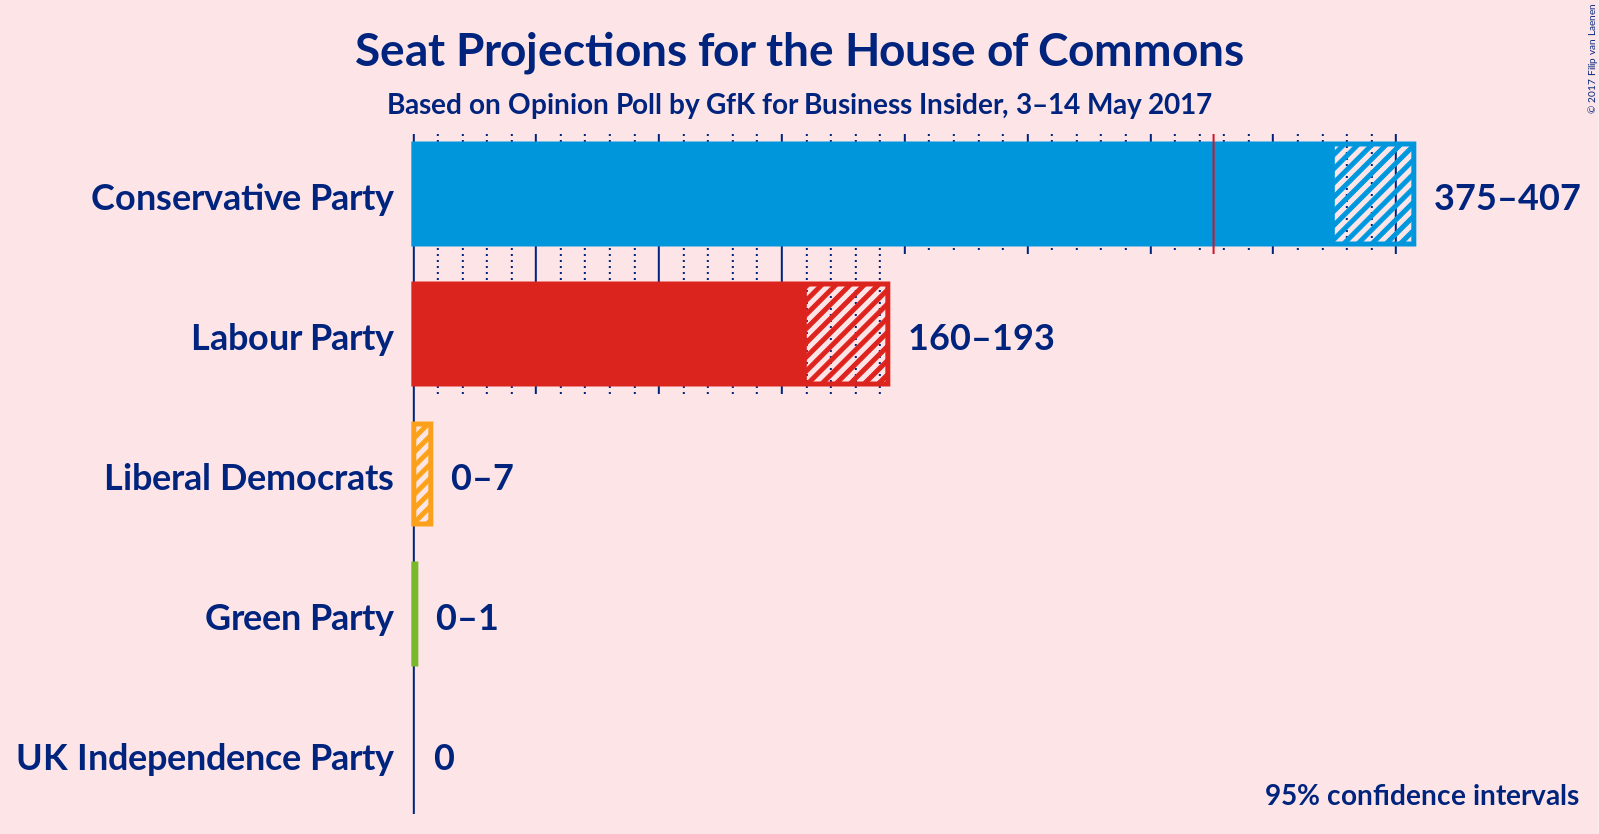
Conservative Party
| Number of Seats |
Probability |
Accumulated |
| 363 |
0% |
100% |
| 364 |
0.1% |
99.9% |
| 365 |
0.1% |
99.9% |
| 366 |
0.1% |
99.8% |
| 367 |
0.1% |
99.7% |
| 368 |
0.2% |
99.6% |
| 369 |
0.1% |
99.4% |
| 370 |
0.1% |
99.3% |
| 371 |
0.3% |
99.2% |
| 372 |
0.3% |
98.8% |
| 373 |
0.6% |
98.6% |
| 374 |
0.2% |
98% |
| 375 |
0.4% |
98% |
| 376 |
0.8% |
97% |
| 377 |
2% |
97% |
| 378 |
1.2% |
95% |
| 379 |
1.5% |
94% |
| 380 |
2% |
92% |
| 381 |
2% |
90% |
| 382 |
8% |
88% |
| 383 |
8% |
80% |
| 384 |
6% |
72% |
| 385 |
4% |
67% |
| 386 |
4% |
62% |
| 387 |
2% |
58% |
| 388 |
2% |
56% |
| 389 |
11% |
54% |
| 390 |
7% |
44% |
| 391 |
5% |
37% |
| 392 |
2% |
32% |
| 393 |
0.6% |
29% |
| 394 |
3% |
28% |
| 395 |
2% |
26% |
| 396 |
3% |
23% |
| 397 |
3% |
21% |
| 398 |
3% |
18% |
| 399 |
2% |
15% |
| 400 |
2% |
13% |
| 401 |
2% |
12% |
| 402 |
0.6% |
10% |
| 403 |
0.5% |
9% |
| 404 |
2% |
9% |
| 405 |
3% |
7% |
| 406 |
2% |
4% |
| 407 |
0.7% |
3% |
| 408 |
0.4% |
2% |
| 409 |
0.4% |
2% |
| 410 |
0.3% |
1.2% |
| 411 |
0.2% |
0.9% |
| 412 |
0.2% |
0.7% |
| 413 |
0.2% |
0.5% |
| 414 |
0.1% |
0.3% |
| 415 |
0.1% |
0.2% |
| 416 |
0% |
0.1% |
| 417 |
0% |
0.1% |
| 418 |
0% |
0.1% |
| 419 |
0% |
0% |
Labour Party
| Number of Seats |
Probability |
Accumulated |
| 149 |
0% |
100% |
| 150 |
0% |
99.9% |
| 151 |
0.1% |
99.9% |
| 152 |
0.1% |
99.8% |
| 153 |
0.2% |
99.7% |
| 154 |
0.1% |
99.5% |
| 155 |
0.3% |
99.4% |
| 156 |
0.2% |
99.1% |
| 157 |
0.3% |
98.8% |
| 158 |
0.5% |
98.5% |
| 159 |
0.4% |
98% |
| 160 |
1.1% |
98% |
| 161 |
1.5% |
97% |
| 162 |
2% |
95% |
| 163 |
2% |
93% |
| 164 |
0.6% |
91% |
| 165 |
0.8% |
91% |
| 166 |
1.4% |
90% |
| 167 |
2% |
89% |
| 168 |
2% |
87% |
| 169 |
2% |
85% |
| 170 |
3% |
83% |
| 171 |
2% |
79% |
| 172 |
2% |
77% |
| 173 |
3% |
75% |
| 174 |
0.6% |
72% |
| 175 |
2% |
71% |
| 176 |
4% |
69% |
| 177 |
7% |
65% |
| 178 |
10% |
58% |
| 179 |
3% |
48% |
| 180 |
2% |
45% |
| 181 |
4% |
42% |
| 182 |
4% |
39% |
| 183 |
5% |
35% |
| 184 |
7% |
30% |
| 185 |
9% |
23% |
| 186 |
3% |
14% |
| 187 |
2% |
11% |
| 188 |
2% |
9% |
| 189 |
1.2% |
7% |
| 190 |
1.3% |
6% |
| 191 |
1.0% |
4% |
| 192 |
0.6% |
3% |
| 193 |
0.5% |
3% |
| 194 |
0.4% |
2% |
| 195 |
0.4% |
2% |
| 196 |
0.3% |
2% |
| 197 |
0.3% |
1.3% |
| 198 |
0.2% |
1.0% |
| 199 |
0.1% |
0.8% |
| 200 |
0.1% |
0.6% |
| 201 |
0.1% |
0.5% |
| 202 |
0.1% |
0.4% |
| 203 |
0.1% |
0.2% |
| 204 |
0.1% |
0.2% |
| 205 |
0% |
0.1% |
| 206 |
0% |
0.1% |
| 207 |
0% |
0% |
Liberal Democrats
| Number of Seats |
Probability |
Accumulated |
| 0 |
3% |
100% |
| 1 |
2% |
97% |
| 2 |
10% |
95% |
| 3 |
14% |
85% |
| 4 |
30% |
72% |
| 5 |
16% |
41% |
| 6 |
20% |
26% |
| 7 |
5% |
6% |
| 8 |
0.2% |
0.5% |
| 9 |
0.1% |
0.3% |
| 10 |
0.1% |
0.2% |
| 11 |
0% |
0% |
UK Independence Party
| Number of Seats |
Probability |
Accumulated |
| 0 |
100% |
100% |
| 1 |
0% |
0% |
Green Party
| Number of Seats |
Probability |
Accumulated |
| 0 |
16% |
100% |
| 1 |
84% |
84% |
| 2 |
0.1% |
0.1% |
| 3 |
0% |
0% |
Coalitions

Confidence Intervals
| Coalition |
Last Result |
Median |
80% Confidence Interval |
90% Confidence Interval |
95% Confidence Interval |
99% Confidence Interval |
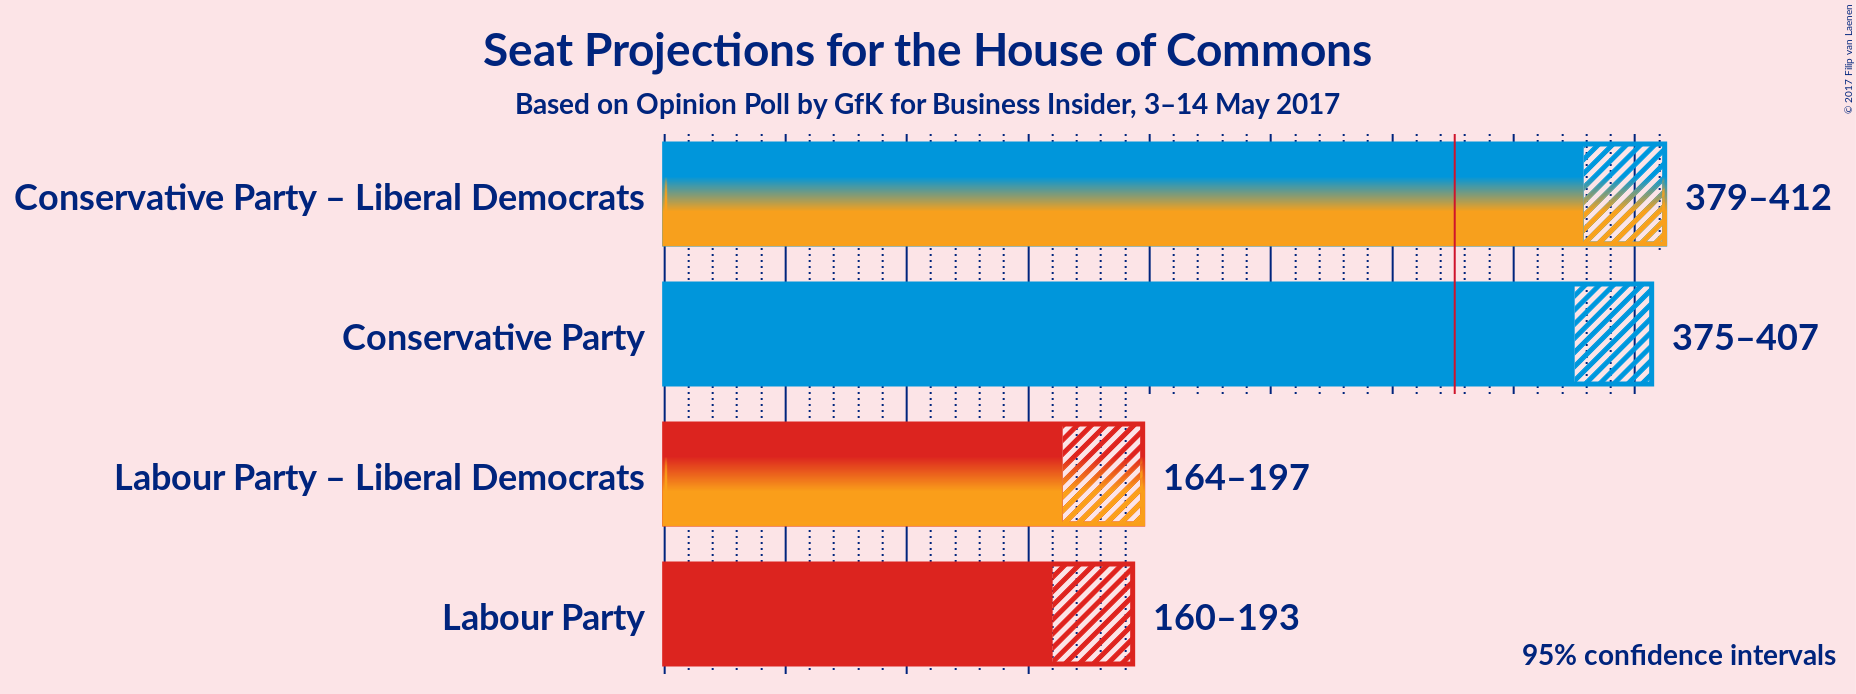
| Conservative Party – Liberal Democrats |
339 |
393 |
384–406 |
382–410 |
379–412 |
372–417 |
| Conservative Party |
331 |
389 |
381–401 |
378–405 |
375–407 |
368–412 |
| Labour Party – Liberal Democrats |
240 |
183 |
170–191 |
166–194 |
164–197 |
158–204 |
| Labour Party |
232 |
178 |
166–187 |
162–190 |
160–193 |
154–201 |
Conservative Party – Liberal Democrats
| Number of Seats |
Probability |
Accumulated |
| 366 |
0% |
100% |
| 367 |
0% |
99.9% |
| 368 |
0% |
99.9% |
| 369 |
0.1% |
99.9% |
| 370 |
0.1% |
99.8% |
| 371 |
0.1% |
99.7% |
| 372 |
0.1% |
99.6% |
| 373 |
0.2% |
99.4% |
| 374 |
0.2% |
99.3% |
| 375 |
0.2% |
99.0% |
| 376 |
0.4% |
98.8% |
| 377 |
0.3% |
98% |
| 378 |
0.5% |
98% |
| 379 |
0.5% |
98% |
| 380 |
0.9% |
97% |
| 381 |
1.1% |
96% |
| 382 |
1.3% |
95% |
| 383 |
2% |
94% |
| 384 |
2% |
92% |
| 385 |
4% |
90% |
| 386 |
5% |
86% |
| 387 |
7% |
81% |
| 388 |
6% |
74% |
| 389 |
4% |
68% |
| 390 |
4% |
64% |
| 391 |
3% |
59% |
| 392 |
3% |
56% |
| 393 |
8% |
53% |
| 394 |
5% |
46% |
| 395 |
7% |
40% |
| 396 |
2% |
33% |
| 397 |
3% |
31% |
| 398 |
3% |
29% |
| 399 |
1.1% |
26% |
| 400 |
3% |
25% |
| 401 |
2% |
21% |
| 402 |
2% |
19% |
| 403 |
3% |
17% |
| 404 |
2% |
14% |
| 405 |
1.5% |
12% |
| 406 |
1.2% |
11% |
| 407 |
1.0% |
10% |
| 408 |
1.4% |
9% |
| 409 |
2% |
7% |
| 410 |
2% |
6% |
| 411 |
1.3% |
4% |
| 412 |
0.8% |
3% |
| 413 |
0.3% |
2% |
| 414 |
0.4% |
1.5% |
| 415 |
0.2% |
1.1% |
| 416 |
0.3% |
0.9% |
| 417 |
0.2% |
0.6% |
| 418 |
0.2% |
0.4% |
| 419 |
0.1% |
0.3% |
| 420 |
0.1% |
0.2% |
| 421 |
0% |
0.1% |
| 422 |
0% |
0.1% |
| 423 |
0% |
0% |
Conservative Party
| Number of Seats |
Probability |
Accumulated |
| 363 |
0% |
100% |
| 364 |
0.1% |
99.9% |
| 365 |
0.1% |
99.9% |
| 366 |
0.1% |
99.8% |
| 367 |
0.1% |
99.7% |
| 368 |
0.2% |
99.6% |
| 369 |
0.1% |
99.4% |
| 370 |
0.1% |
99.3% |
| 371 |
0.3% |
99.2% |
| 372 |
0.3% |
98.8% |
| 373 |
0.6% |
98.6% |
| 374 |
0.2% |
98% |
| 375 |
0.4% |
98% |
| 376 |
0.8% |
97% |
| 377 |
2% |
97% |
| 378 |
1.2% |
95% |
| 379 |
1.5% |
94% |
| 380 |
2% |
92% |
| 381 |
2% |
90% |
| 382 |
8% |
88% |
| 383 |
8% |
80% |
| 384 |
6% |
72% |
| 385 |
4% |
67% |
| 386 |
4% |
62% |
| 387 |
2% |
58% |
| 388 |
2% |
56% |
| 389 |
11% |
54% |
| 390 |
7% |
44% |
| 391 |
5% |
37% |
| 392 |
2% |
32% |
| 393 |
0.6% |
29% |
| 394 |
3% |
28% |
| 395 |
2% |
26% |
| 396 |
3% |
23% |
| 397 |
3% |
21% |
| 398 |
3% |
18% |
| 399 |
2% |
15% |
| 400 |
2% |
13% |
| 401 |
2% |
12% |
| 402 |
0.6% |
10% |
| 403 |
0.5% |
9% |
| 404 |
2% |
9% |
| 405 |
3% |
7% |
| 406 |
2% |
4% |
| 407 |
0.7% |
3% |
| 408 |
0.4% |
2% |
| 409 |
0.4% |
2% |
| 410 |
0.3% |
1.2% |
| 411 |
0.2% |
0.9% |
| 412 |
0.2% |
0.7% |
| 413 |
0.2% |
0.5% |
| 414 |
0.1% |
0.3% |
| 415 |
0.1% |
0.2% |
| 416 |
0% |
0.1% |
| 417 |
0% |
0.1% |
| 418 |
0% |
0.1% |
| 419 |
0% |
0% |
Labour Party – Liberal Democrats
| Number of Seats |
Probability |
Accumulated |
| 153 |
0% |
100% |
| 154 |
0% |
99.9% |
| 155 |
0.1% |
99.9% |
| 156 |
0.1% |
99.9% |
| 157 |
0.2% |
99.8% |
| 158 |
0.1% |
99.6% |
| 159 |
0.3% |
99.5% |
| 160 |
0.2% |
99.2% |
| 161 |
0.4% |
99.0% |
| 162 |
0.3% |
98.7% |
| 163 |
0.4% |
98% |
| 164 |
0.7% |
98% |
| 165 |
1.5% |
97% |
| 166 |
2% |
96% |
| 167 |
2% |
94% |
| 168 |
1.1% |
92% |
| 169 |
0.7% |
91% |
| 170 |
1.2% |
90% |
| 171 |
1.5% |
89% |
| 172 |
2% |
88% |
| 173 |
2% |
86% |
| 174 |
3% |
83% |
| 175 |
3% |
81% |
| 176 |
3% |
78% |
| 177 |
2% |
75% |
| 178 |
2% |
73% |
| 179 |
2% |
71% |
| 180 |
3% |
69% |
| 181 |
7% |
66% |
| 182 |
7% |
59% |
| 183 |
7% |
52% |
| 184 |
3% |
45% |
| 185 |
3% |
42% |
| 186 |
4% |
39% |
| 187 |
5% |
36% |
| 188 |
6% |
30% |
| 189 |
8% |
24% |
| 190 |
5% |
16% |
| 191 |
2% |
11% |
| 192 |
2% |
9% |
| 193 |
1.2% |
7% |
| 194 |
1.4% |
6% |
| 195 |
1.0% |
4% |
| 196 |
0.8% |
3% |
| 197 |
0.4% |
3% |
| 198 |
0.3% |
2% |
| 199 |
0.4% |
2% |
| 200 |
0.3% |
2% |
| 201 |
0.3% |
1.2% |
| 202 |
0.2% |
0.9% |
| 203 |
0.1% |
0.8% |
| 204 |
0.2% |
0.6% |
| 205 |
0.1% |
0.5% |
| 206 |
0.1% |
0.3% |
| 207 |
0.1% |
0.2% |
| 208 |
0.1% |
0.1% |
| 209 |
0% |
0.1% |
| 210 |
0% |
0.1% |
| 211 |
0% |
0% |
Labour Party
| Number of Seats |
Probability |
Accumulated |
| 149 |
0% |
100% |
| 150 |
0% |
99.9% |
| 151 |
0.1% |
99.9% |
| 152 |
0.1% |
99.8% |
| 153 |
0.2% |
99.7% |
| 154 |
0.1% |
99.5% |
| 155 |
0.3% |
99.4% |
| 156 |
0.2% |
99.1% |
| 157 |
0.3% |
98.8% |
| 158 |
0.5% |
98.5% |
| 159 |
0.4% |
98% |
| 160 |
1.1% |
98% |
| 161 |
1.5% |
97% |
| 162 |
2% |
95% |
| 163 |
2% |
93% |
| 164 |
0.6% |
91% |
| 165 |
0.8% |
91% |
| 166 |
1.4% |
90% |
| 167 |
2% |
89% |
| 168 |
2% |
87% |
| 169 |
2% |
85% |
| 170 |
3% |
83% |
| 171 |
2% |
79% |
| 172 |
2% |
77% |
| 173 |
3% |
75% |
| 174 |
0.6% |
72% |
| 175 |
2% |
71% |
| 176 |
4% |
69% |
| 177 |
7% |
65% |
| 178 |
10% |
58% |
| 179 |
3% |
48% |
| 180 |
2% |
45% |
| 181 |
4% |
42% |
| 182 |
4% |
39% |
| 183 |
5% |
35% |
| 184 |
7% |
30% |
| 185 |
9% |
23% |
| 186 |
3% |
14% |
| 187 |
2% |
11% |
| 188 |
2% |
9% |
| 189 |
1.2% |
7% |
| 190 |
1.3% |
6% |
| 191 |
1.0% |
4% |
| 192 |
0.6% |
3% |
| 193 |
0.5% |
3% |
| 194 |
0.4% |
2% |
| 195 |
0.4% |
2% |
| 196 |
0.3% |
2% |
| 197 |
0.3% |
1.3% |
| 198 |
0.2% |
1.0% |
| 199 |
0.1% |
0.8% |
| 200 |
0.1% |
0.6% |
| 201 |
0.1% |
0.5% |
| 202 |
0.1% |
0.4% |
| 203 |
0.1% |
0.2% |
| 204 |
0.1% |
0.2% |
| 205 |
0% |
0.1% |
| 206 |
0% |
0.1% |
| 207 |
0% |
0% |
Opinion Poll
- Pollster: GfK
- Media: Business Insider
- Fieldwork period: 3–14 May 2017
Calculations
- Sample size: 1778
- Simulations done: 2,097,152
- Error estimate: 0.20%


