Opinion Poll by SurveyMonkey for The Sun, 24–25 May 2017
Voting Intentions | Seats | Coalitions | Technical Information
Voting Intentions

Confidence Intervals
| Party |
Last Result |
Poll Result |
80% Confidence Interval |
90% Confidence Interval |
95% Confidence Interval |
99% Confidence Interval |
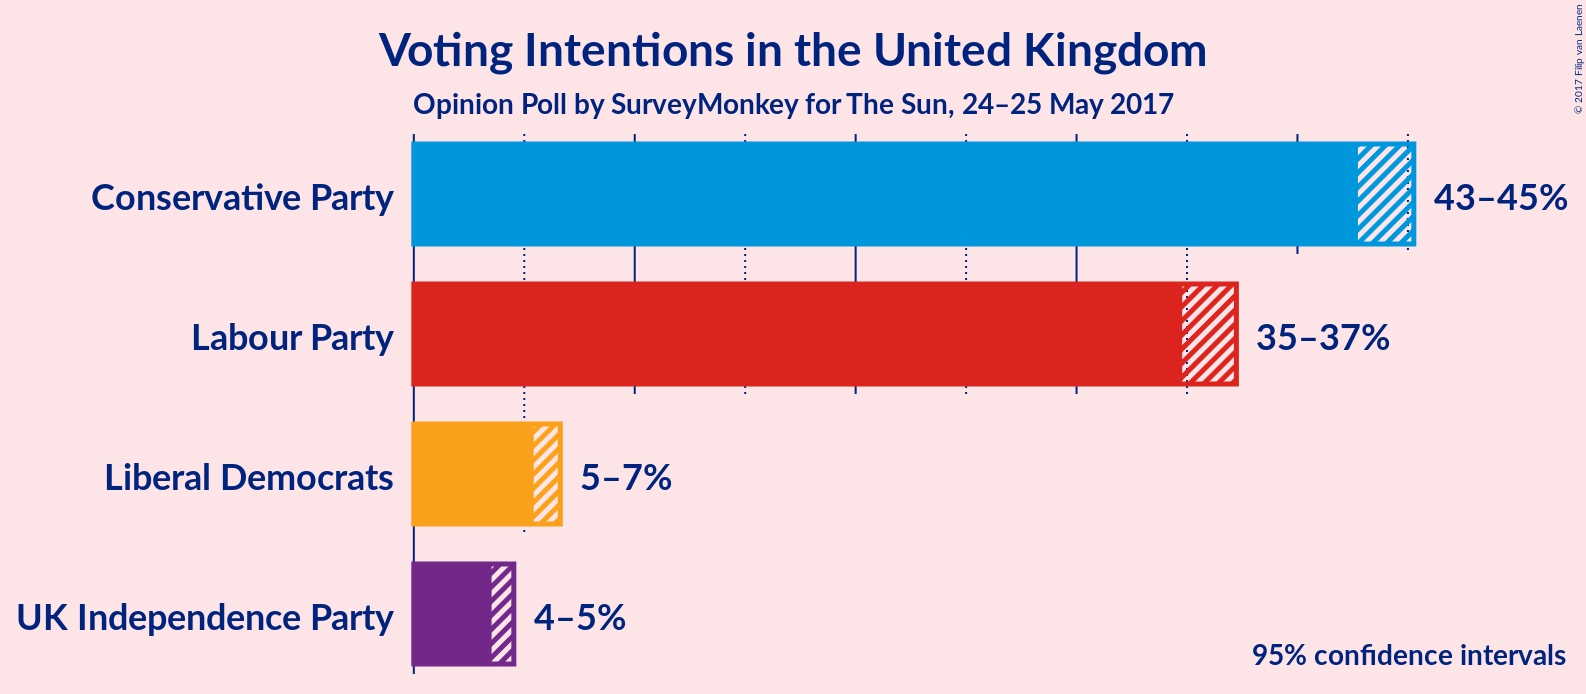
| Conservative Party |
36.9% |
48.9% |
43.2–44.8% |
42.9–45.1% |
42.7–45.3% |
42.3–45.7% |
| Labour Party |
30.4% |
40.0% |
35.2–36.8% |
35.0–37.0% |
34.8–37.2% |
34.4–37.6% |
| Liberal Democrats |
7.9% |
6.7% |
5.6–6.4% |
5.5–6.5% |
5.4–6.6% |
5.2–6.8% |
| UK Independence Party |
12.6% |
4.4% |
3.7–4.3% |
3.6–4.5% |
3.5–4.5% |
3.4–4.7% |
Note: The poll result column reflects the actual value used in the calculations. Published results may vary slightly, and in addition be rounded to fewer digits.
Seats

Confidence Intervals
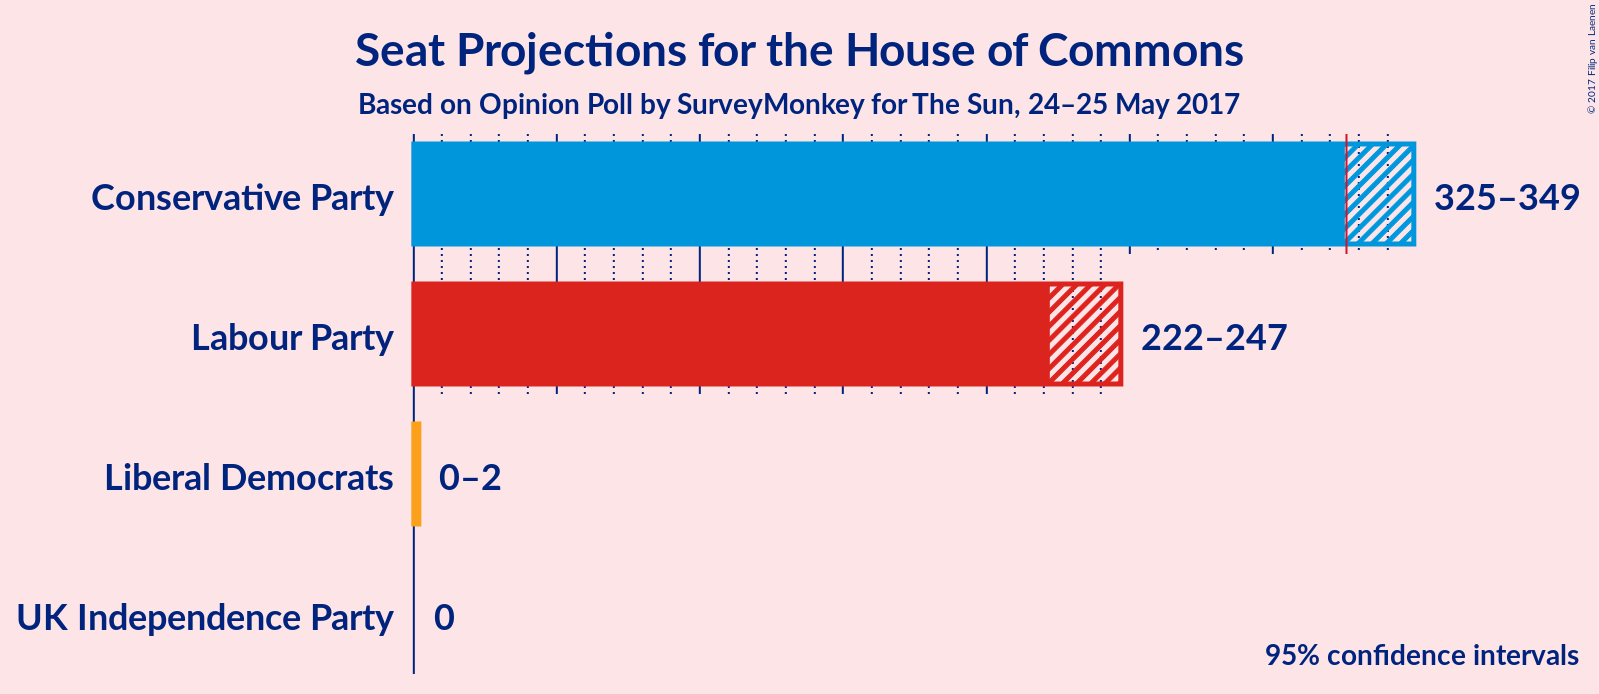
Conservative Party
| Number of Seats |
Probability |
Accumulated |
| 321 |
0.1% |
100% |
| 322 |
0.2% |
99.9% |
| 323 |
0.5% |
99.6% |
| 324 |
1.3% |
99.1% |
| 325 |
1.5% |
98% |
| 326 |
0.7% |
96% |
| 327 |
0.7% |
96% |
| 328 |
2% |
95% |
| 329 |
2% |
93% |
| 330 |
3% |
91% |
| 331 |
3% |
88% |
| 332 |
2% |
85% |
| 333 |
7% |
83% |
| 334 |
8% |
76% |
| 335 |
4% |
68% |
| 336 |
4% |
64% |
| 337 |
9% |
60% |
| 338 |
10% |
51% |
| 339 |
7% |
41% |
| 340 |
4% |
35% |
| 341 |
3% |
31% |
| 342 |
6% |
28% |
| 343 |
8% |
21% |
| 344 |
2% |
13% |
| 345 |
1.4% |
10% |
| 346 |
1.5% |
9% |
| 347 |
2% |
7% |
| 348 |
1.2% |
5% |
| 349 |
2% |
4% |
| 350 |
1.0% |
2% |
| 351 |
0.9% |
0.9% |
| 352 |
0% |
0.1% |
| 353 |
0% |
0% |
Labour Party
| Number of Seats |
Probability |
Accumulated |
| 219 |
0% |
100% |
| 220 |
1.1% |
99.9% |
| 221 |
1.0% |
98.8% |
| 222 |
2% |
98% |
| 223 |
0.8% |
95% |
| 224 |
3% |
95% |
| 225 |
0.8% |
92% |
| 226 |
2% |
91% |
| 227 |
3% |
89% |
| 228 |
12% |
86% |
| 229 |
4% |
75% |
| 230 |
3% |
71% |
| 231 |
5% |
68% |
| 232 |
8% |
64% |
| 233 |
11% |
56% |
| 234 |
7% |
45% |
| 235 |
2% |
38% |
| 236 |
4% |
35% |
| 237 |
6% |
32% |
| 238 |
7% |
25% |
| 239 |
2% |
18% |
| 240 |
2% |
16% |
| 241 |
4% |
14% |
| 242 |
2% |
9% |
| 243 |
2% |
8% |
| 244 |
0.9% |
5% |
| 245 |
0.2% |
4% |
| 246 |
1.4% |
4% |
| 247 |
2% |
3% |
| 248 |
0.7% |
1.2% |
| 249 |
0.3% |
0.5% |
| 250 |
0.2% |
0.2% |
| 251 |
0% |
0% |
Liberal Democrats
| Number of Seats |
Probability |
Accumulated |
| 0 |
52% |
100% |
| 1 |
8% |
48% |
| 2 |
39% |
39% |
| 3 |
0% |
0% |
UK Independence Party
| Number of Seats |
Probability |
Accumulated |
| 0 |
100% |
100% |
| 1 |
0% |
0% |
Coalitions

Confidence Intervals
| Coalition |
Last Result |
Median |
80% Confidence Interval |
90% Confidence Interval |
95% Confidence Interval |
99% Confidence Interval |
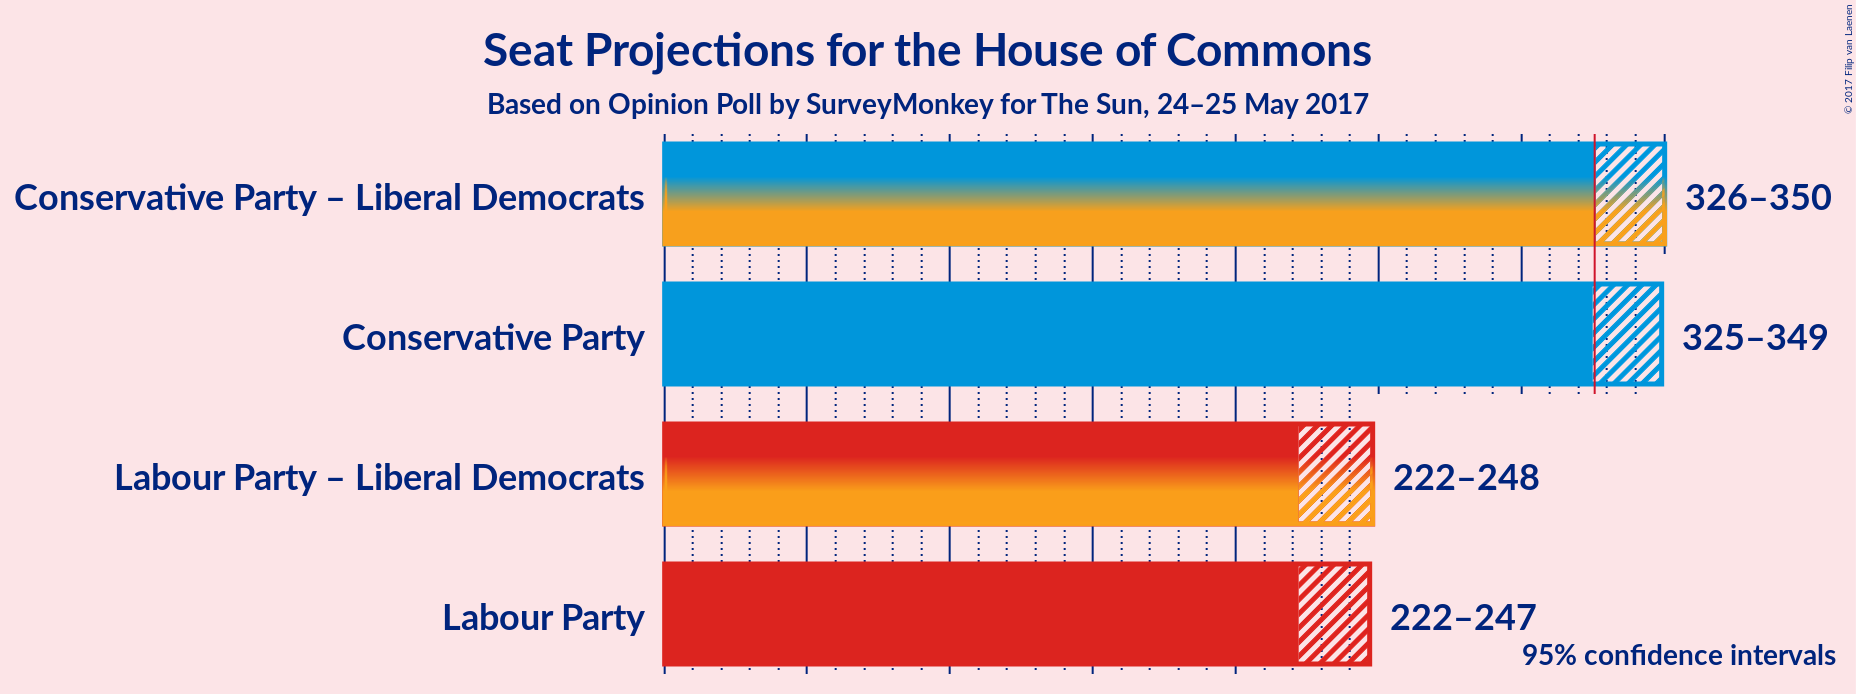
| Conservative Party – Liberal Democrats |
339 |
338 |
331–345 |
329–348 |
326–350 |
324–352 |
| Conservative Party |
331 |
338 |
330–345 |
327–348 |
325–349 |
323–351 |
| Labour Party – Liberal Democrats |
240 |
234 |
227–243 |
224–245 |
222–248 |
220–250 |
| Labour Party |
232 |
233 |
226–241 |
223–244 |
222–247 |
220–248 |
Conservative Party – Liberal Democrats
| Number of Seats |
Probability |
Accumulated |
| 322 |
0.1% |
100% |
| 323 |
0.2% |
99.9% |
| 324 |
0.5% |
99.6% |
| 325 |
1.3% |
99.1% |
| 326 |
2% |
98% |
| 327 |
0.7% |
96% |
| 328 |
0.6% |
96% |
| 329 |
2% |
95% |
| 330 |
2% |
93% |
| 331 |
3% |
91% |
| 332 |
3% |
88% |
| 333 |
2% |
85% |
| 334 |
7% |
83% |
| 335 |
8% |
75% |
| 336 |
3% |
67% |
| 337 |
5% |
64% |
| 338 |
10% |
59% |
| 339 |
10% |
49% |
| 340 |
6% |
40% |
| 341 |
4% |
34% |
| 342 |
3% |
30% |
| 343 |
8% |
27% |
| 344 |
7% |
19% |
| 345 |
2% |
12% |
| 346 |
1.2% |
10% |
| 347 |
2% |
9% |
| 348 |
2% |
7% |
| 349 |
2% |
5% |
| 350 |
2% |
3% |
| 351 |
1.1% |
2% |
| 352 |
0.5% |
0.5% |
| 353 |
0% |
0.1% |
| 354 |
0% |
0% |
Conservative Party
| Number of Seats |
Probability |
Accumulated |
| 321 |
0.1% |
100% |
| 322 |
0.2% |
99.9% |
| 323 |
0.5% |
99.6% |
| 324 |
1.3% |
99.1% |
| 325 |
1.5% |
98% |
| 326 |
0.7% |
96% |
| 327 |
0.7% |
96% |
| 328 |
2% |
95% |
| 329 |
2% |
93% |
| 330 |
3% |
91% |
| 331 |
3% |
88% |
| 332 |
2% |
85% |
| 333 |
7% |
83% |
| 334 |
8% |
76% |
| 335 |
4% |
68% |
| 336 |
4% |
64% |
| 337 |
9% |
60% |
| 338 |
10% |
51% |
| 339 |
7% |
41% |
| 340 |
4% |
35% |
| 341 |
3% |
31% |
| 342 |
6% |
28% |
| 343 |
8% |
21% |
| 344 |
2% |
13% |
| 345 |
1.4% |
10% |
| 346 |
1.5% |
9% |
| 347 |
2% |
7% |
| 348 |
1.2% |
5% |
| 349 |
2% |
4% |
| 350 |
1.0% |
2% |
| 351 |
0.9% |
0.9% |
| 352 |
0% |
0.1% |
| 353 |
0% |
0% |
Labour Party – Liberal Democrats
| Number of Seats |
Probability |
Accumulated |
| 219 |
0% |
100% |
| 220 |
0.7% |
99.9% |
| 221 |
0.8% |
99.3% |
| 222 |
2% |
98% |
| 223 |
1.1% |
97% |
| 224 |
3% |
96% |
| 225 |
1.0% |
93% |
| 226 |
2% |
92% |
| 227 |
2% |
90% |
| 228 |
7% |
88% |
| 229 |
4% |
81% |
| 230 |
6% |
77% |
| 231 |
4% |
71% |
| 232 |
6% |
67% |
| 233 |
8% |
61% |
| 234 |
7% |
53% |
| 235 |
7% |
46% |
| 236 |
5% |
39% |
| 237 |
4% |
35% |
| 238 |
7% |
31% |
| 239 |
5% |
24% |
| 240 |
4% |
19% |
| 241 |
3% |
16% |
| 242 |
2% |
13% |
| 243 |
3% |
10% |
| 244 |
1.4% |
7% |
| 245 |
1.2% |
6% |
| 246 |
1.0% |
5% |
| 247 |
1.0% |
4% |
| 248 |
1.2% |
3% |
| 249 |
1.0% |
2% |
| 250 |
0.4% |
0.7% |
| 251 |
0.2% |
0.3% |
| 252 |
0.1% |
0.1% |
| 253 |
0% |
0% |
Labour Party
| Number of Seats |
Probability |
Accumulated |
| 219 |
0% |
100% |
| 220 |
1.1% |
99.9% |
| 221 |
1.0% |
98.8% |
| 222 |
2% |
98% |
| 223 |
0.8% |
95% |
| 224 |
3% |
95% |
| 225 |
0.8% |
92% |
| 226 |
2% |
91% |
| 227 |
3% |
89% |
| 228 |
12% |
86% |
| 229 |
4% |
75% |
| 230 |
3% |
71% |
| 231 |
5% |
68% |
| 232 |
8% |
64% |
| 233 |
11% |
56% |
| 234 |
7% |
45% |
| 235 |
2% |
38% |
| 236 |
4% |
35% |
| 237 |
6% |
32% |
| 238 |
7% |
25% |
| 239 |
2% |
18% |
| 240 |
2% |
16% |
| 241 |
4% |
14% |
| 242 |
2% |
9% |
| 243 |
2% |
8% |
| 244 |
0.9% |
5% |
| 245 |
0.2% |
4% |
| 246 |
1.4% |
4% |
| 247 |
2% |
3% |
| 248 |
0.7% |
1.2% |
| 249 |
0.3% |
0.5% |
| 250 |
0.2% |
0.2% |
| 251 |
0% |
0% |
Opinion Poll
- Pollster: SurveyMonkey
- Media: The Sun
- Fieldwork period: 24–25 May 2017
Calculations
- Sample size: 5400
- Simulations done: 2,097,152
- Error estimate: 0.05%


