Opinion Poll by Market for ÖSTERREICH, 26–28 February 2024
Voting Intentions | Seats | Coalitions | Technical Information
Voting Intentions

Confidence Intervals
| Party | Last Result | Poll Result | 80% Confidence Interval | 90% Confidence Interval | 95% Confidence Interval | 99% Confidence Interval |
|---|---|---|---|---|---|---|
| Freiheitliche Partei Österreichs | 16.2% | 26.0% | 24.3–27.8% | 23.8–28.4% | 23.4–28.8% | 22.6–29.7% |
| Sozialdemokratische Partei Österreichs | 21.2% | 22.0% | 20.4–23.7% | 19.9–24.2% | 19.5–24.7% | 18.8–25.5% |
| Österreichische Volkspartei | 37.5% | 20.0% | 18.4–21.7% | 18.0–22.2% | 17.6–22.6% | 16.9–23.4% |
| NEOS–Das Neue Österreich und Liberales Forum | 8.1% | 16.0% | 14.6–17.6% | 14.2–18.0% | 13.9–18.4% | 13.2–19.2% |
| Die Grünen–Die Grüne Alternative | 13.9% | 14.0% | 12.7–15.5% | 12.3–15.9% | 12.0–16.3% | 11.4–17.0% |
| Kommunistische Partei Österreichs | N/A | 2.0% | 1.5–2.7% | 1.4–2.9% | 1.3–3.1% | 1.1–3.4% |
Note: The poll result column reflects the actual value used in the calculations. Published results may vary slightly, and in addition be rounded to fewer digits.
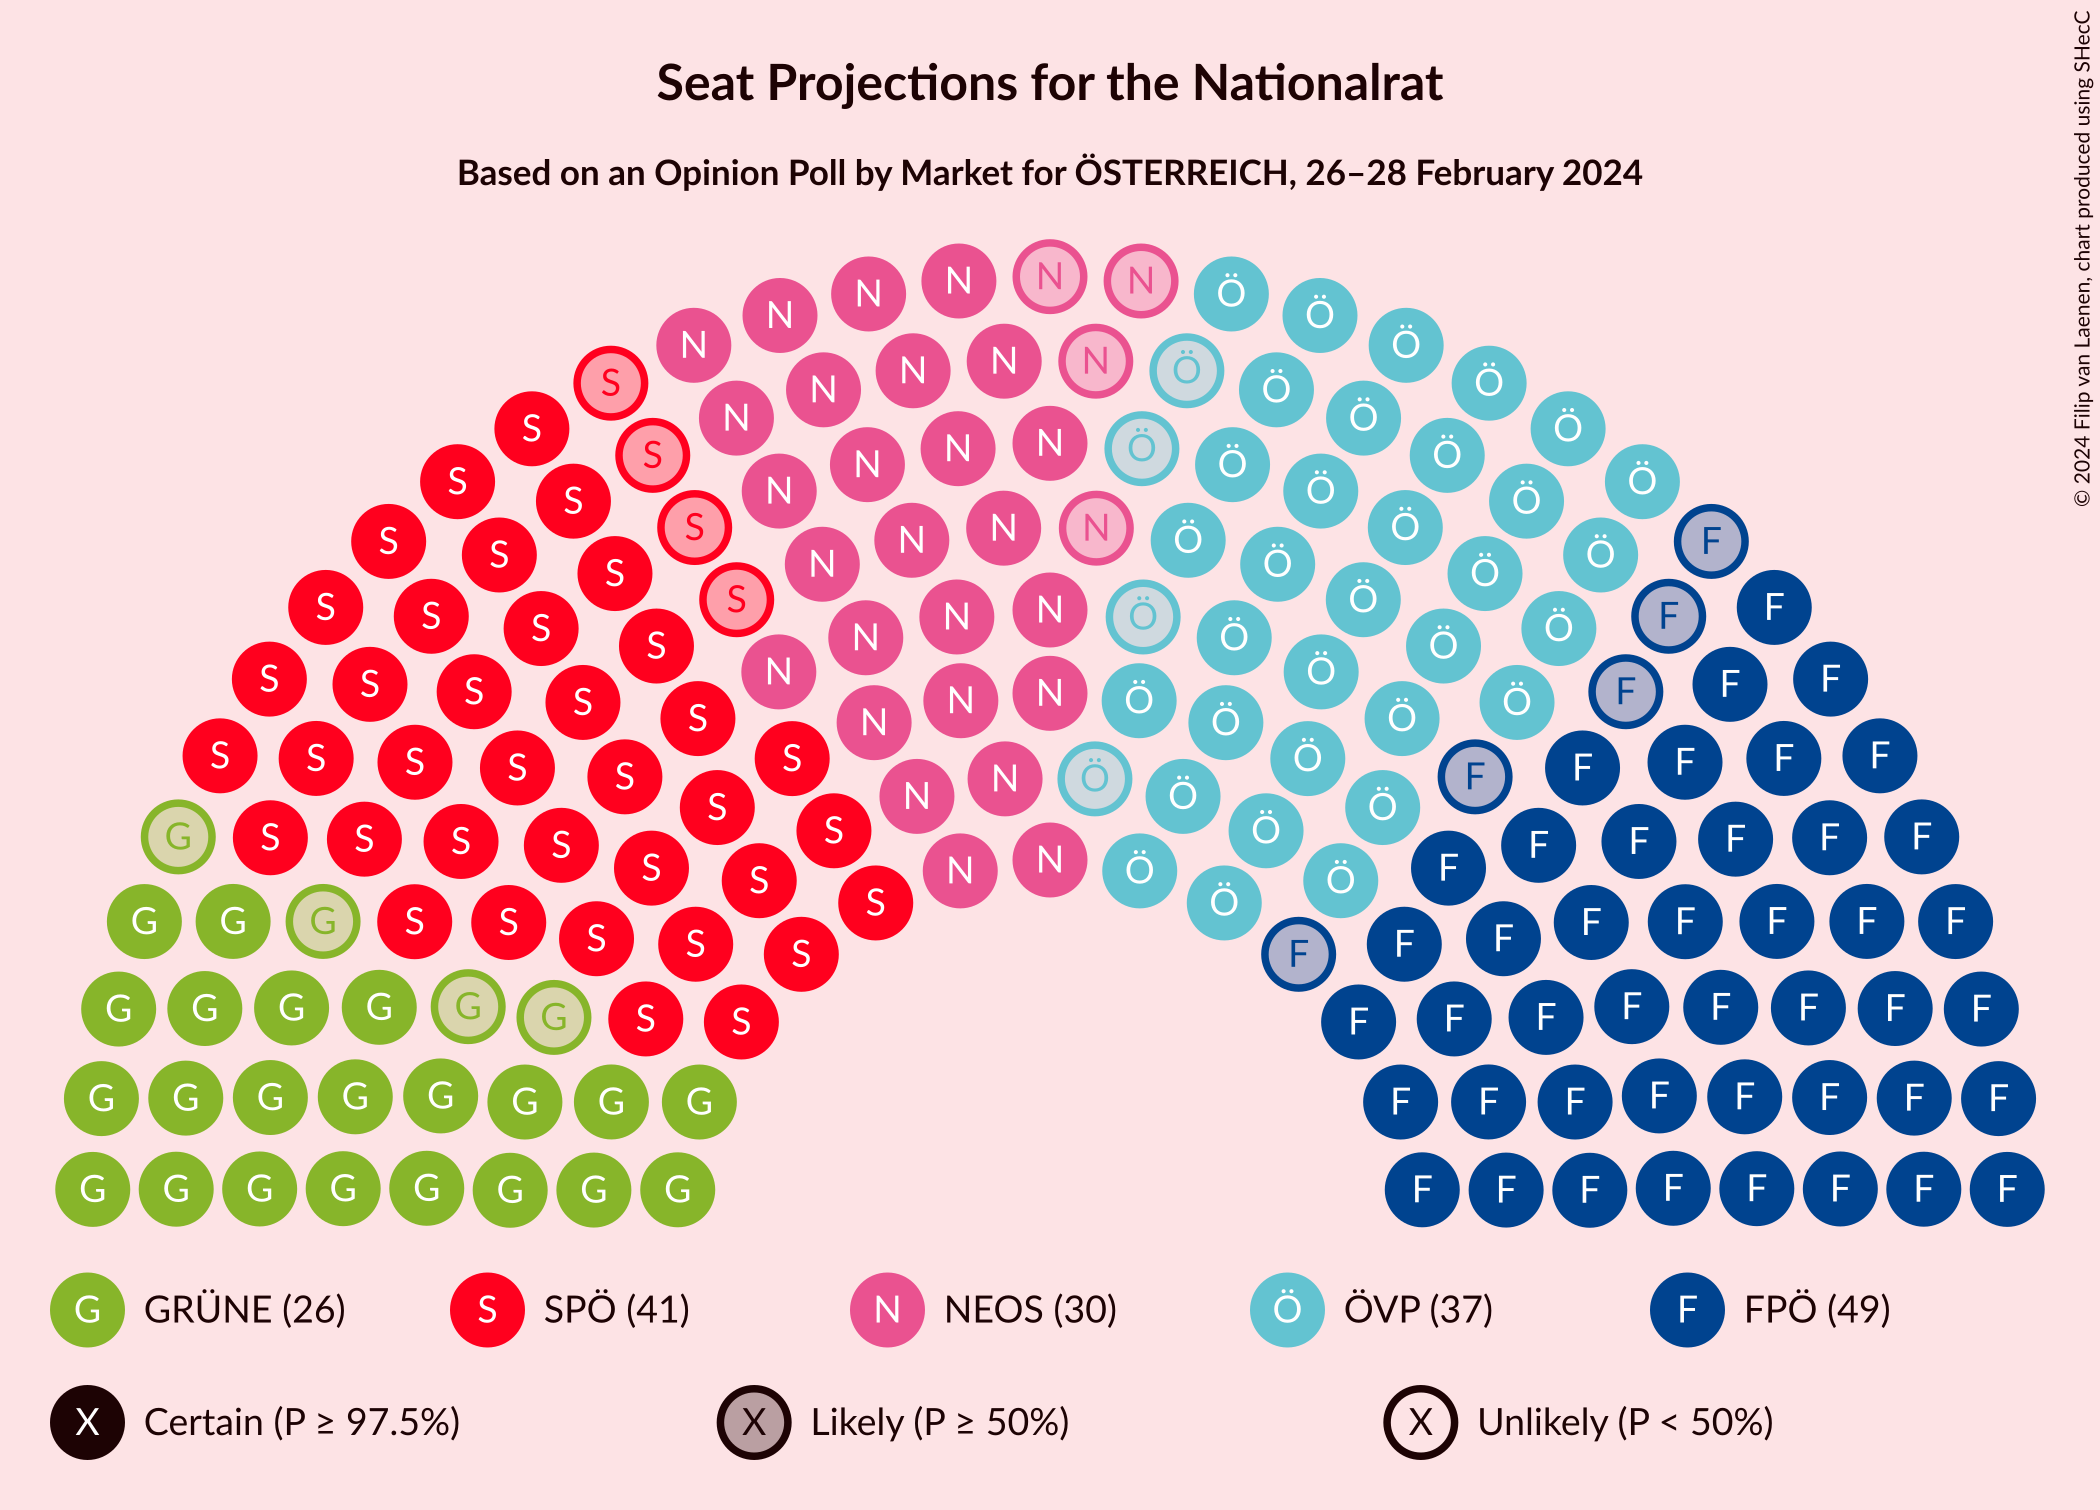
Seats


Confidence Intervals
| Party | Last Result | Median | 80% Confidence Interval | 90% Confidence Interval | 95% Confidence Interval | 99% Confidence Interval |
|---|---|---|---|---|---|---|
| Freiheitliche Partei Österreichs | 31 | 49 | 45–52 | 44–53 | 44–54 | 42–56 |
| Sozialdemokratische Partei Österreichs | 40 | 41 | 38–44 | 37–45 | 37–46 | 35–48 |
| Österreichische Volkspartei | 71 | 37 | 34–40 | 33–41 | 33–42 | 31–44 |
| NEOS–Das Neue Österreich und Liberales Forum | 15 | 30 | 27–33 | 26–33 | 26–34 | 24–36 |
| Die Grünen–Die Grüne Alternative | 26 | 26 | 23–29 | 23–30 | 22–30 | 21–31 |
| Kommunistische Partei Österreichs | N/A | 0 | 0 | 0 | 0 | 0 |