Poll Average
Voting Intentions | Seats | Coalitions | Technical Information
Summary
The table below lists the polls on which the average is based. They are the most recent polls (less than 90 days old) registered and analyzed so far.
| Period | Polling firm/Commissioner(s) | ÖVP | SPÖ | FPÖ | GRÜNE | NEOS | JETZT | G!LT | KPÖ | HC | BIER | DNA | LMP | KEINE |
|---|---|---|---|---|---|---|---|---|---|---|---|---|---|---|
| 29 September 2019 | General Election | 37.5% 71 |
21.2% 40 |
16.2% 31 |
13.9% 26 |
8.1% 15 |
1.9% 0 |
0.0% 0 |
0.7% 0 |
0.0% 0 |
0.0% 0 |
0.0% 0 |
0.0% 0 |
0.0% 0 |
| N/A | Poll Average | 21–27% 41–54 |
18–24% 36–46 |
24–31% 48–60 |
7–11% 13–22 |
7–12% 13–23 |
N/A N/A |
N/A N/A |
2–5% 0–9 |
N/A N/A |
2–6% 0–12 |
N/A N/A |
0–2% 0 |
1–2% 0 |
| 19–22 September 2024 | IFDD ATV, Kronen Zeitung and PULS 24 |
22–28% 44–55 |
19–24% 36–47 |
24–30% 48–60 |
7–11% 14–21 |
7–11% 14–21 |
N/A N/A |
N/A N/A |
2–4% 0–9 |
N/A N/A |
2–4% 0–9 |
N/A N/A |
N/A N/A |
N/A N/A |
| 16–18 September 2024 | OGM Servus TV |
22–28% 45–56 |
19–24% 37–47 |
23–29% 47–57 |
8–12% 16–23 |
7–11% 14–22 |
N/A N/A |
N/A N/A |
2–4% 0–8 |
N/A N/A |
2–4% 0–8 |
N/A N/A |
1–2% 0 |
1–2% 0 |
| 9–17 September 2024 | Market ÖSTERREICH |
23–27% 45–54 |
18–22% 36–43 |
25–29% 49–58 |
7–9% 13–18 |
10–12% 18–24 |
N/A N/A |
N/A N/A |
3–5% 0–9 |
N/A N/A |
2–4% 0 |
N/A N/A |
0–1% 0 |
1–2% 0 |
| 5–11 September 2024 | Unique Research Heute |
22–28% 43–56 |
18–24% 35–47 |
25–31% 48–62 |
7–11% 14–22 |
6–10% 12–19 |
N/A N/A |
N/A N/A |
2–4% 0–8 |
N/A N/A |
3–6% 0–10 |
N/A N/A |
1–2% 0 |
N/A N/A |
| 9–11 September 2024 | INSA eXXpress |
20–26% 40–50 |
19–24% 36–46 |
26–32% 51–63 |
6–10% 12–19 |
6–10% 12–19 |
N/A N/A |
N/A N/A |
2–4% 0–8 |
N/A N/A |
4–7% 0–12 |
N/A N/A |
N/A N/A |
N/A N/A |
| 2–9 September 2024 | Spectra Kleine Zeitung, OÖNachrichten and Salzburger Nachrichten |
21–27% 41–52 |
19–24% 36–46 |
24–30% 47–58 |
6–10% 12–19 |
8–12% 16–23 |
N/A N/A |
N/A N/A |
2–4% 0–8 |
N/A N/A |
4–7% 0–12 |
N/A N/A |
N/A N/A |
N/A N/A |
| 26 August–3 September 2024 | Triple M News |
20–26% 39–50 |
19–24% 35–46 |
25–31% 48–60 |
6–10% 12–19 |
8–11% 15–22 |
N/A N/A |
N/A N/A |
3–5% 0–9 |
N/A N/A |
4–7% 0–12 |
N/A N/A |
N/A N/A |
N/A N/A |
| 29 September 2019 | General Election | 37.5% 71 |
21.2% 40 |
16.2% 31 |
13.9% 26 |
8.1% 15 |
1.9% 0 |
0.0% 0 |
0.7% 0 |
0.0% 0 |
0.0% 0 |
0.0% 0 |
0.0% 0 |
0.0% 0 |
Only polls for which at least the sample size has been published are included in the table above.
Legend:
- Top half of each row: Voting intentions (95% confidence interval)
- Bottom half of each row: Seat projections for the Nationalrat (95% confidence interval)
- ÖVP: Österreichische Volkspartei
- SPÖ: Sozialdemokratische Partei Österreichs
- FPÖ: Freiheitliche Partei Österreichs
- GRÜNE: Die Grünen–Die Grüne Alternative
- NEOS: NEOS–Das Neue Österreich und Liberales Forum
- JETZT: JETZT–Liste Pilz
- G!LT: Meine Stimme G!LT
- KPÖ: Kommunistische Partei Österreichs
- HC: Team HC Strache–Allianz für Österreich
- BIER: Bierpartei
- DNA: Demokratisch – Neutral – Authentisch
- LMP: Liste Madeleine Petrovic
- KEINE: Wandel
- N/A (single party): Party not included the published results
- N/A (entire row): Calculation for this opinion poll not started yet
Voting Intentions

Confidence Intervals
| Party | Last Result | Median | 80% Confidence Interval | 90% Confidence Interval | 95% Confidence Interval | 99% Confidence Interval |
|---|---|---|---|---|---|---|
| Österreichische Volkspartei | 37.5% | 24.4% | 22.2–26.3% | 21.7–26.9% | 21.2–27.4% | 20.3–28.4% |
| Sozialdemokratische Partei Österreichs | 21.2% | 20.9% | 19.3–22.6% | 18.8–23.2% | 18.5–23.6% | 17.8–24.5% |
| Freiheitliche Partei Österreichs | 16.2% | 27.4% | 25.4–29.6% | 24.9–30.3% | 24.4–30.9% | 23.4–32.0% |
| Die Grünen–Die Grüne Alternative | 13.9% | 8.5% | 7.3–10.2% | 7.0–10.7% | 6.7–11.1% | 6.2–11.9% |
| NEOS–Das Neue Österreich und Liberales Forum | 8.1% | 9.2% | 7.6–11.1% | 7.2–11.5% | 6.9–11.8% | 6.3–12.4% |
| JETZT–Liste Pilz | 1.9% | N/A | N/A | N/A | N/A | N/A |
| Kommunistische Partei Österreichs | 0.7% | 3.3% | 2.5–4.2% | 2.3–4.4% | 2.2–4.6% | 1.9–5.1% |
| Meine Stimme G!LT | 0.0% | N/A | N/A | N/A | N/A | N/A |
| Team HC Strache–Allianz für Österreich | 0.0% | N/A | N/A | N/A | N/A | N/A |
| Bierpartei | 0.0% | 4.0% | 2.7–5.6% | 2.5–5.9% | 2.4–6.2% | 2.1–6.8% |
| Demokratisch – Neutral – Authentisch | 0.0% | N/A | N/A | N/A | N/A | N/A |
| Liste Madeleine Petrovic | 0.0% | 0.8% | 0.2–1.5% | 0.2–1.6% | 0.1–1.8% | 0.1–2.1% |
| Wandel | 0.0% | 1.0% | 0.7–1.4% | 0.6–1.6% | 0.6–1.7% | 0.5–2.0% |
Österreichische Volkspartei
For a full overview of the results for this party, see the Österreichische Volkspartei page.
| Voting Intentions | Probability | Accumulated | Special Marks |
|---|---|---|---|
| 17.5–18.5% | 0% | 100% | |
| 18.5–19.5% | 0.1% | 100% | |
| 19.5–20.5% | 0.8% | 99.9% | |
| 20.5–21.5% | 3% | 99.1% | |
| 21.5–22.5% | 9% | 96% | |
| 22.5–23.5% | 17% | 86% | |
| 23.5–24.5% | 24% | 69% | Median |
| 24.5–25.5% | 23% | 46% | |
| 25.5–26.5% | 15% | 22% | |
| 26.5–27.5% | 6% | 8% | |
| 27.5–28.5% | 2% | 2% | |
| 28.5–29.5% | 0.3% | 0.4% | |
| 29.5–30.5% | 0% | 0.1% | |
| 30.5–31.5% | 0% | 0% | |
| 31.5–32.5% | 0% | 0% | |
| 32.5–33.5% | 0% | 0% | |
| 33.5–34.5% | 0% | 0% | |
| 34.5–35.5% | 0% | 0% | |
| 35.5–36.5% | 0% | 0% | |
| 36.5–37.5% | 0% | 0% | |
| 37.5–38.5% | 0% | 0% | Last Result |
Sozialdemokratische Partei Österreichs
For a full overview of the results for this party, see the Sozialdemokratische Partei Österreichs page.
| Voting Intentions | Probability | Accumulated | Special Marks |
|---|---|---|---|
| 15.5–16.5% | 0% | 100% | |
| 16.5–17.5% | 0.3% | 100% | |
| 17.5–18.5% | 3% | 99.7% | |
| 18.5–19.5% | 12% | 97% | |
| 19.5–20.5% | 25% | 85% | |
| 20.5–21.5% | 29% | 59% | Last Result, Median |
| 21.5–22.5% | 20% | 31% | |
| 22.5–23.5% | 8% | 11% | |
| 23.5–24.5% | 2% | 3% | |
| 24.5–25.5% | 0.4% | 0.4% | |
| 25.5–26.5% | 0% | 0.1% | |
| 26.5–27.5% | 0% | 0% |
Freiheitliche Partei Österreichs
For a full overview of the results for this party, see the Freiheitliche Partei Österreichs page.
| Voting Intentions | Probability | Accumulated | Special Marks |
|---|---|---|---|
| 15.5–16.5% | 0% | 100% | Last Result |
| 16.5–17.5% | 0% | 100% | |
| 17.5–18.5% | 0% | 100% | |
| 18.5–19.5% | 0% | 100% | |
| 19.5–20.5% | 0% | 100% | |
| 20.5–21.5% | 0% | 100% | |
| 21.5–22.5% | 0.1% | 100% | |
| 22.5–23.5% | 0.5% | 99.9% | |
| 23.5–24.5% | 3% | 99.4% | |
| 24.5–25.5% | 8% | 97% | |
| 25.5–26.5% | 18% | 88% | |
| 26.5–27.5% | 24% | 70% | Median |
| 27.5–28.5% | 21% | 46% | |
| 28.5–29.5% | 14% | 25% | |
| 29.5–30.5% | 7% | 11% | |
| 30.5–31.5% | 3% | 4% | |
| 31.5–32.5% | 0.8% | 1.0% | |
| 32.5–33.5% | 0.1% | 0.2% | |
| 33.5–34.5% | 0% | 0% |
Die Grünen–Die Grüne Alternative
For a full overview of the results for this party, see the Die Grünen–Die Grüne Alternative page.
| Voting Intentions | Probability | Accumulated | Special Marks |
|---|---|---|---|
| 4.5–5.5% | 0% | 100% | |
| 5.5–6.5% | 1.5% | 100% | |
| 6.5–7.5% | 15% | 98.5% | |
| 7.5–8.5% | 35% | 84% | |
| 8.5–9.5% | 28% | 49% | Median |
| 9.5–10.5% | 15% | 21% | |
| 10.5–11.5% | 5% | 6% | |
| 11.5–12.5% | 1.0% | 1.1% | |
| 12.5–13.5% | 0.1% | 0.1% | |
| 13.5–14.5% | 0% | 0% | Last Result |
NEOS–Das Neue Österreich und Liberales Forum
For a full overview of the results for this party, see the NEOS–Das Neue Österreich und Liberales Forum page.
| Voting Intentions | Probability | Accumulated | Special Marks |
|---|---|---|---|
| 4.5–5.5% | 0% | 100% | |
| 5.5–6.5% | 1.1% | 100% | |
| 6.5–7.5% | 8% | 98.8% | |
| 7.5–8.5% | 21% | 91% | Last Result |
| 8.5–9.5% | 28% | 69% | Median |
| 9.5–10.5% | 23% | 41% | |
| 10.5–11.5% | 14% | 19% | |
| 11.5–12.5% | 4% | 4% | |
| 12.5–13.5% | 0.3% | 0.3% | |
| 13.5–14.5% | 0% | 0% |
Kommunistische Partei Österreichs
For a full overview of the results for this party, see the Kommunistische Partei Österreichs page.
| Voting Intentions | Probability | Accumulated | Special Marks |
|---|---|---|---|
| 0.5–1.5% | 0% | 100% | Last Result |
| 1.5–2.5% | 12% | 100% | |
| 2.5–3.5% | 54% | 88% | Median |
| 3.5–4.5% | 31% | 34% | |
| 4.5–5.5% | 3% | 3% | |
| 5.5–6.5% | 0% | 0% | |
| 6.5–7.5% | 0% | 0% |
Bierpartei
For a full overview of the results for this party, see the Bierpartei page.
| Voting Intentions | Probability | Accumulated | Special Marks |
|---|---|---|---|
| 0.0–0.5% | 0% | 100% | Last Result |
| 0.5–1.5% | 0% | 100% | |
| 1.5–2.5% | 6% | 100% | |
| 2.5–3.5% | 33% | 94% | |
| 3.5–4.5% | 24% | 61% | Median |
| 4.5–5.5% | 26% | 37% | |
| 5.5–6.5% | 10% | 11% | |
| 6.5–7.5% | 1.0% | 1.0% | |
| 7.5–8.5% | 0% | 0% |
Liste Madeleine Petrovic
For a full overview of the results for this party, see the Liste Madeleine Petrovic page.
| Voting Intentions | Probability | Accumulated | Special Marks |
|---|---|---|---|
| 0.0–0.5% | 34% | 100% | Last Result |
| 0.5–1.5% | 59% | 66% | Median |
| 1.5–2.5% | 7% | 7% | |
| 2.5–3.5% | 0.1% | 0.1% | |
| 3.5–4.5% | 0% | 0% |
Wandel
For a full overview of the results for this party, see the Wandel page.
| Voting Intentions | Probability | Accumulated | Special Marks |
|---|---|---|---|
| 0.0–0.5% | 2% | 100% | Last Result |
| 0.5–1.5% | 93% | 98% | Median |
| 1.5–2.5% | 5% | 5% | |
| 2.5–3.5% | 0% | 0% |
Seats
Confidence Intervals
| Party | Last Result | Median | 80% Confidence Interval | 90% Confidence Interval | 95% Confidence Interval | 99% Confidence Interval |
|---|---|---|---|---|---|---|
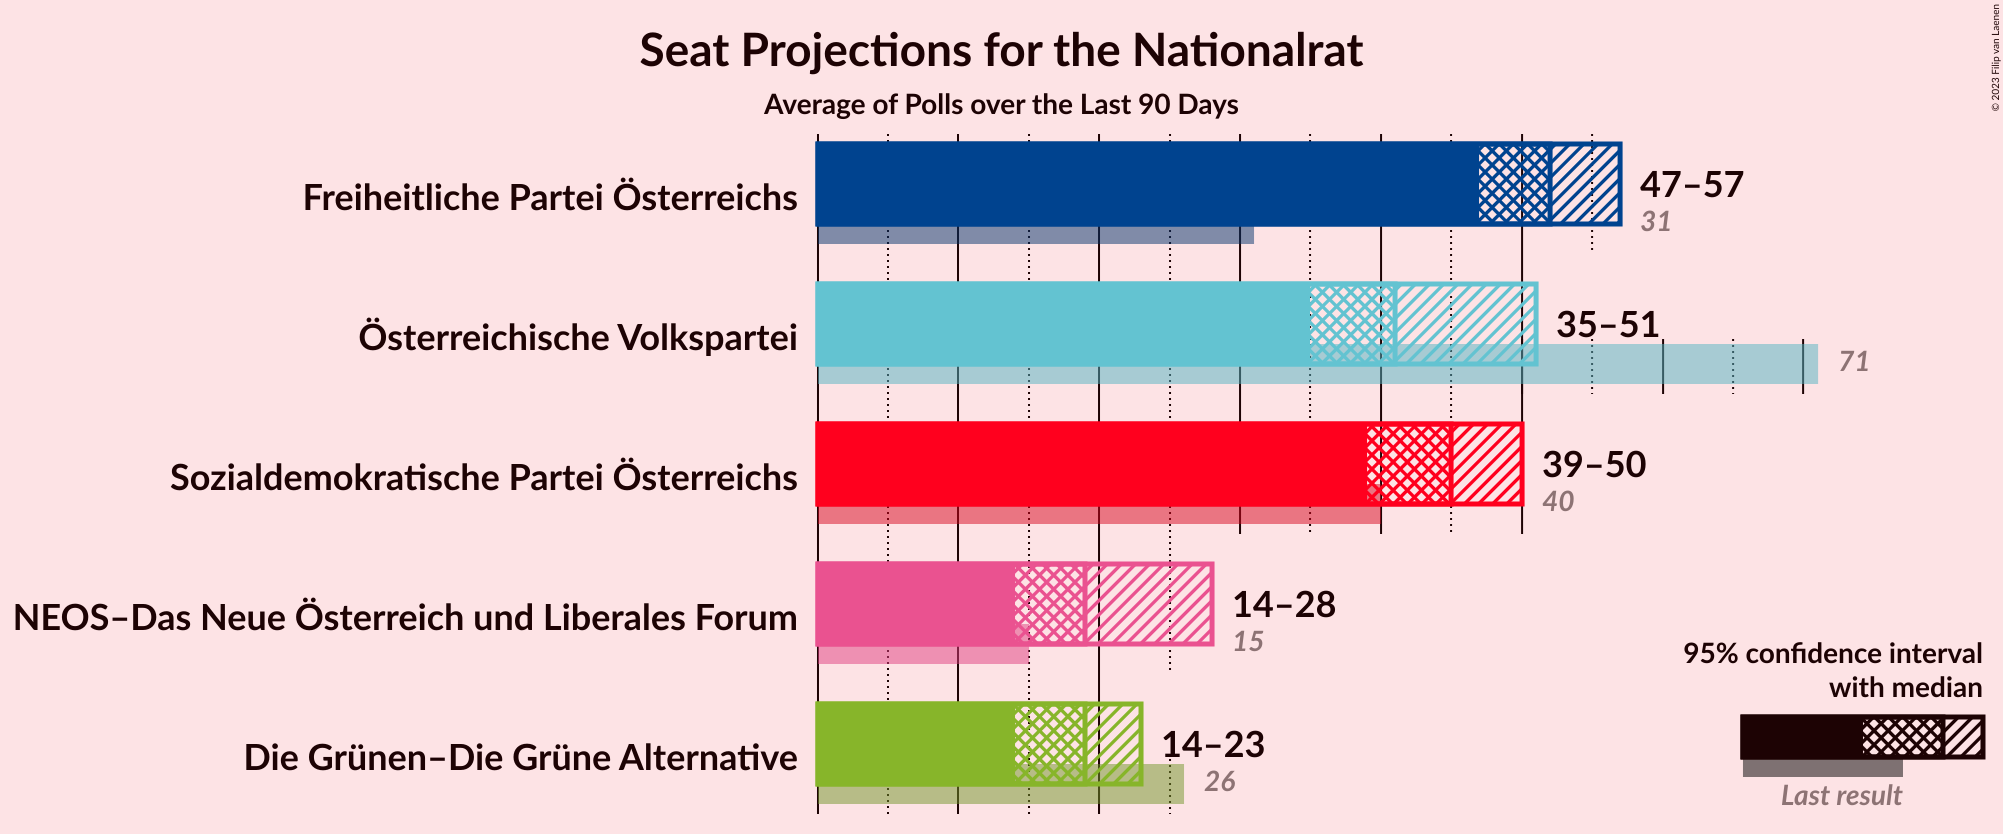
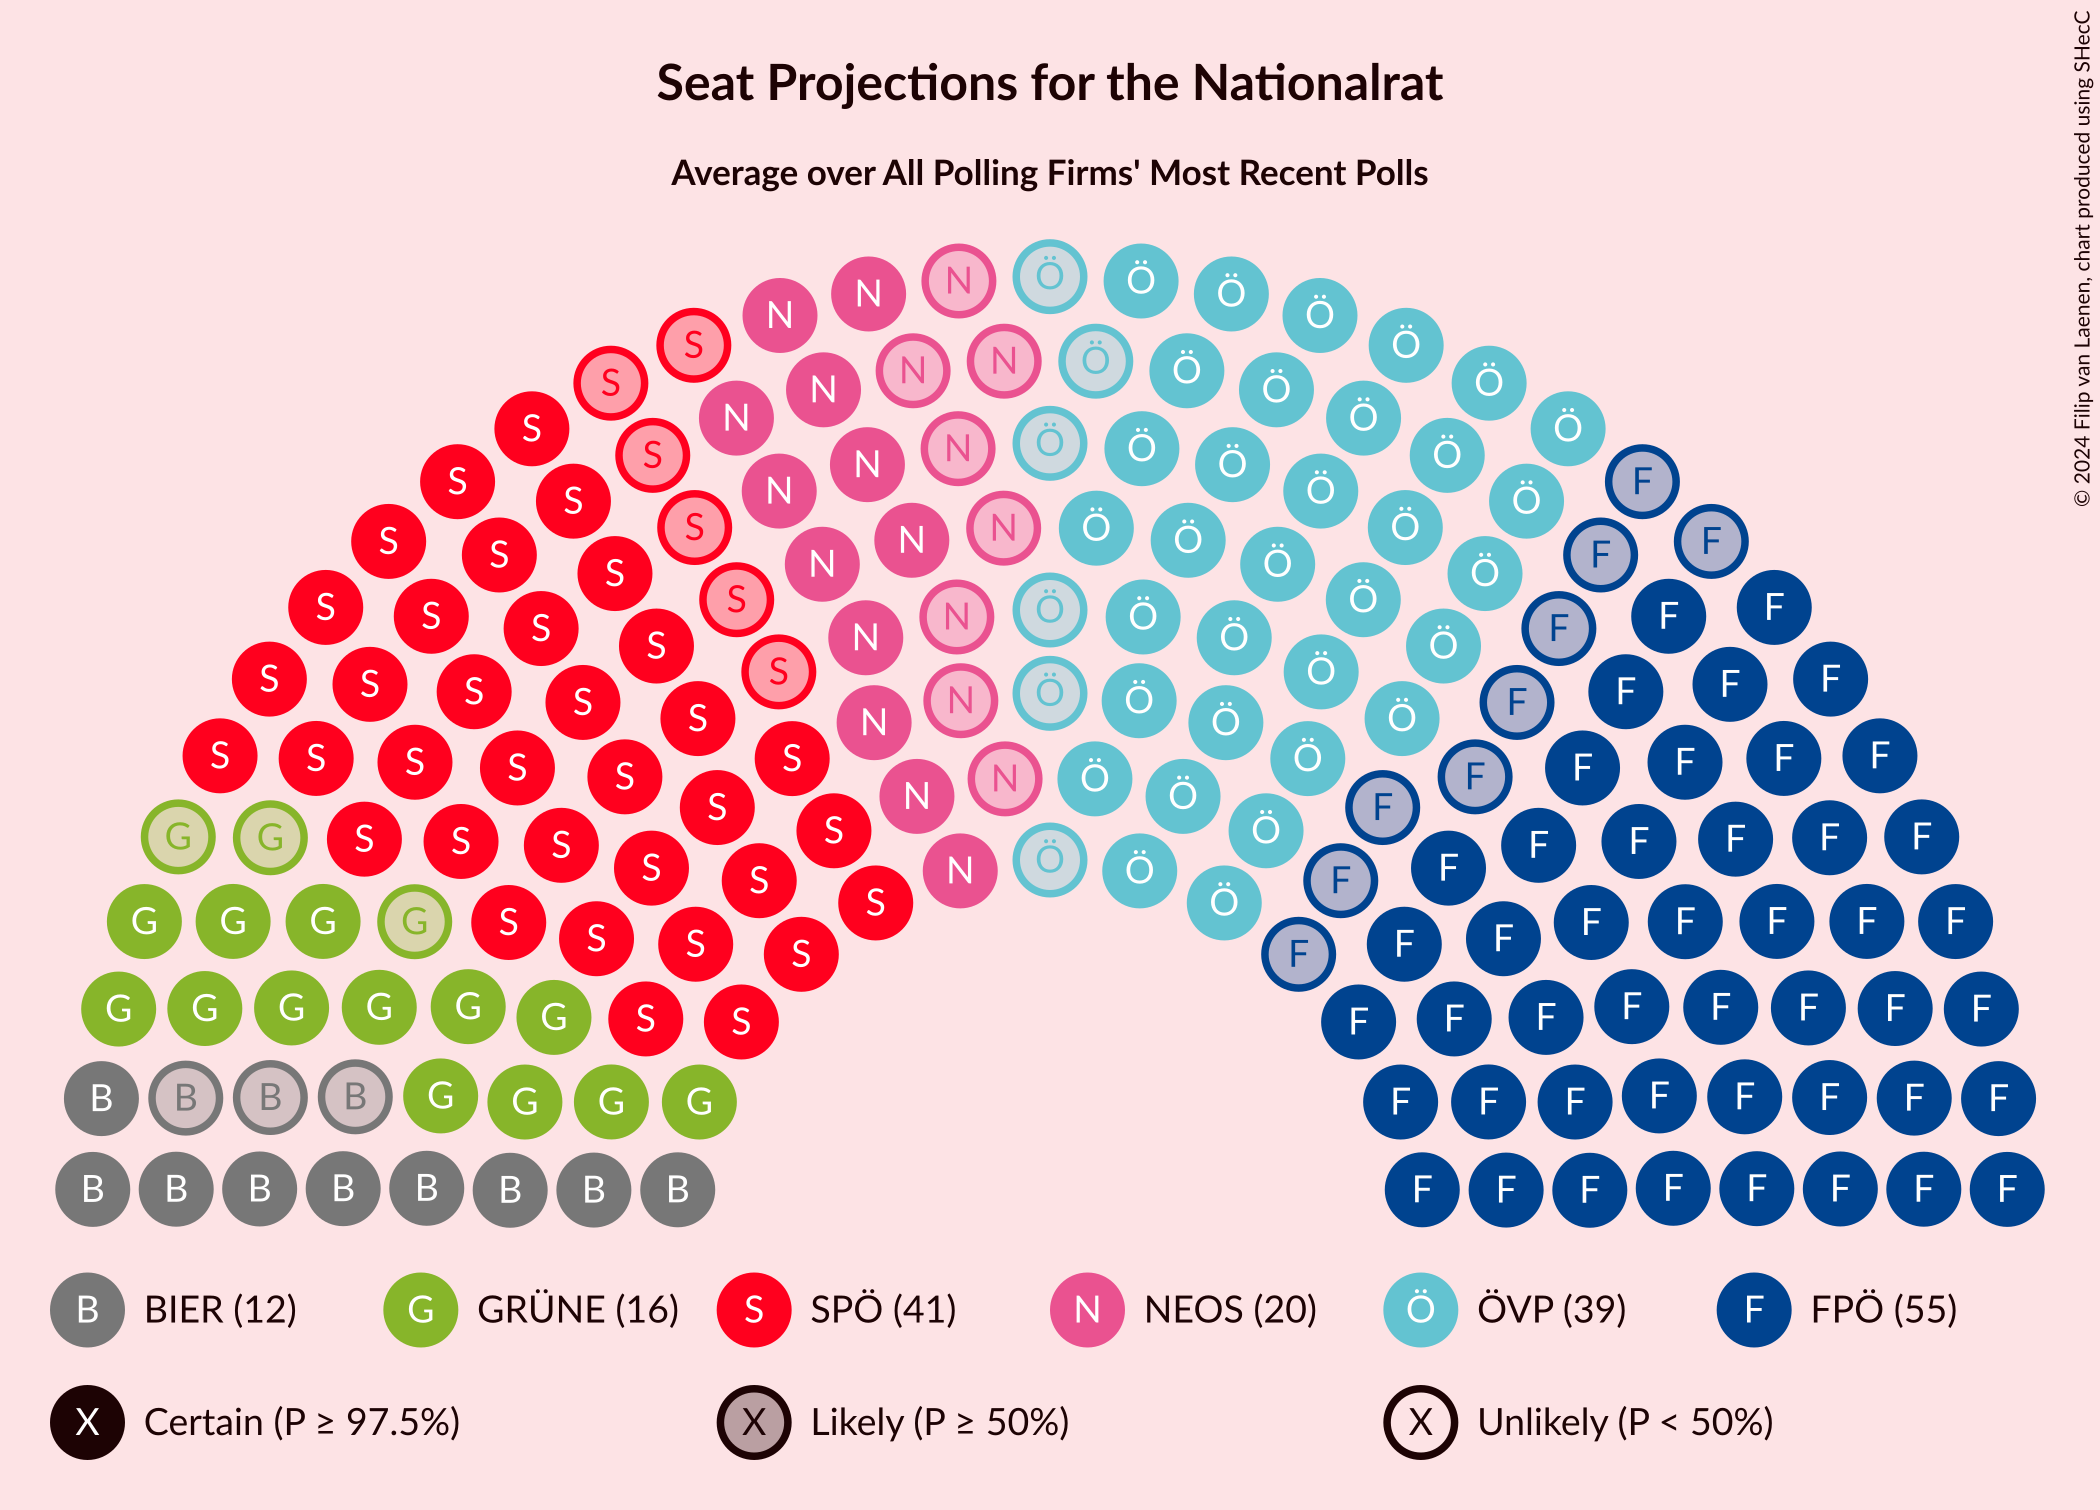
| Österreichische Volkspartei | 71 | 48 | 43–52 | 42–54 | 41–54 | 39–56 |
| Sozialdemokratische Partei Österreichs | 40 | 41 | 37–44 | 37–45 | 36–46 | 34–48 |
| Freiheitliche Partei Österreichs | 31 | 54 | 50–58 | 49–59 | 48–60 | 46–63 |
| Die Grünen–Die Grüne Alternative | 26 | 16 | 14–20 | 13–21 | 13–22 | 12–23 |
| NEOS–Das Neue Österreich und Liberales Forum | 15 | 18 | 15–21 | 14–22 | 13–23 | 12–24 |
| JETZT–Liste Pilz | 0 | N/A | N/A | N/A | N/A | N/A |
| Kommunistische Partei Österreichs | 0 | 0 | 0–8 | 0–8 | 0–9 | 0–9 |
| Meine Stimme G!LT | 0 | N/A | N/A | N/A | N/A | N/A |
| Team HC Strache–Allianz für Österreich | 0 | N/A | N/A | N/A | N/A | N/A |
| Bierpartei | 0 | 7 | 0–10 | 0–11 | 0–12 | 0–13 |
| Demokratisch – Neutral – Authentisch | 0 | N/A | N/A | N/A | N/A | N/A |
| Liste Madeleine Petrovic | 0 | 0 | 0 | 0 | 0 | 0 |
| Wandel | 0 | 0 | 0 | 0 | 0 | 0 |
Österreichische Volkspartei
For a full overview of the results for this party, see the Österreichische Volkspartei page.
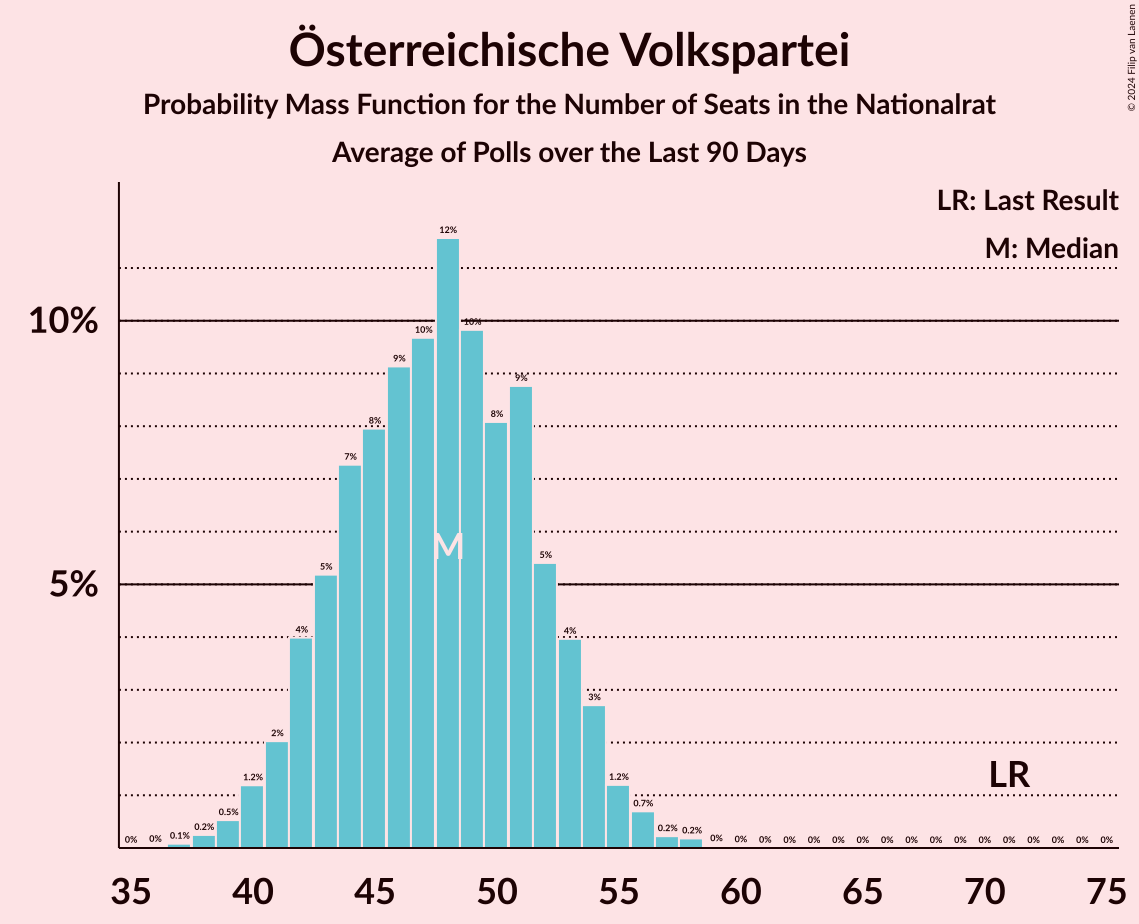
| Number of Seats | Probability | Accumulated | Special Marks |
|---|---|---|---|
| 37 | 0.1% | 100% | |
| 38 | 0.2% | 99.9% | |
| 39 | 0.5% | 99.6% | |
| 40 | 1.2% | 99.1% | |
| 41 | 2% | 98% | |
| 42 | 4% | 96% | |
| 43 | 5% | 92% | |
| 44 | 7% | 87% | |
| 45 | 8% | 79% | |
| 46 | 9% | 71% | |
| 47 | 10% | 62% | |
| 48 | 12% | 53% | Median |
| 49 | 10% | 41% | |
| 50 | 8% | 31% | |
| 51 | 9% | 23% | |
| 52 | 5% | 14% | |
| 53 | 4% | 9% | |
| 54 | 3% | 5% | |
| 55 | 1.2% | 2% | |
| 56 | 0.7% | 1.2% | |
| 57 | 0.2% | 0.5% | |
| 58 | 0.2% | 0.2% | |
| 59 | 0% | 0.1% | |
| 60 | 0% | 0% | |
| 61 | 0% | 0% | |
| 62 | 0% | 0% | |
| 63 | 0% | 0% | |
| 64 | 0% | 0% | |
| 65 | 0% | 0% | |
| 66 | 0% | 0% | |
| 67 | 0% | 0% | |
| 68 | 0% | 0% | |
| 69 | 0% | 0% | |
| 70 | 0% | 0% | |
| 71 | 0% | 0% | Last Result |
Sozialdemokratische Partei Österreichs
For a full overview of the results for this party, see the Sozialdemokratische Partei Österreichs page.
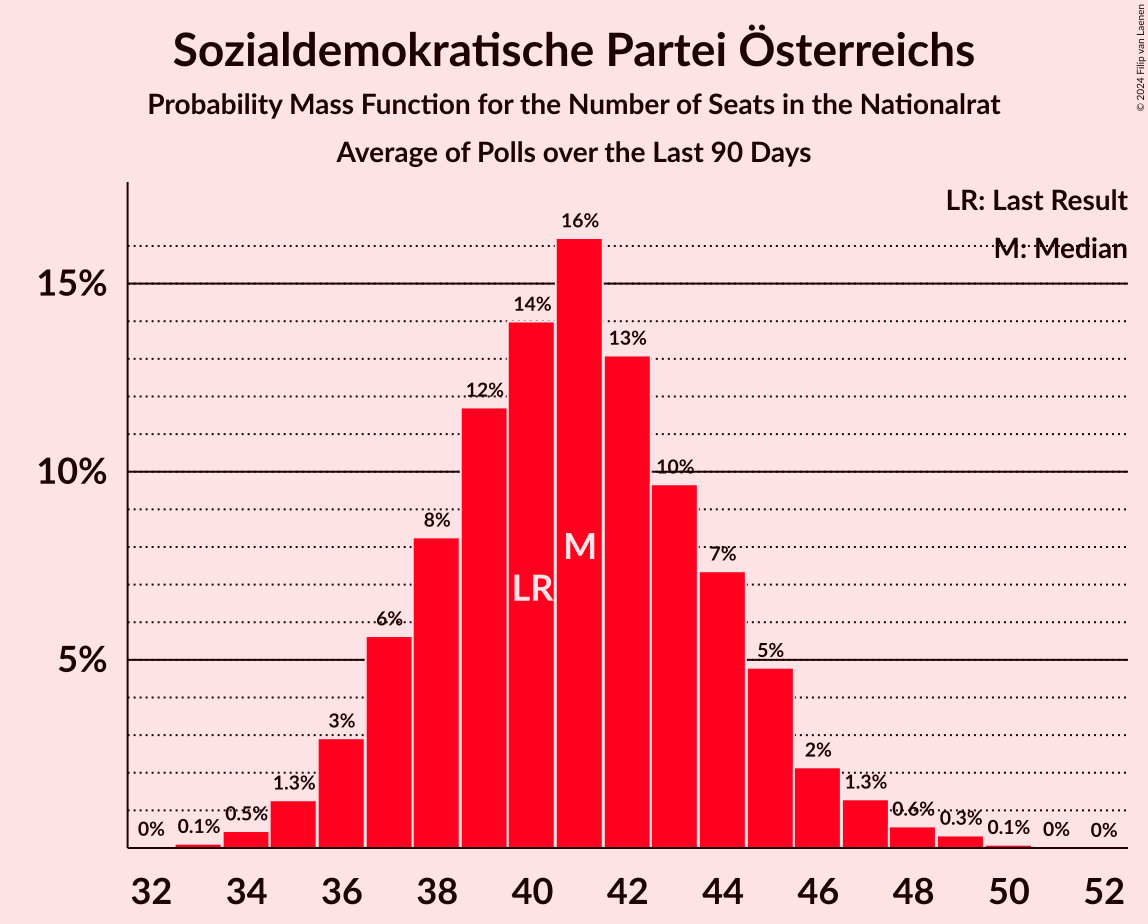
| Number of Seats | Probability | Accumulated | Special Marks |
|---|---|---|---|
| 32 | 0% | 100% | |
| 33 | 0.1% | 99.9% | |
| 34 | 0.5% | 99.8% | |
| 35 | 1.3% | 99.4% | |
| 36 | 3% | 98% | |
| 37 | 6% | 95% | |
| 38 | 8% | 90% | |
| 39 | 12% | 81% | |
| 40 | 14% | 70% | Last Result |
| 41 | 16% | 56% | Median |
| 42 | 13% | 39% | |
| 43 | 10% | 26% | |
| 44 | 7% | 17% | |
| 45 | 5% | 9% | |
| 46 | 2% | 4% | |
| 47 | 1.3% | 2% | |
| 48 | 0.6% | 1.0% | |
| 49 | 0.3% | 0.5% | |
| 50 | 0.1% | 0.1% | |
| 51 | 0% | 0.1% | |
| 52 | 0% | 0% |
Freiheitliche Partei Österreichs
For a full overview of the results for this party, see the Freiheitliche Partei Österreichs page.
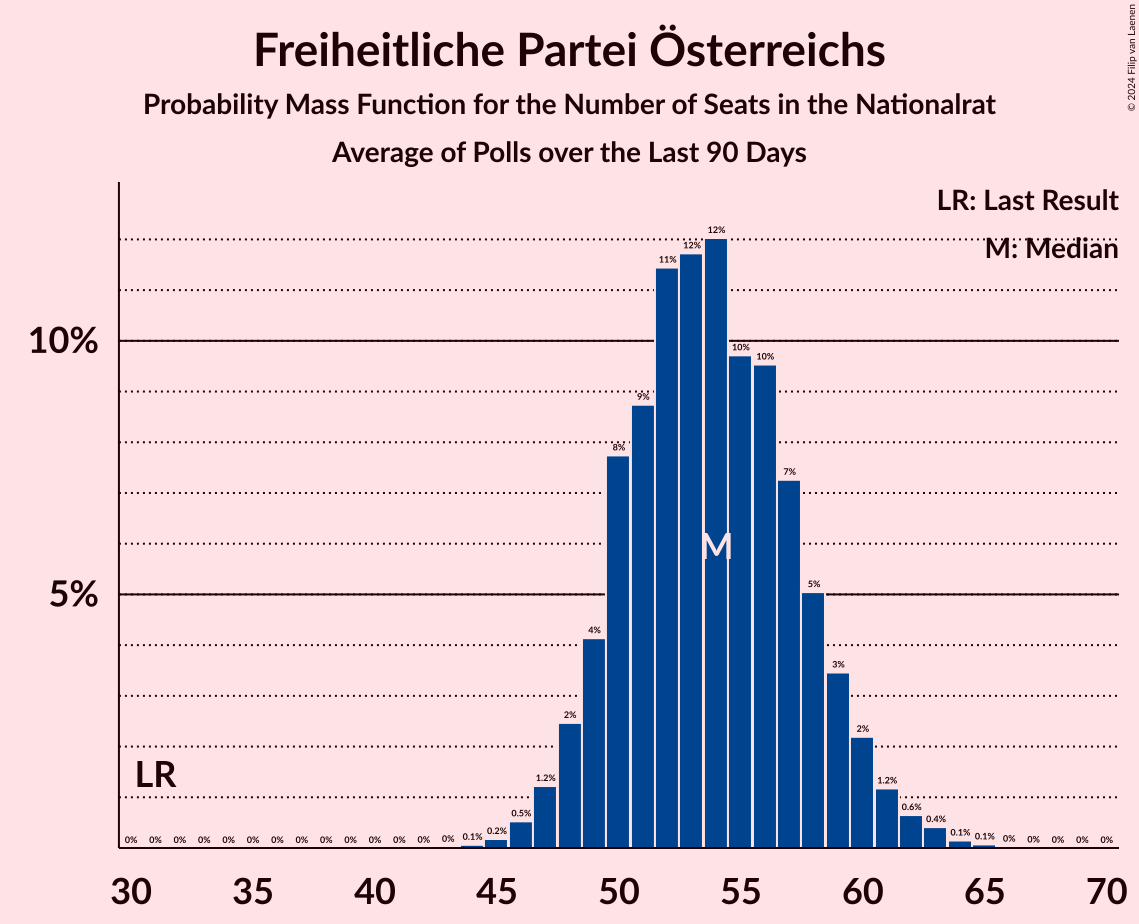
| Number of Seats | Probability | Accumulated | Special Marks |
|---|---|---|---|
| 31 | 0% | 100% | Last Result |
| 32 | 0% | 100% | |
| 33 | 0% | 100% | |
| 34 | 0% | 100% | |
| 35 | 0% | 100% | |
| 36 | 0% | 100% | |
| 37 | 0% | 100% | |
| 38 | 0% | 100% | |
| 39 | 0% | 100% | |
| 40 | 0% | 100% | |
| 41 | 0% | 100% | |
| 42 | 0% | 100% | |
| 43 | 0% | 100% | |
| 44 | 0.1% | 100% | |
| 45 | 0.2% | 99.9% | |
| 46 | 0.5% | 99.7% | |
| 47 | 1.2% | 99.2% | |
| 48 | 2% | 98% | |
| 49 | 4% | 96% | |
| 50 | 8% | 91% | |
| 51 | 9% | 84% | |
| 52 | 11% | 75% | |
| 53 | 12% | 63% | |
| 54 | 12% | 52% | Median |
| 55 | 10% | 40% | |
| 56 | 10% | 30% | |
| 57 | 7% | 20% | |
| 58 | 5% | 13% | |
| 59 | 3% | 8% | |
| 60 | 2% | 5% | |
| 61 | 1.2% | 2% | |
| 62 | 0.6% | 1.3% | |
| 63 | 0.4% | 0.7% | |
| 64 | 0.1% | 0.3% | |
| 65 | 0.1% | 0.1% | |
| 66 | 0% | 0% |
Die Grünen–Die Grüne Alternative
For a full overview of the results for this party, see the Die Grünen–Die Grüne Alternative page.
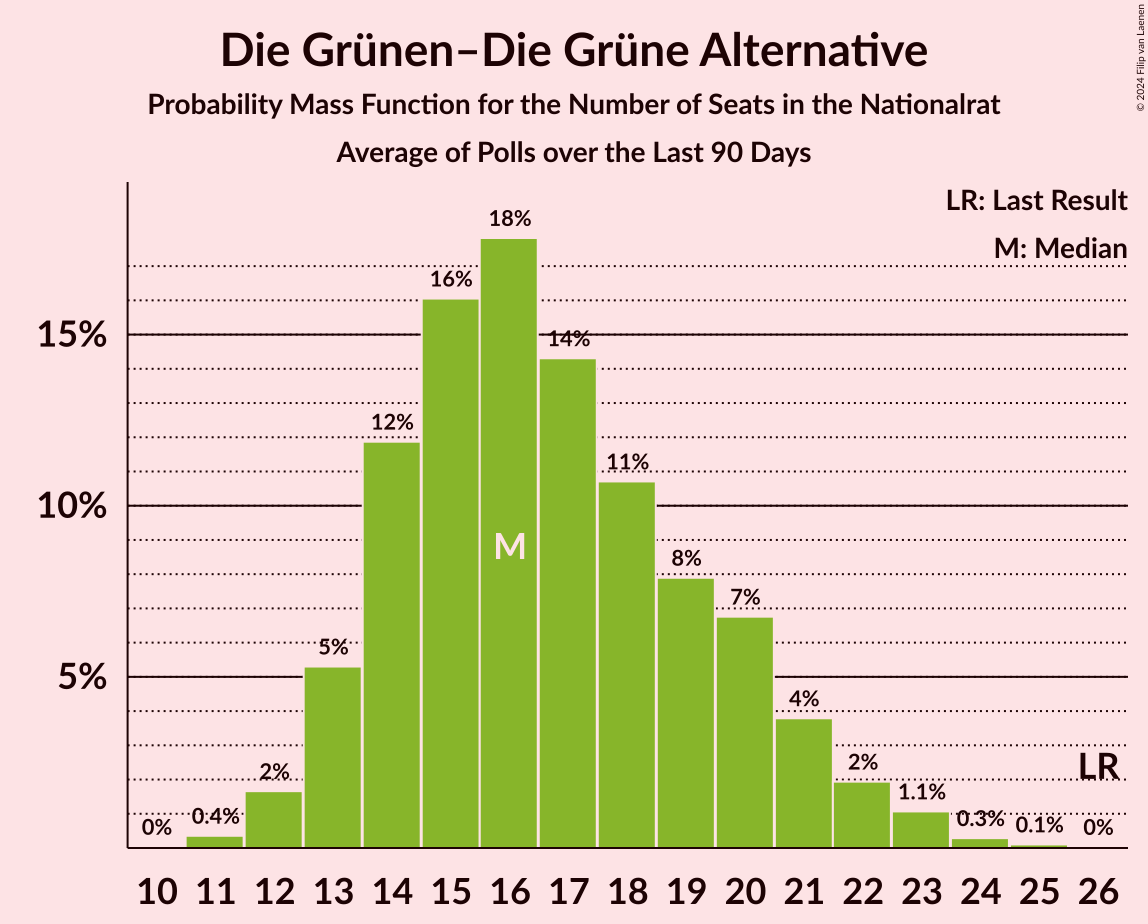
| Number of Seats | Probability | Accumulated | Special Marks |
|---|---|---|---|
| 11 | 0.4% | 100% | |
| 12 | 2% | 99.6% | |
| 13 | 5% | 98% | |
| 14 | 12% | 93% | |
| 15 | 16% | 81% | |
| 16 | 18% | 65% | Median |
| 17 | 14% | 47% | |
| 18 | 11% | 33% | |
| 19 | 8% | 22% | |
| 20 | 7% | 14% | |
| 21 | 4% | 7% | |
| 22 | 2% | 3% | |
| 23 | 1.1% | 1.5% | |
| 24 | 0.3% | 0.4% | |
| 25 | 0.1% | 0.1% | |
| 26 | 0% | 0% | Last Result |
NEOS–Das Neue Österreich und Liberales Forum
For a full overview of the results for this party, see the NEOS–Das Neue Österreich und Liberales Forum page.
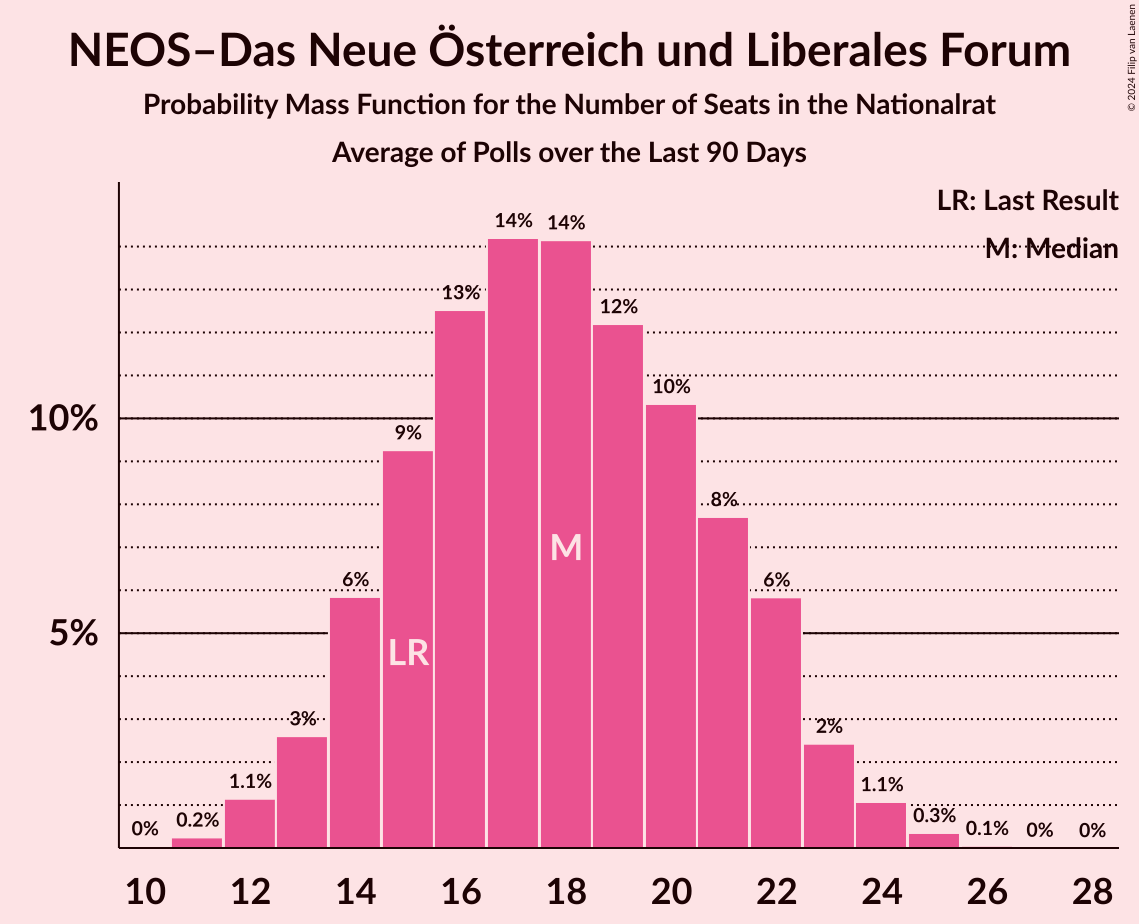
| Number of Seats | Probability | Accumulated | Special Marks |
|---|---|---|---|
| 11 | 0.2% | 100% | |
| 12 | 1.1% | 99.7% | |
| 13 | 3% | 98.6% | |
| 14 | 6% | 96% | |
| 15 | 9% | 90% | Last Result |
| 16 | 13% | 81% | |
| 17 | 14% | 68% | |
| 18 | 14% | 54% | Median |
| 19 | 12% | 40% | |
| 20 | 10% | 28% | |
| 21 | 8% | 17% | |
| 22 | 6% | 10% | |
| 23 | 2% | 4% | |
| 24 | 1.1% | 1.5% | |
| 25 | 0.3% | 0.4% | |
| 26 | 0.1% | 0.1% | |
| 27 | 0% | 0% |
JETZT–Liste Pilz
For a full overview of the results for this party, see the JETZT–Liste Pilz page.

Kommunistische Partei Österreichs
For a full overview of the results for this party, see the Kommunistische Partei Österreichs page.
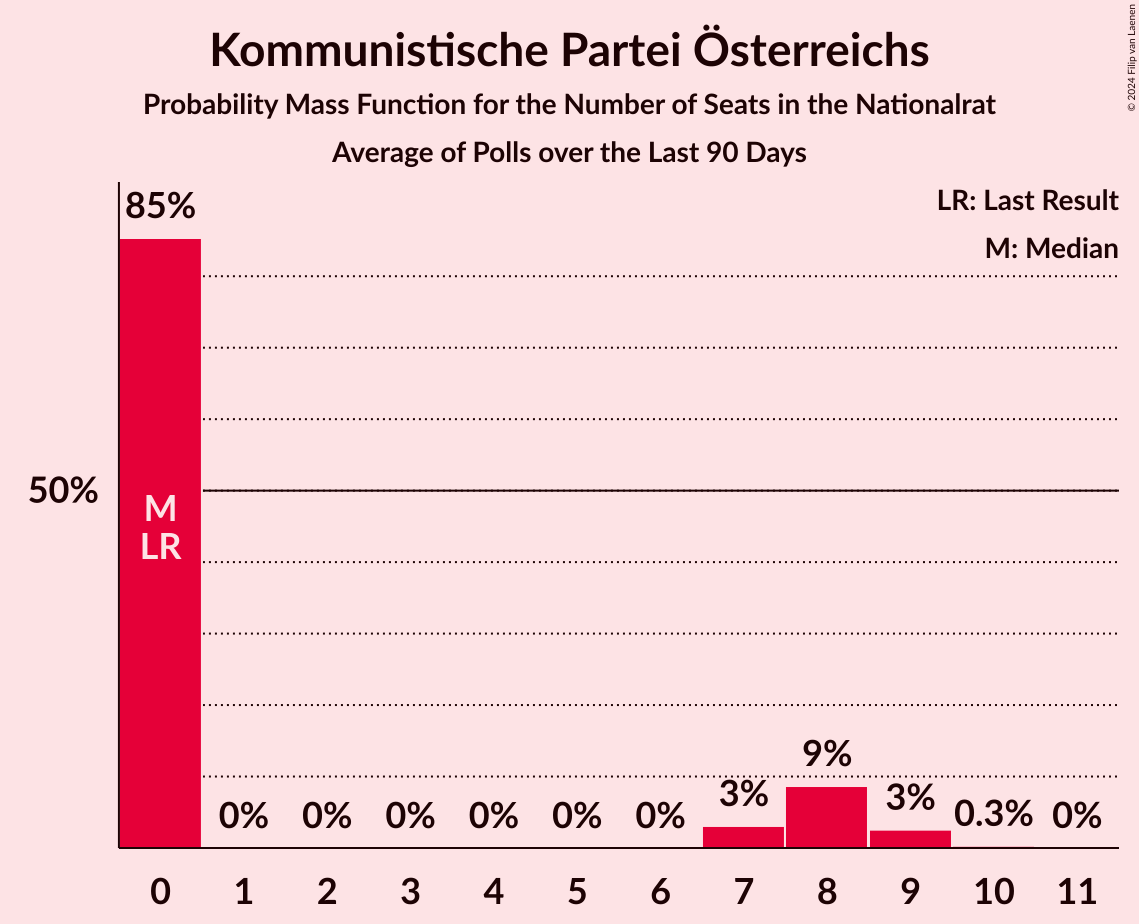
| Number of Seats | Probability | Accumulated | Special Marks |
|---|---|---|---|
| 0 | 85% | 100% | Last Result, Median |
| 1 | 0% | 15% | |
| 2 | 0% | 15% | |
| 3 | 0% | 15% | |
| 4 | 0% | 15% | |
| 5 | 0% | 15% | |
| 6 | 0% | 15% | |
| 7 | 3% | 15% | |
| 8 | 9% | 12% | |
| 9 | 3% | 3% | |
| 10 | 0.3% | 0.3% | |
| 11 | 0% | 0% |
Meine Stimme G!LT
For a full overview of the results for this party, see the Meine Stimme G!LT page.

Team HC Strache–Allianz für Österreich
For a full overview of the results for this party, see the Team HC Strache–Allianz für Österreich page.
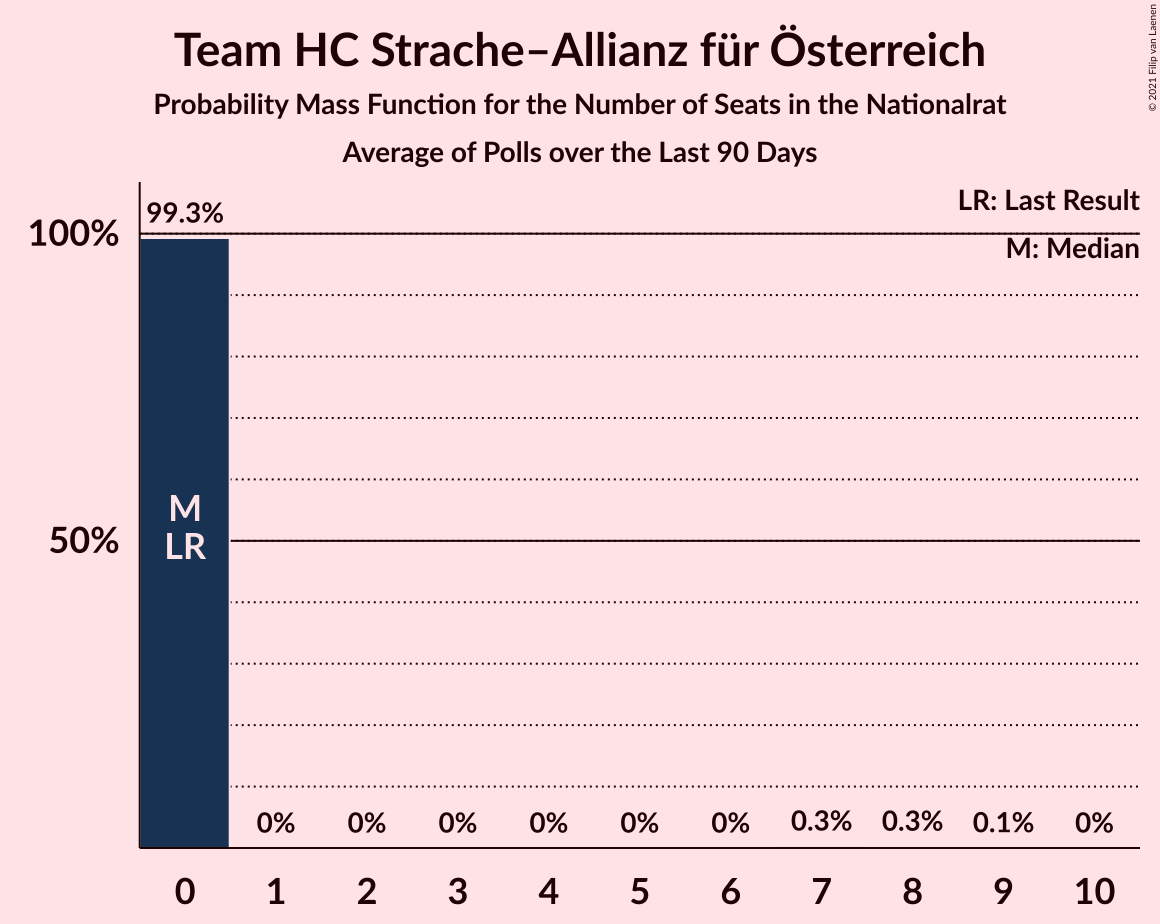
Bierpartei
For a full overview of the results for this party, see the Bierpartei page.
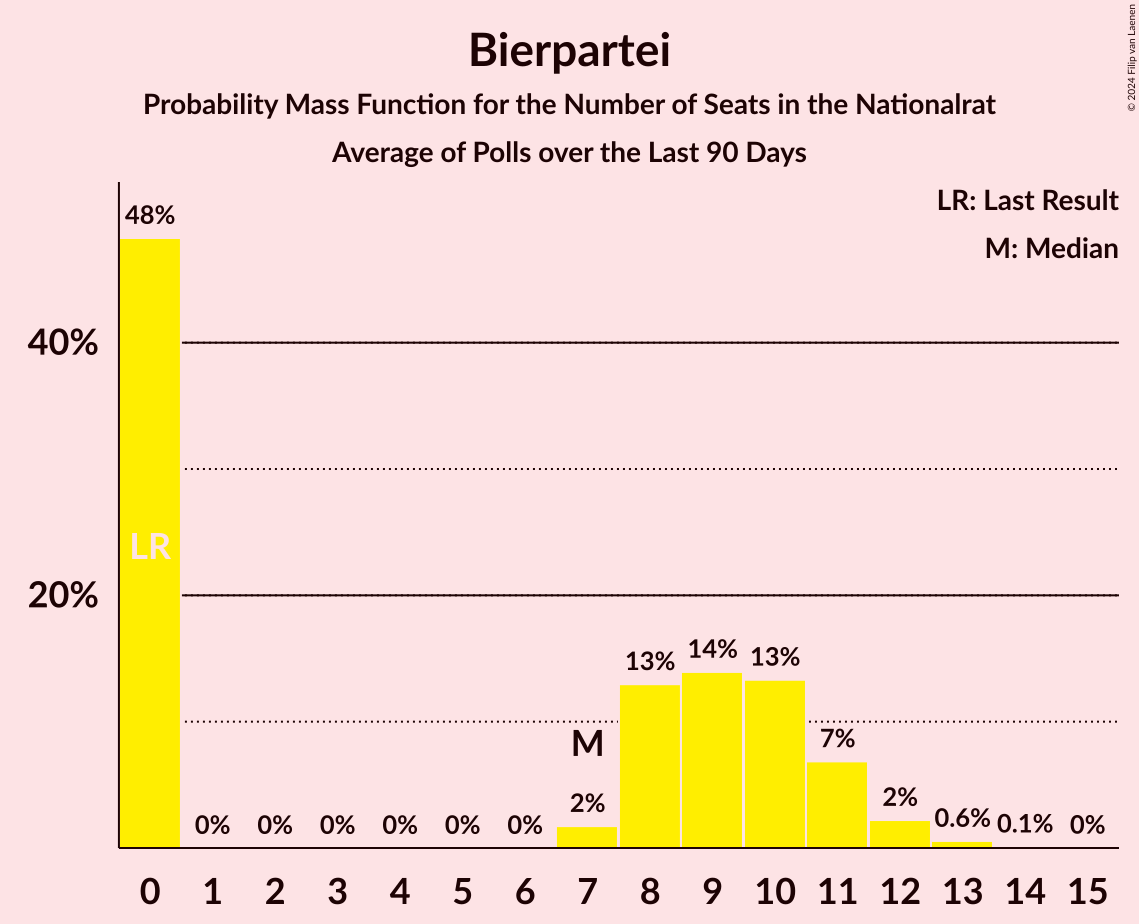
| Number of Seats | Probability | Accumulated | Special Marks |
|---|---|---|---|
| 0 | 48% | 100% | Last Result |
| 1 | 0% | 52% | |
| 2 | 0% | 52% | |
| 3 | 0% | 52% | |
| 4 | 0% | 52% | |
| 5 | 0% | 52% | |
| 6 | 0% | 52% | |
| 7 | 2% | 52% | Median |
| 8 | 13% | 50% | |
| 9 | 14% | 37% | |
| 10 | 13% | 23% | |
| 11 | 7% | 10% | |
| 12 | 2% | 3% | |
| 13 | 0.6% | 0.7% | |
| 14 | 0.1% | 0.1% | |
| 15 | 0% | 0% |
Demokratisch – Neutral – Authentisch
For a full overview of the results for this party, see the Demokratisch – Neutral – Authentisch page.

Liste Madeleine Petrovic
For a full overview of the results for this party, see the Liste Madeleine Petrovic page.
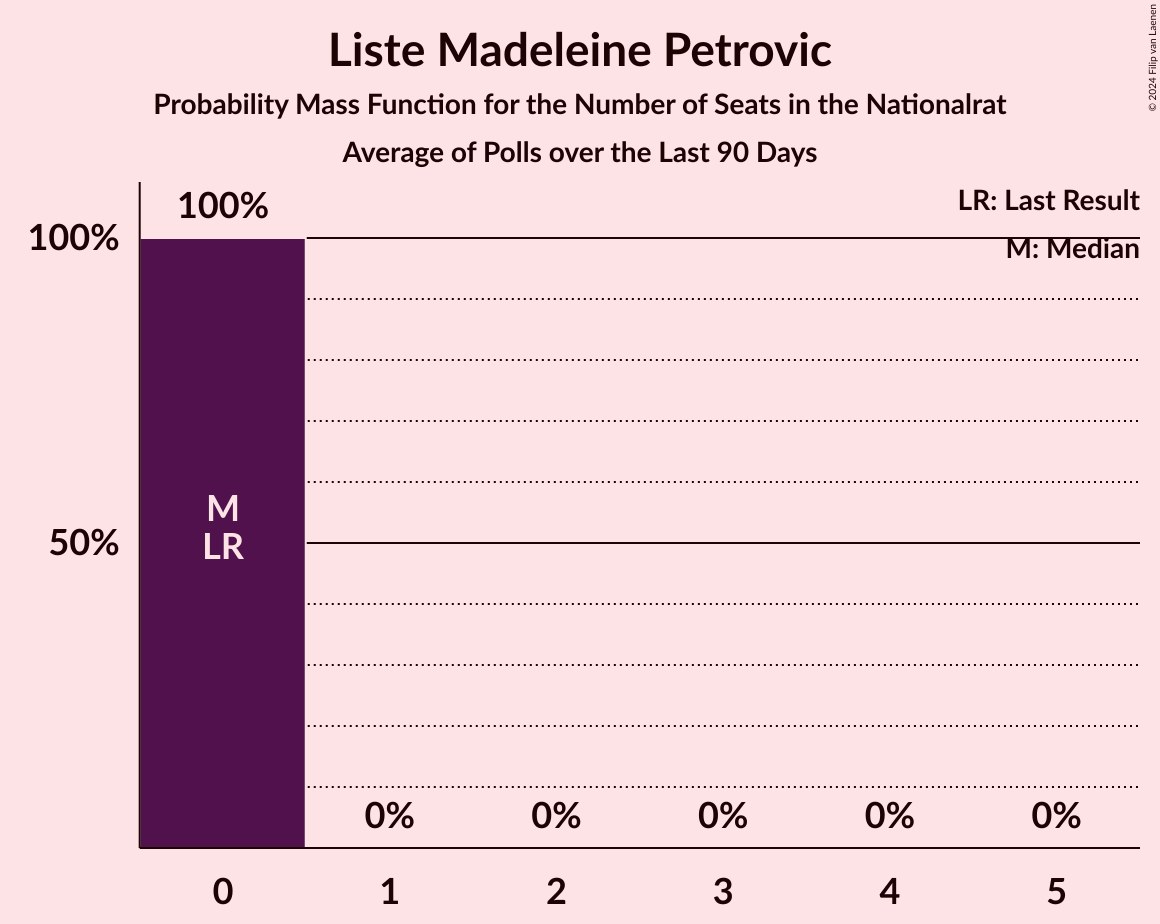
| Number of Seats | Probability | Accumulated | Special Marks |
|---|---|---|---|
| 0 | 100% | 100% | Last Result, Median |
Wandel
For a full overview of the results for this party, see the Wandel page.
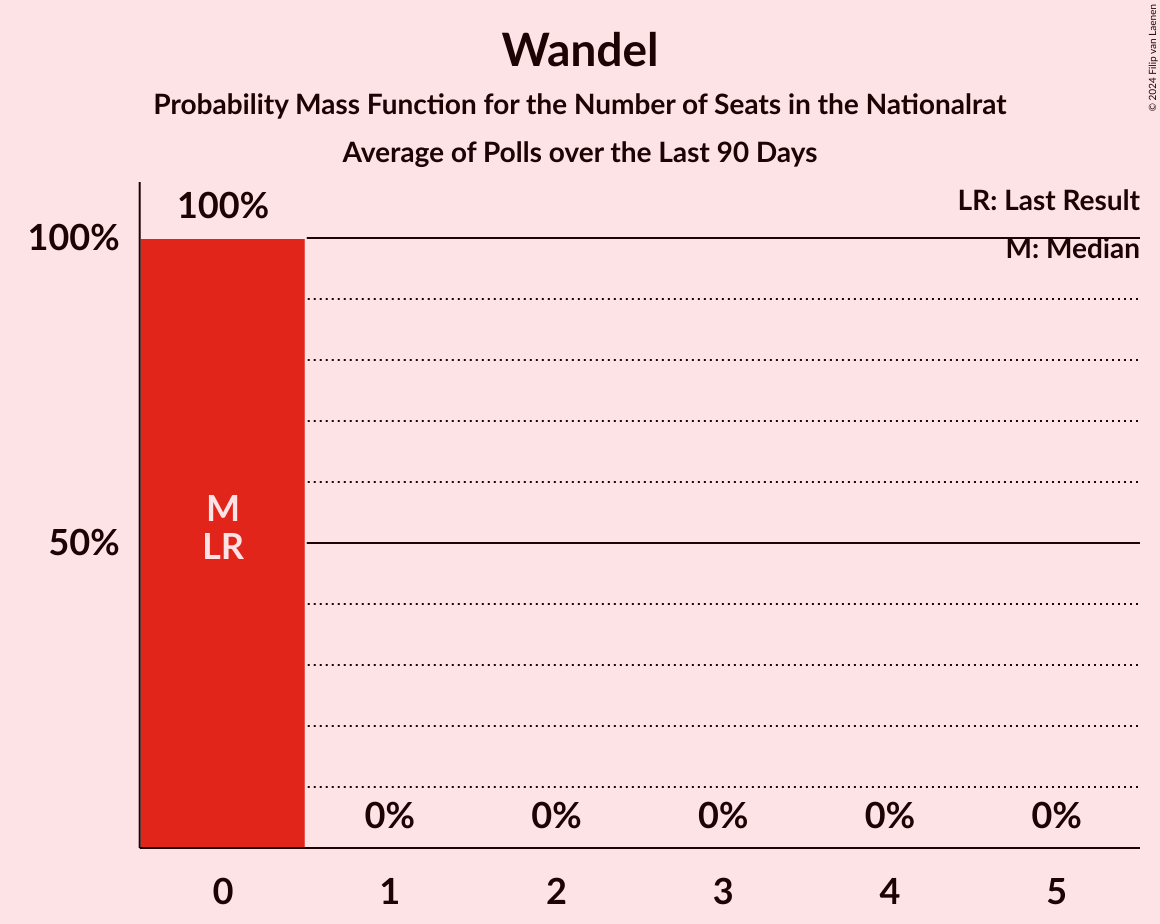
| Number of Seats | Probability | Accumulated | Special Marks |
|---|---|---|---|
| 0 | 100% | 100% | Last Result, Median |
Coalitions
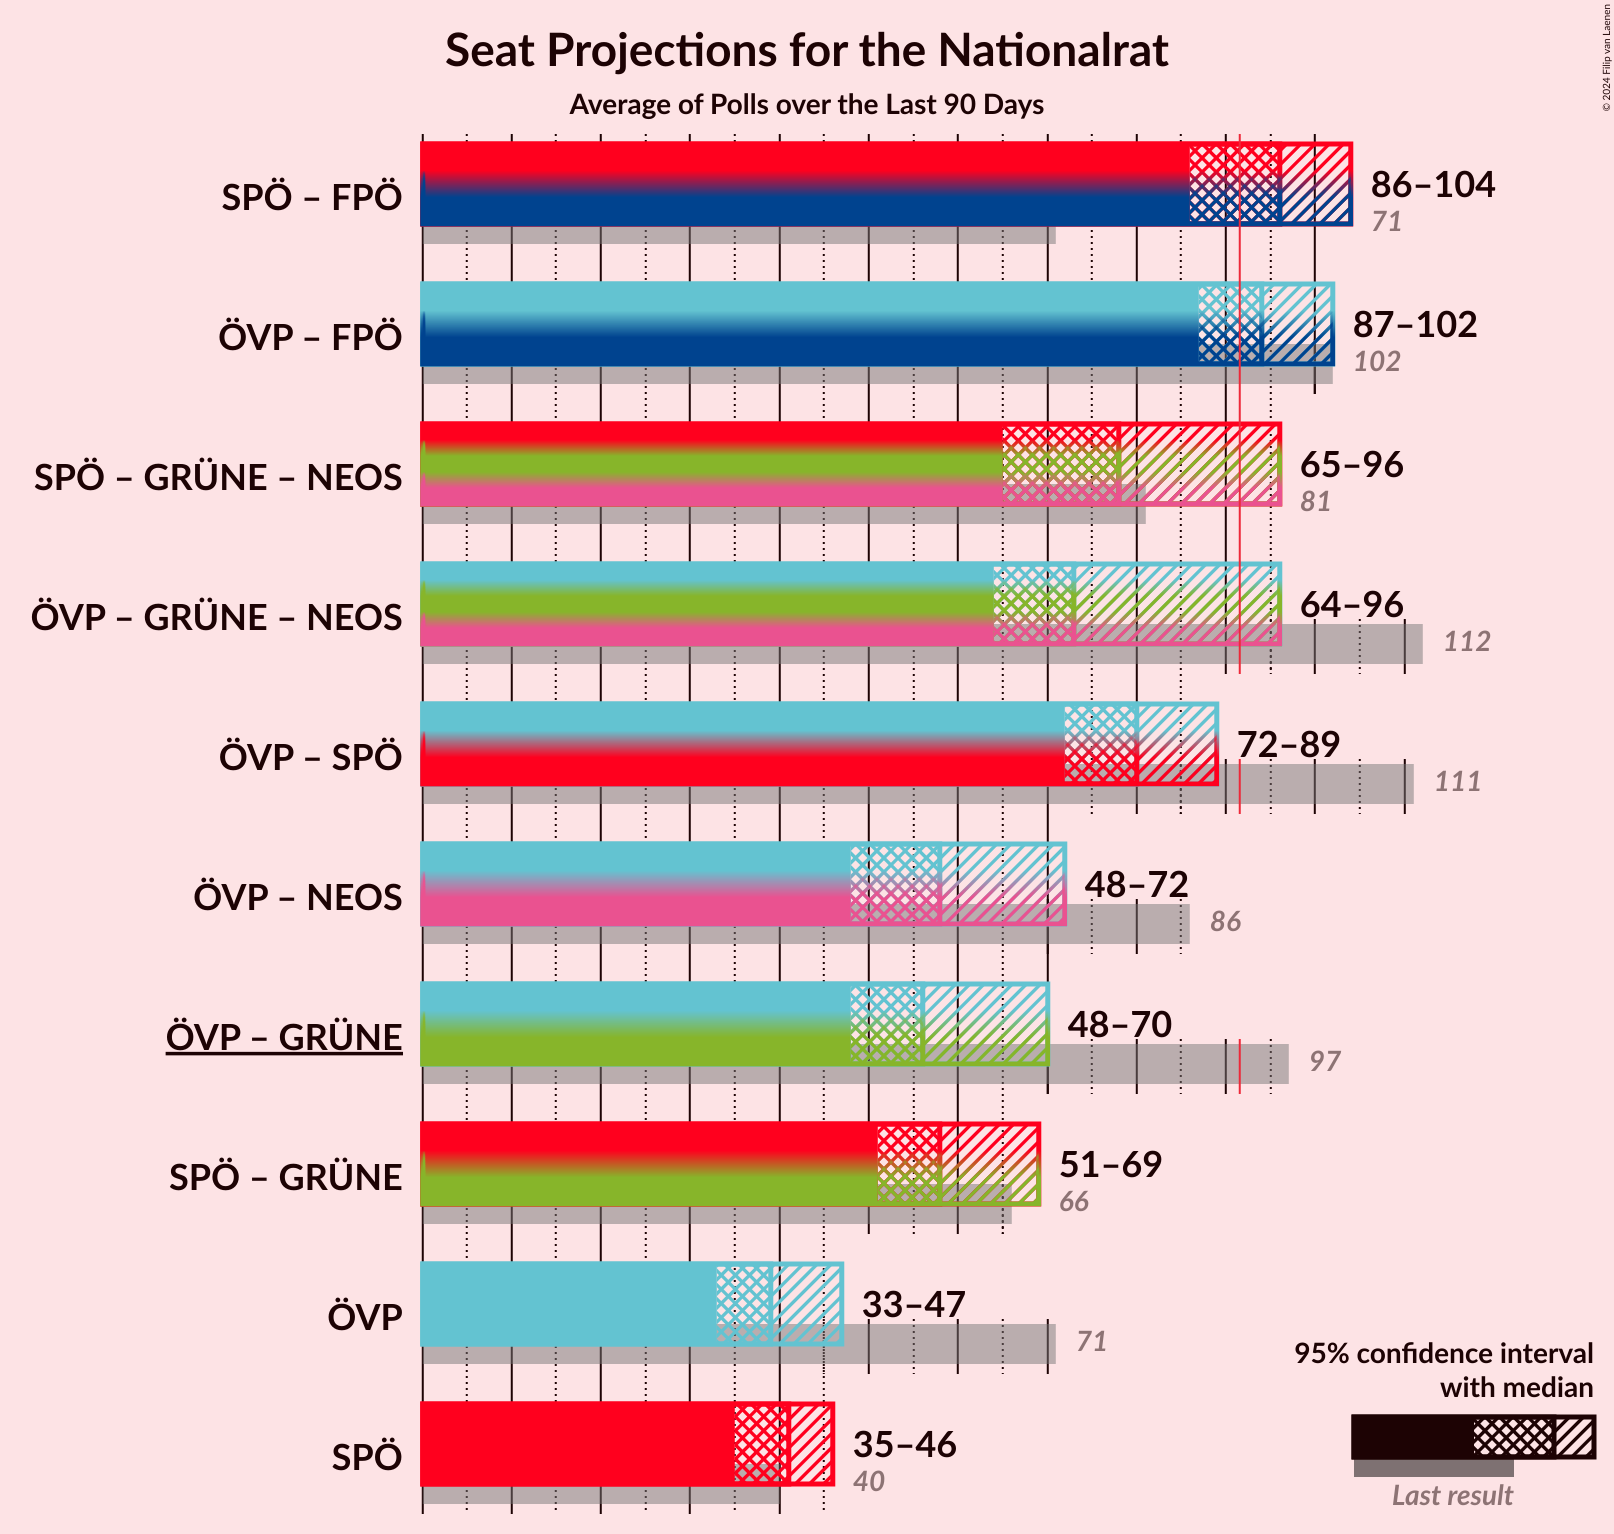
Confidence Intervals
| Coalition | Last Result | Median | Majority? | 80% Confidence Interval | 90% Confidence Interval | 95% Confidence Interval | 99% Confidence Interval |
|---|---|---|---|---|---|---|---|
| Österreichische Volkspartei – Freiheitliche Partei Österreichs | 102 | 101 | 99.4% | 96–107 | 95–108 | 94–109 | 91–112 |
| Sozialdemokratische Partei Österreichs – Freiheitliche Partei Österreichs | 71 | 95 | 79% | 90–100 | 88–101 | 87–102 | 85–105 |
| Österreichische Volkspartei – Sozialdemokratische Partei Österreichs | 111 | 88 | 26% | 83–94 | 82–96 | 80–97 | 78–99 |
| Österreichische Volkspartei – Die Grünen–Die Grüne Alternative – NEOS–Das Neue Österreich und Liberales Forum | 112 | 82 | 3% | 75–89 | 73–90 | 72–92 | 69–94 |
| Sozialdemokratische Partei Österreichs – Die Grünen–Die Grüne Alternative – NEOS–Das Neue Österreich und Liberales Forum | 81 | 76 | 0% | 70–81 | 69–82 | 67–83 | 65–86 |
| Österreichische Volkspartei – NEOS–Das Neue Österreich und Liberales Forum | 86 | 66 | 0% | 60–71 | 58–73 | 57–74 | 55–76 |
| Österreichische Volkspartei – Die Grünen–Die Grüne Alternative | 97 | 64 | 0% | 58–71 | 57–73 | 55–74 | 53–76 |
| Sozialdemokratische Partei Österreichs – Die Grünen–Die Grüne Alternative | 66 | 57 | 0% | 53–63 | 52–64 | 51–65 | 49–68 |
| Österreichische Volkspartei | 71 | 48 | 0% | 43–52 | 42–54 | 41–54 | 39–56 |
| Sozialdemokratische Partei Österreichs | 40 | 41 | 0% | 37–44 | 37–45 | 36–46 | 34–48 |
Österreichische Volkspartei – Freiheitliche Partei Österreichs
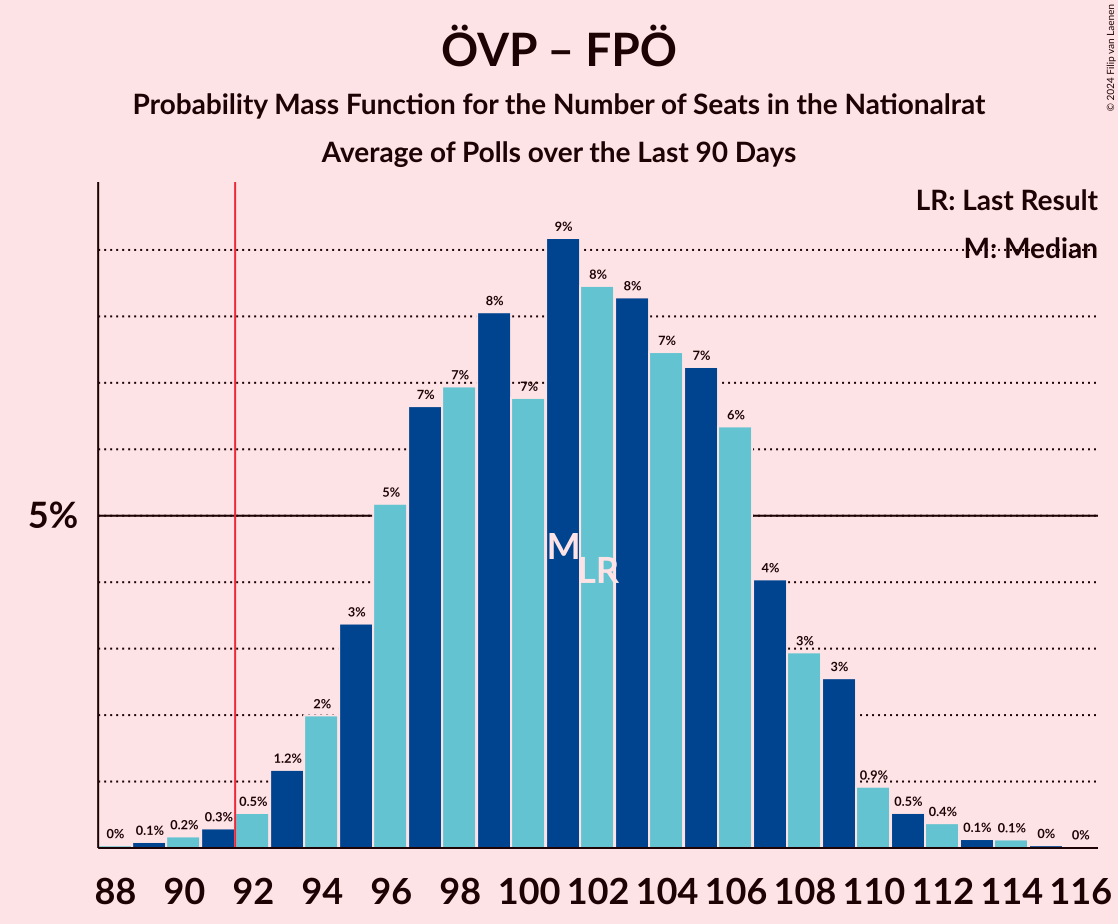
| Number of Seats | Probability | Accumulated | Special Marks |
|---|---|---|---|
| 88 | 0% | 100% | |
| 89 | 0.1% | 99.9% | |
| 90 | 0.2% | 99.8% | |
| 91 | 0.3% | 99.7% | |
| 92 | 0.5% | 99.4% | Majority |
| 93 | 1.2% | 98.8% | |
| 94 | 2% | 98% | |
| 95 | 3% | 96% | |
| 96 | 5% | 92% | |
| 97 | 7% | 87% | |
| 98 | 7% | 80% | |
| 99 | 8% | 74% | |
| 100 | 7% | 65% | |
| 101 | 9% | 59% | |
| 102 | 8% | 50% | Last Result, Median |
| 103 | 8% | 41% | |
| 104 | 7% | 33% | |
| 105 | 7% | 25% | |
| 106 | 6% | 18% | |
| 107 | 4% | 12% | |
| 108 | 3% | 8% | |
| 109 | 3% | 5% | |
| 110 | 0.9% | 2% | |
| 111 | 0.5% | 1.2% | |
| 112 | 0.4% | 0.7% | |
| 113 | 0.1% | 0.3% | |
| 114 | 0.1% | 0.2% | |
| 115 | 0% | 0.1% | |
| 116 | 0% | 0% |
Sozialdemokratische Partei Österreichs – Freiheitliche Partei Österreichs
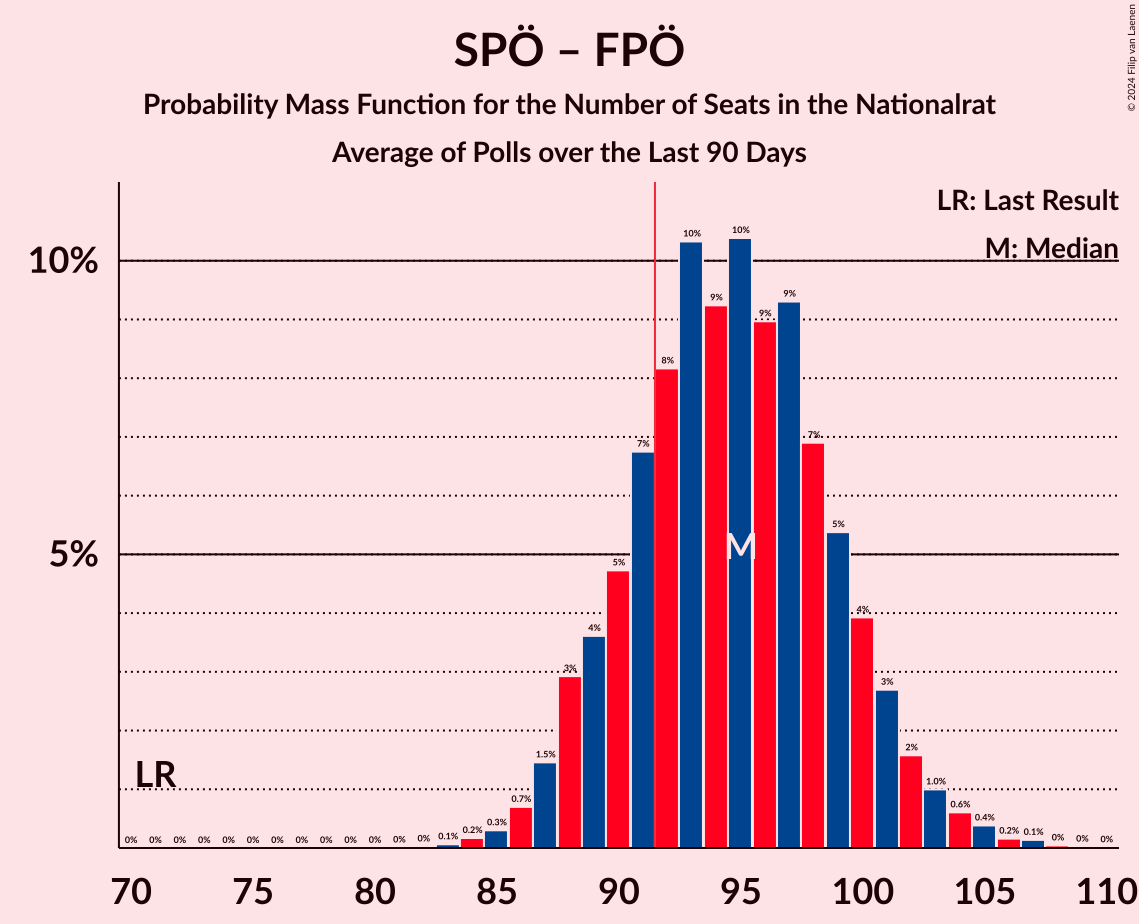
| Number of Seats | Probability | Accumulated | Special Marks |
|---|---|---|---|
| 71 | 0% | 100% | Last Result |
| 72 | 0% | 100% | |
| 73 | 0% | 100% | |
| 74 | 0% | 100% | |
| 75 | 0% | 100% | |
| 76 | 0% | 100% | |
| 77 | 0% | 100% | |
| 78 | 0% | 100% | |
| 79 | 0% | 100% | |
| 80 | 0% | 100% | |
| 81 | 0% | 100% | |
| 82 | 0% | 100% | |
| 83 | 0.1% | 100% | |
| 84 | 0.2% | 99.9% | |
| 85 | 0.3% | 99.7% | |
| 86 | 0.7% | 99.4% | |
| 87 | 1.5% | 98.7% | |
| 88 | 3% | 97% | |
| 89 | 4% | 94% | |
| 90 | 5% | 91% | |
| 91 | 7% | 86% | |
| 92 | 8% | 79% | Majority |
| 93 | 10% | 71% | |
| 94 | 9% | 61% | |
| 95 | 10% | 52% | Median |
| 96 | 9% | 41% | |
| 97 | 9% | 32% | |
| 98 | 7% | 23% | |
| 99 | 5% | 16% | |
| 100 | 4% | 11% | |
| 101 | 3% | 7% | |
| 102 | 2% | 4% | |
| 103 | 1.0% | 2% | |
| 104 | 0.6% | 1.4% | |
| 105 | 0.4% | 0.8% | |
| 106 | 0.2% | 0.4% | |
| 107 | 0.1% | 0.2% | |
| 108 | 0% | 0.1% | |
| 109 | 0% | 0% |
Österreichische Volkspartei – Sozialdemokratische Partei Österreichs
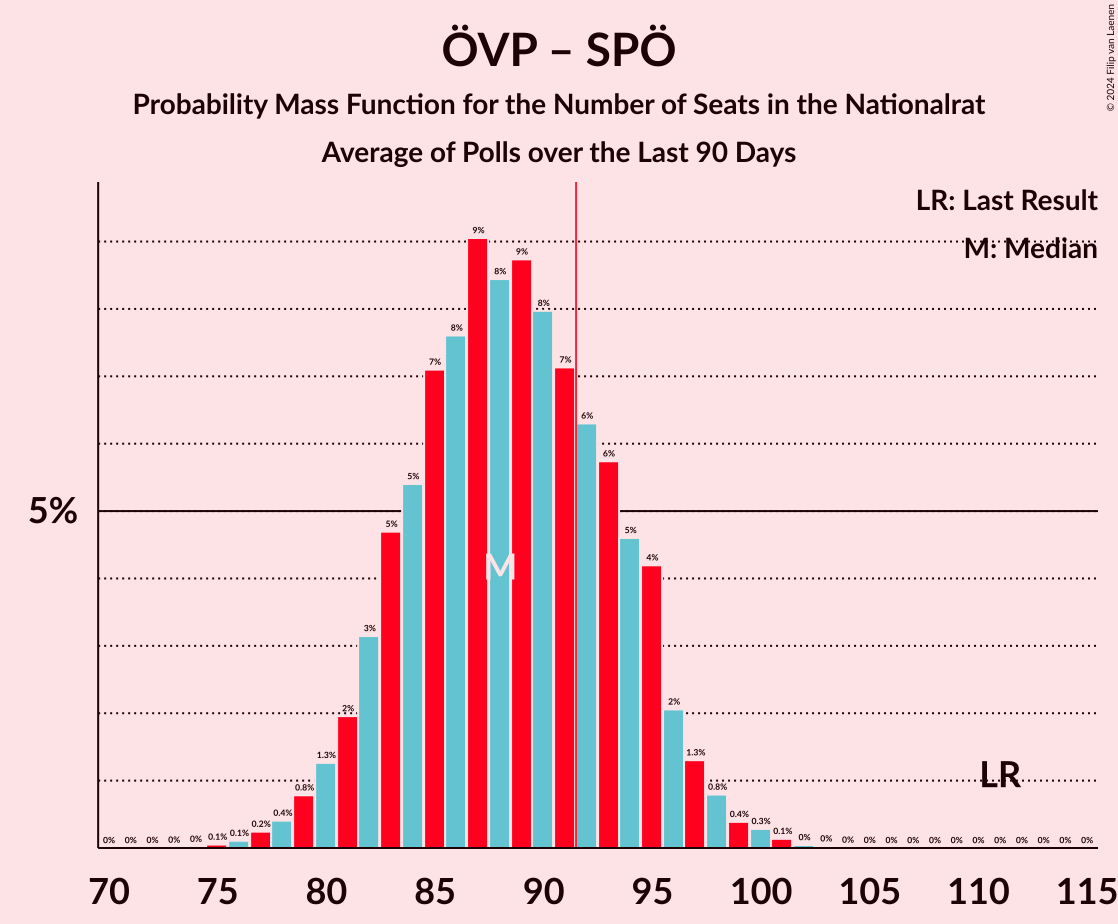
| Number of Seats | Probability | Accumulated | Special Marks |
|---|---|---|---|
| 75 | 0.1% | 100% | |
| 76 | 0.1% | 99.9% | |
| 77 | 0.2% | 99.8% | |
| 78 | 0.4% | 99.6% | |
| 79 | 0.8% | 99.2% | |
| 80 | 1.3% | 98% | |
| 81 | 2% | 97% | |
| 82 | 3% | 95% | |
| 83 | 5% | 92% | |
| 84 | 5% | 87% | |
| 85 | 7% | 82% | |
| 86 | 8% | 75% | |
| 87 | 9% | 67% | |
| 88 | 8% | 58% | |
| 89 | 9% | 50% | Median |
| 90 | 8% | 41% | |
| 91 | 7% | 33% | |
| 92 | 6% | 26% | Majority |
| 93 | 6% | 20% | |
| 94 | 5% | 14% | |
| 95 | 4% | 9% | |
| 96 | 2% | 5% | |
| 97 | 1.3% | 3% | |
| 98 | 0.8% | 2% | |
| 99 | 0.4% | 0.9% | |
| 100 | 0.3% | 0.5% | |
| 101 | 0.1% | 0.2% | |
| 102 | 0% | 0.1% | |
| 103 | 0% | 0% | |
| 104 | 0% | 0% | |
| 105 | 0% | 0% | |
| 106 | 0% | 0% | |
| 107 | 0% | 0% | |
| 108 | 0% | 0% | |
| 109 | 0% | 0% | |
| 110 | 0% | 0% | |
| 111 | 0% | 0% | Last Result |
Österreichische Volkspartei – Die Grünen–Die Grüne Alternative – NEOS–Das Neue Österreich und Liberales Forum
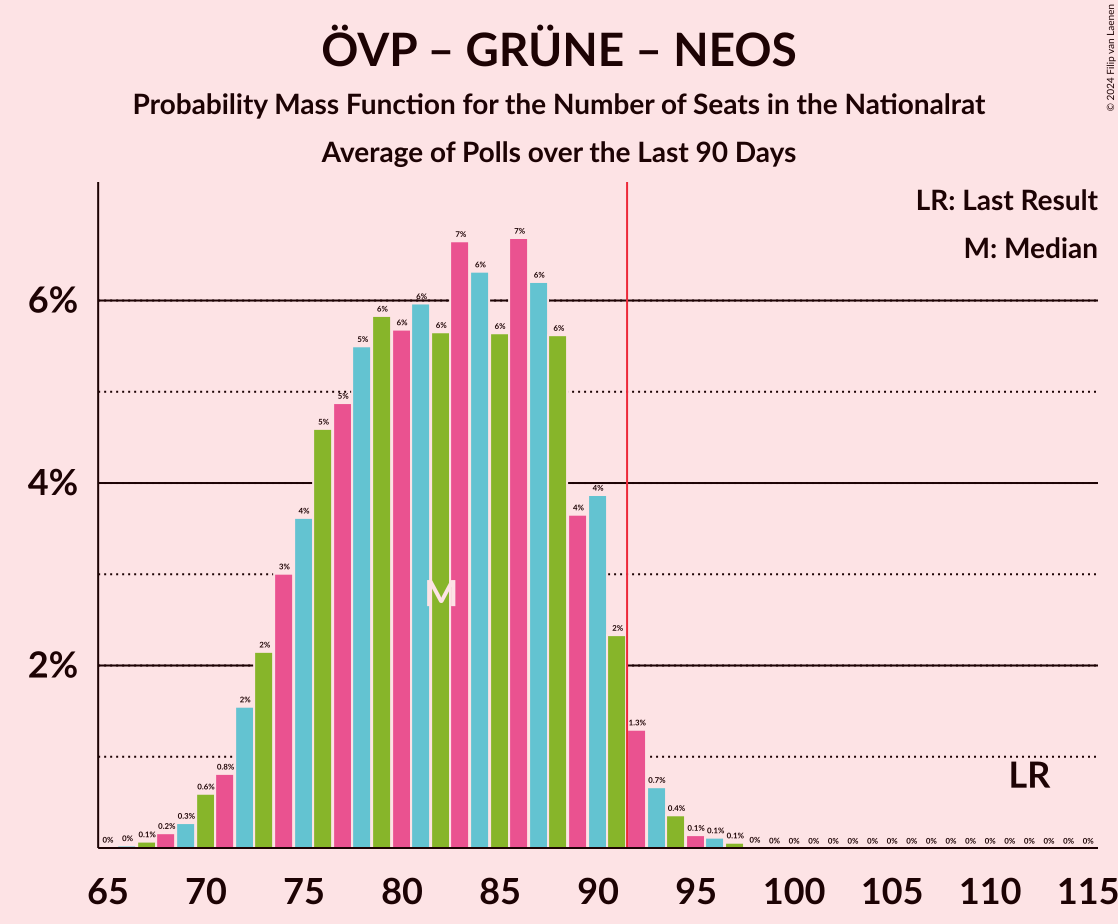
| Number of Seats | Probability | Accumulated | Special Marks |
|---|---|---|---|
| 67 | 0.1% | 100% | |
| 68 | 0.2% | 99.9% | |
| 69 | 0.3% | 99.7% | |
| 70 | 0.6% | 99.4% | |
| 71 | 0.8% | 98.9% | |
| 72 | 2% | 98% | |
| 73 | 2% | 96% | |
| 74 | 3% | 94% | |
| 75 | 4% | 91% | |
| 76 | 5% | 88% | |
| 77 | 5% | 83% | |
| 78 | 5% | 78% | |
| 79 | 6% | 73% | |
| 80 | 6% | 67% | |
| 81 | 6% | 61% | |
| 82 | 6% | 55% | Median |
| 83 | 7% | 50% | |
| 84 | 6% | 43% | |
| 85 | 6% | 37% | |
| 86 | 7% | 31% | |
| 87 | 6% | 24% | |
| 88 | 6% | 18% | |
| 89 | 4% | 13% | |
| 90 | 4% | 9% | |
| 91 | 2% | 5% | |
| 92 | 1.3% | 3% | Majority |
| 93 | 0.7% | 1.4% | |
| 94 | 0.4% | 0.7% | |
| 95 | 0.1% | 0.3% | |
| 96 | 0.1% | 0.2% | |
| 97 | 0.1% | 0.1% | |
| 98 | 0% | 0% | |
| 99 | 0% | 0% | |
| 100 | 0% | 0% | |
| 101 | 0% | 0% | |
| 102 | 0% | 0% | |
| 103 | 0% | 0% | |
| 104 | 0% | 0% | |
| 105 | 0% | 0% | |
| 106 | 0% | 0% | |
| 107 | 0% | 0% | |
| 108 | 0% | 0% | |
| 109 | 0% | 0% | |
| 110 | 0% | 0% | |
| 111 | 0% | 0% | |
| 112 | 0% | 0% | Last Result |
Sozialdemokratische Partei Österreichs – Die Grünen–Die Grüne Alternative – NEOS–Das Neue Österreich und Liberales Forum
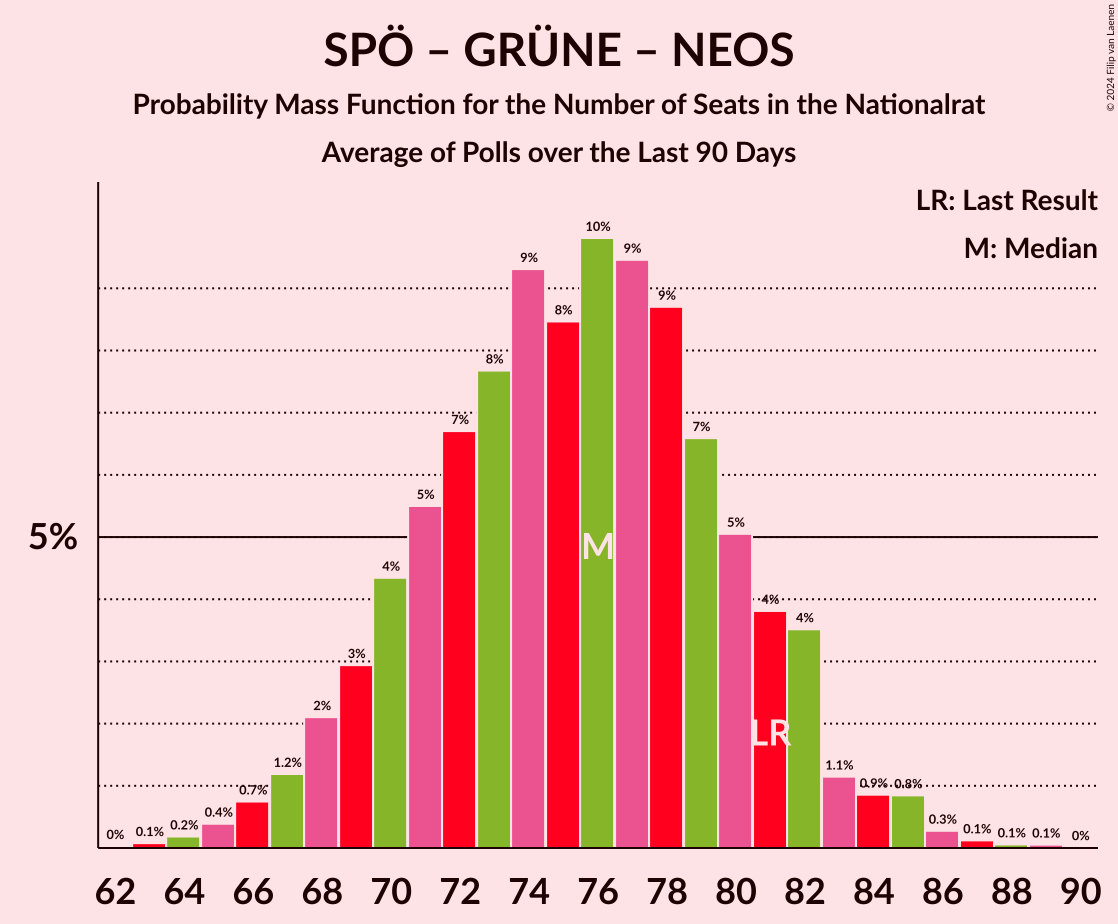
| Number of Seats | Probability | Accumulated | Special Marks |
|---|---|---|---|
| 63 | 0.1% | 100% | |
| 64 | 0.2% | 99.9% | |
| 65 | 0.4% | 99.7% | |
| 66 | 0.7% | 99.3% | |
| 67 | 1.2% | 98.6% | |
| 68 | 2% | 97% | |
| 69 | 3% | 95% | |
| 70 | 4% | 92% | |
| 71 | 5% | 88% | |
| 72 | 7% | 82% | |
| 73 | 8% | 76% | |
| 74 | 9% | 68% | |
| 75 | 8% | 59% | Median |
| 76 | 10% | 50% | |
| 77 | 9% | 41% | |
| 78 | 9% | 31% | |
| 79 | 7% | 22% | |
| 80 | 5% | 16% | |
| 81 | 4% | 11% | Last Result |
| 82 | 4% | 7% | |
| 83 | 1.1% | 3% | |
| 84 | 0.9% | 2% | |
| 85 | 0.8% | 1.4% | |
| 86 | 0.3% | 0.5% | |
| 87 | 0.1% | 0.2% | |
| 88 | 0.1% | 0.1% | |
| 89 | 0.1% | 0.1% | |
| 90 | 0% | 0% |
Österreichische Volkspartei – NEOS–Das Neue Österreich und Liberales Forum
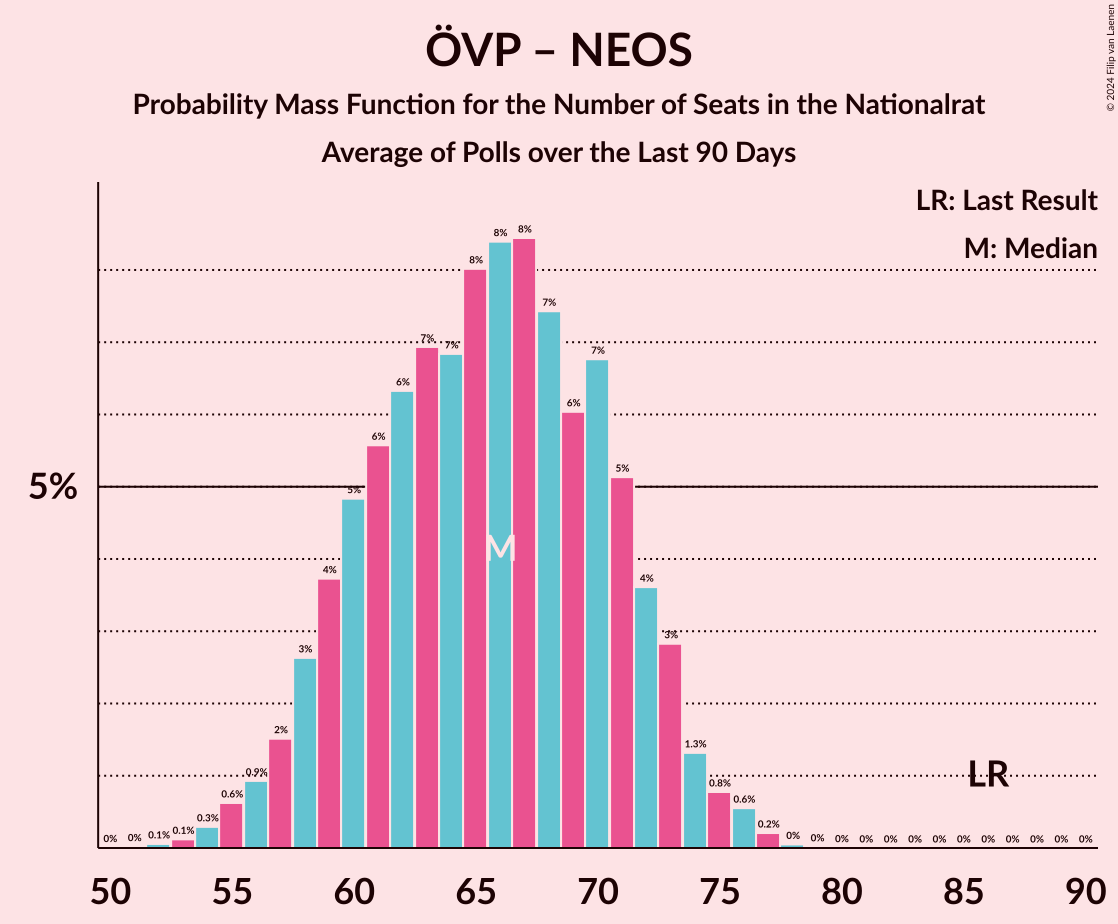
| Number of Seats | Probability | Accumulated | Special Marks |
|---|---|---|---|
| 52 | 0.1% | 100% | |
| 53 | 0.1% | 99.9% | |
| 54 | 0.3% | 99.8% | |
| 55 | 0.6% | 99.5% | |
| 56 | 0.9% | 98.9% | |
| 57 | 2% | 98% | |
| 58 | 3% | 96% | |
| 59 | 4% | 94% | |
| 60 | 5% | 90% | |
| 61 | 6% | 85% | |
| 62 | 6% | 80% | |
| 63 | 7% | 73% | |
| 64 | 7% | 66% | |
| 65 | 8% | 60% | |
| 66 | 8% | 52% | Median |
| 67 | 8% | 43% | |
| 68 | 7% | 35% | |
| 69 | 6% | 27% | |
| 70 | 7% | 21% | |
| 71 | 5% | 14% | |
| 72 | 4% | 9% | |
| 73 | 3% | 6% | |
| 74 | 1.3% | 3% | |
| 75 | 0.8% | 2% | |
| 76 | 0.6% | 0.8% | |
| 77 | 0.2% | 0.3% | |
| 78 | 0% | 0.1% | |
| 79 | 0% | 0% | |
| 80 | 0% | 0% | |
| 81 | 0% | 0% | |
| 82 | 0% | 0% | |
| 83 | 0% | 0% | |
| 84 | 0% | 0% | |
| 85 | 0% | 0% | |
| 86 | 0% | 0% | Last Result |
Österreichische Volkspartei – Die Grünen–Die Grüne Alternative
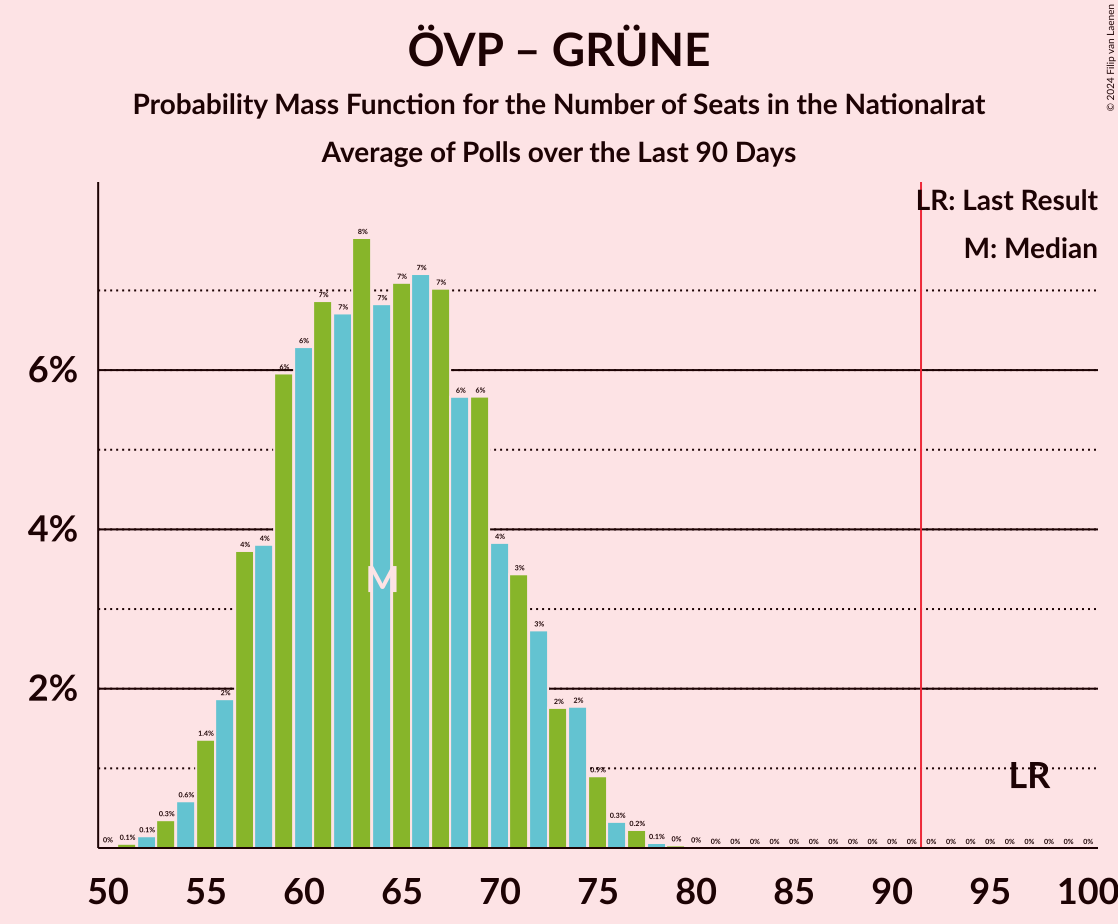
| Number of Seats | Probability | Accumulated | Special Marks |
|---|---|---|---|
| 51 | 0.1% | 100% | |
| 52 | 0.1% | 99.9% | |
| 53 | 0.3% | 99.8% | |
| 54 | 0.6% | 99.4% | |
| 55 | 1.4% | 98.8% | |
| 56 | 2% | 97% | |
| 57 | 4% | 96% | |
| 58 | 4% | 92% | |
| 59 | 6% | 88% | |
| 60 | 6% | 82% | |
| 61 | 7% | 76% | |
| 62 | 7% | 69% | |
| 63 | 8% | 62% | |
| 64 | 7% | 55% | Median |
| 65 | 7% | 48% | |
| 66 | 7% | 41% | |
| 67 | 7% | 33% | |
| 68 | 6% | 26% | |
| 69 | 6% | 21% | |
| 70 | 4% | 15% | |
| 71 | 3% | 11% | |
| 72 | 3% | 8% | |
| 73 | 2% | 5% | |
| 74 | 2% | 3% | |
| 75 | 0.9% | 2% | |
| 76 | 0.3% | 0.7% | |
| 77 | 0.2% | 0.3% | |
| 78 | 0.1% | 0.1% | |
| 79 | 0% | 0.1% | |
| 80 | 0% | 0% | |
| 81 | 0% | 0% | |
| 82 | 0% | 0% | |
| 83 | 0% | 0% | |
| 84 | 0% | 0% | |
| 85 | 0% | 0% | |
| 86 | 0% | 0% | |
| 87 | 0% | 0% | |
| 88 | 0% | 0% | |
| 89 | 0% | 0% | |
| 90 | 0% | 0% | |
| 91 | 0% | 0% | |
| 92 | 0% | 0% | Majority |
| 93 | 0% | 0% | |
| 94 | 0% | 0% | |
| 95 | 0% | 0% | |
| 96 | 0% | 0% | |
| 97 | 0% | 0% | Last Result |
Sozialdemokratische Partei Österreichs – Die Grünen–Die Grüne Alternative
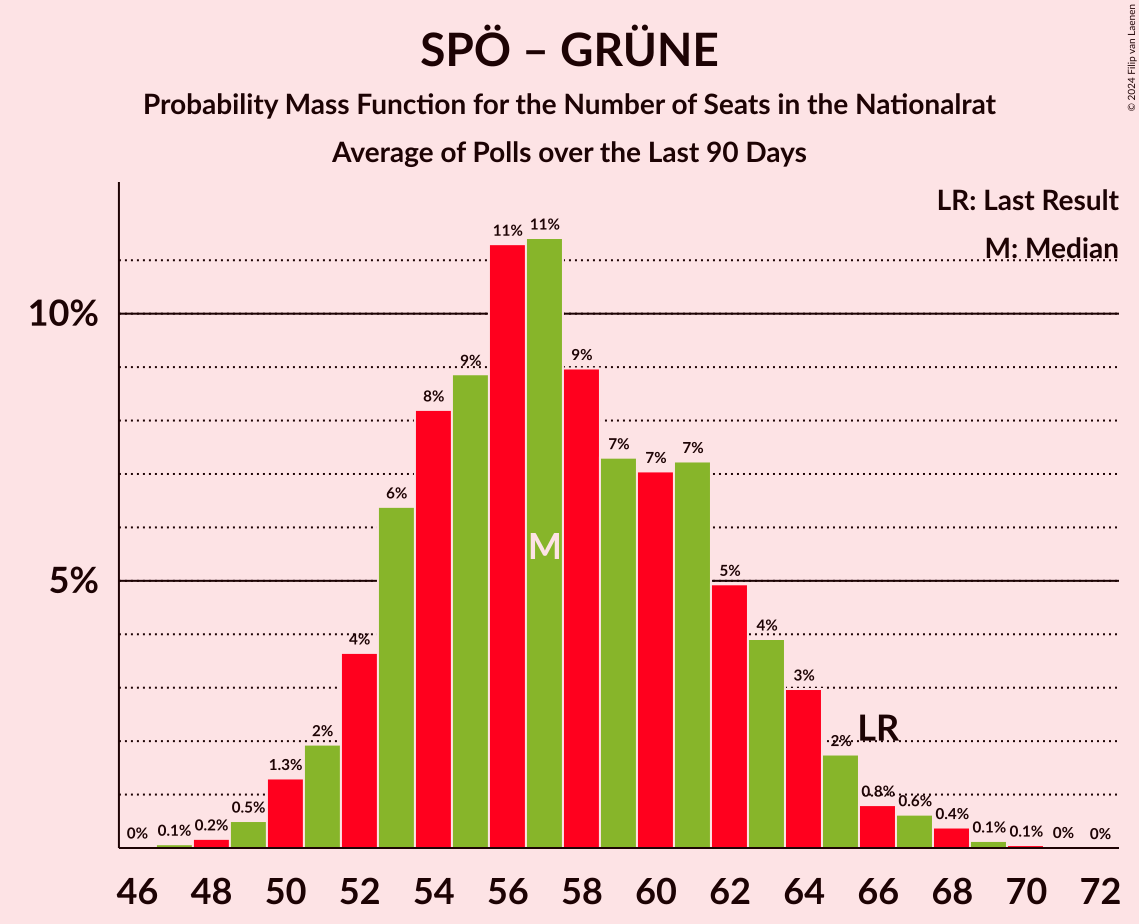
| Number of Seats | Probability | Accumulated | Special Marks |
|---|---|---|---|
| 47 | 0.1% | 100% | |
| 48 | 0.2% | 99.9% | |
| 49 | 0.5% | 99.7% | |
| 50 | 1.3% | 99.2% | |
| 51 | 2% | 98% | |
| 52 | 4% | 96% | |
| 53 | 6% | 92% | |
| 54 | 8% | 86% | |
| 55 | 9% | 78% | |
| 56 | 11% | 69% | |
| 57 | 11% | 58% | Median |
| 58 | 9% | 46% | |
| 59 | 7% | 37% | |
| 60 | 7% | 30% | |
| 61 | 7% | 23% | |
| 62 | 5% | 16% | |
| 63 | 4% | 11% | |
| 64 | 3% | 7% | |
| 65 | 2% | 4% | |
| 66 | 0.8% | 2% | Last Result |
| 67 | 0.6% | 1.2% | |
| 68 | 0.4% | 0.6% | |
| 69 | 0.1% | 0.2% | |
| 70 | 0.1% | 0.1% | |
| 71 | 0% | 0% |
Österreichische Volkspartei
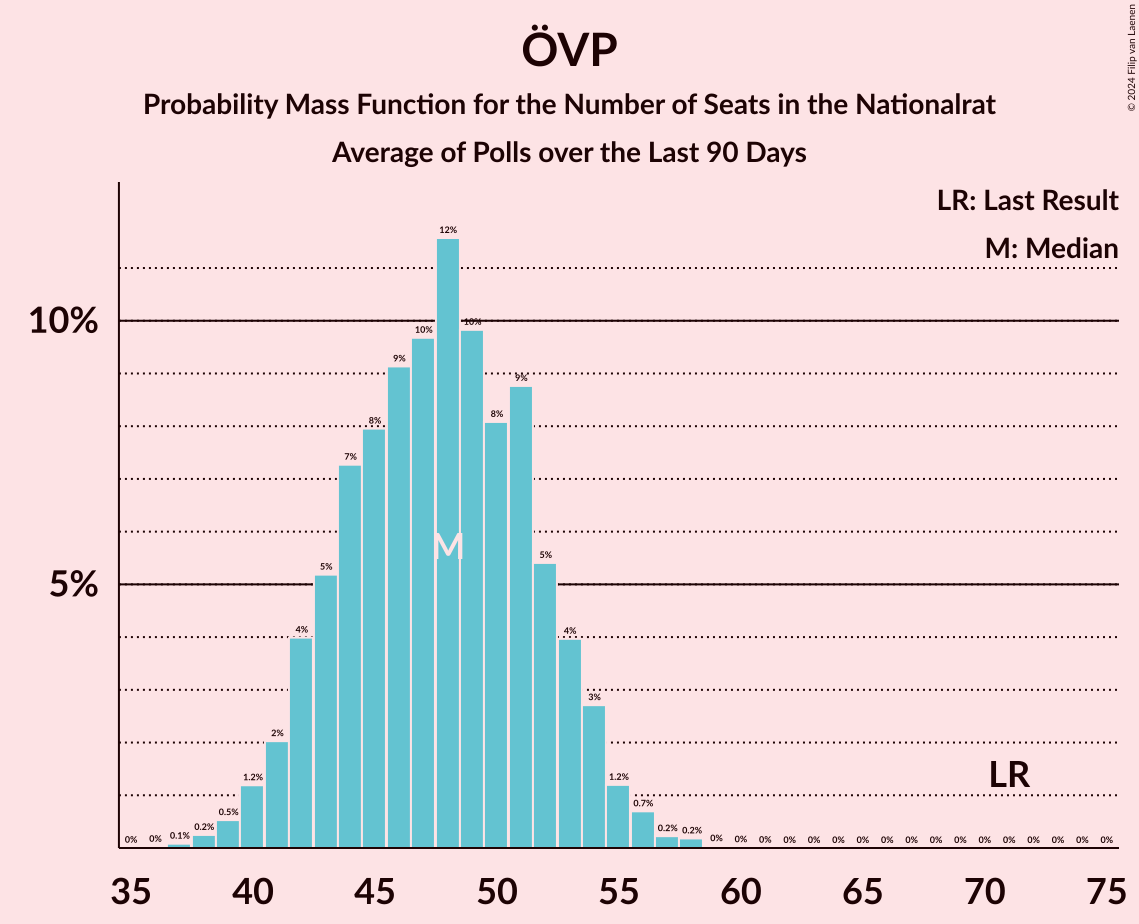
| Number of Seats | Probability | Accumulated | Special Marks |
|---|---|---|---|
| 37 | 0.1% | 100% | |
| 38 | 0.2% | 99.9% | |
| 39 | 0.5% | 99.6% | |
| 40 | 1.2% | 99.1% | |
| 41 | 2% | 98% | |
| 42 | 4% | 96% | |
| 43 | 5% | 92% | |
| 44 | 7% | 87% | |
| 45 | 8% | 79% | |
| 46 | 9% | 71% | |
| 47 | 10% | 62% | |
| 48 | 12% | 53% | Median |
| 49 | 10% | 41% | |
| 50 | 8% | 31% | |
| 51 | 9% | 23% | |
| 52 | 5% | 14% | |
| 53 | 4% | 9% | |
| 54 | 3% | 5% | |
| 55 | 1.2% | 2% | |
| 56 | 0.7% | 1.2% | |
| 57 | 0.2% | 0.5% | |
| 58 | 0.2% | 0.2% | |
| 59 | 0% | 0.1% | |
| 60 | 0% | 0% | |
| 61 | 0% | 0% | |
| 62 | 0% | 0% | |
| 63 | 0% | 0% | |
| 64 | 0% | 0% | |
| 65 | 0% | 0% | |
| 66 | 0% | 0% | |
| 67 | 0% | 0% | |
| 68 | 0% | 0% | |
| 69 | 0% | 0% | |
| 70 | 0% | 0% | |
| 71 | 0% | 0% | Last Result |
Sozialdemokratische Partei Österreichs
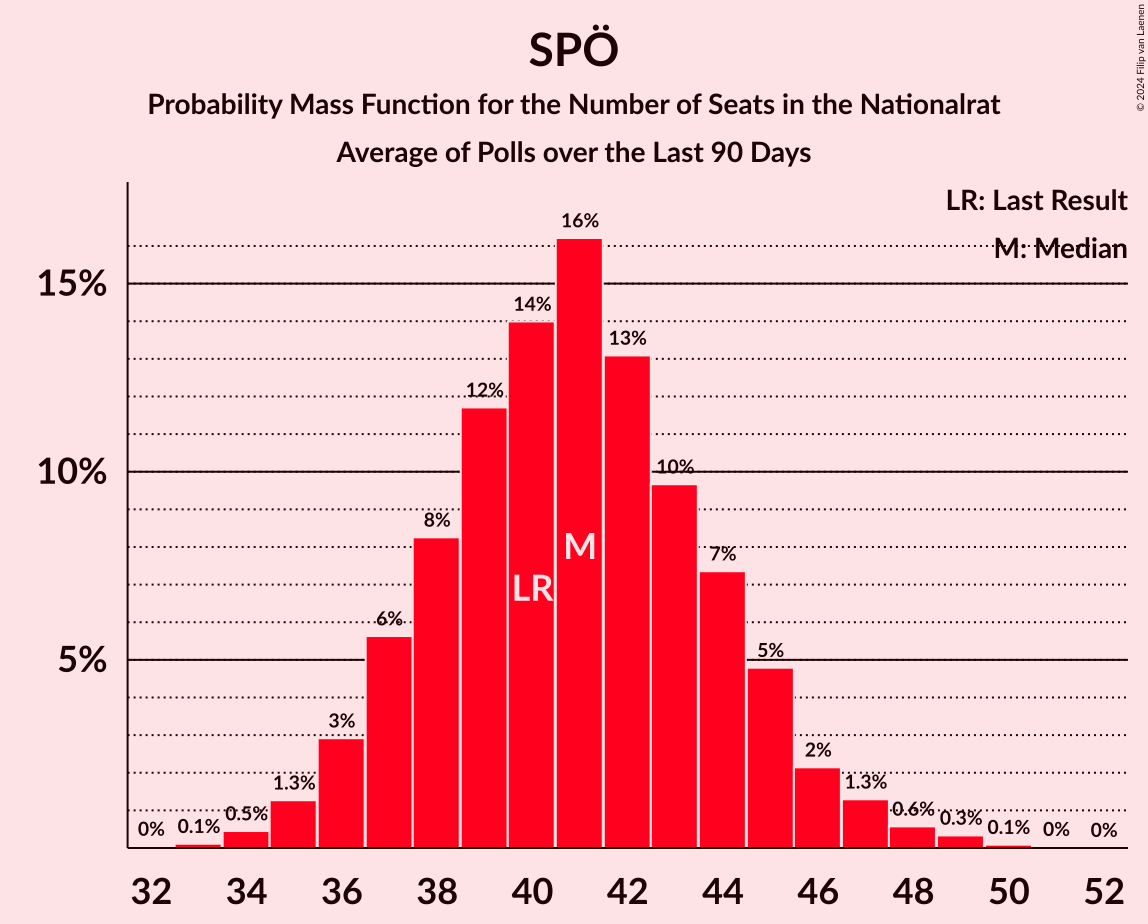
| Number of Seats | Probability | Accumulated | Special Marks |
|---|---|---|---|
| 32 | 0% | 100% | |
| 33 | 0.1% | 99.9% | |
| 34 | 0.5% | 99.8% | |
| 35 | 1.3% | 99.4% | |
| 36 | 3% | 98% | |
| 37 | 6% | 95% | |
| 38 | 8% | 90% | |
| 39 | 12% | 81% | |
| 40 | 14% | 70% | Last Result |
| 41 | 16% | 56% | Median |
| 42 | 13% | 39% | |
| 43 | 10% | 26% | |
| 44 | 7% | 17% | |
| 45 | 5% | 9% | |
| 46 | 2% | 4% | |
| 47 | 1.3% | 2% | |
| 48 | 0.6% | 1.0% | |
| 49 | 0.3% | 0.5% | |
| 50 | 0.1% | 0.1% | |
| 51 | 0% | 0.1% | |
| 52 | 0% | 0% |
Technical Information
- Number of polls included in this average: 7
- Lowest number of simulations done in a poll included in this average: 2,097,152
- Total number of simulations done in the polls included in this average: 14,680,064
- Error estimate: 2.35%