European Conservatives and Reformists
Members registered from 15 countries:
BG, CY, CZ, DK, EE, FI, GR, HR, IT, LT, NL, PL, RO, SE, SK
Seats
Last result: 78 seats (General Election of 26 May 2019)
Current median: 76 seats (-2 seats)
At least one member in 13 countries have a median of 1 seat or more:
CY, CZ, DK, FI, GR, HR, IT, LT, NL, PL, RO, SE, SK
Confidence Intervals
| Party | Area | Last Result | Median | 80% Confidence Interval | 90% Confidence Interval | 95% Confidence Interval | 99% Confidence Interval |
|---|---|---|---|---|---|---|---|
| European Conservatives and Reformists | EU | 78 | 76 | 72–80 | 71–81 | 70–82 | 68–83 |
| Fratelli d’Italia | IT | 25 | 23–27 | 22–28 | 21–28 | 21–29 | |
| Zjednoczona Prawica | PL | 15 | 12–17 | 12–17 | 12–18 | 12–19 | |
| Alianța pentru Unirea Românilor | RO | 14 | 13–16 | 12–17 | 12–17 | 12–18 | |
| Sverigedemokraterna | SE | 5 | 4–5 | 4–5 | 4–5 | 4–6 | |
| Občanská demokratická strana | CZ | 4 | 3–4 | 3–5 | 3–5 | 3–5 | |
| Juiste Antwoord 2021 | NL | 3 | 3 | 3 | 3–4 | 2–4 | |
| Perussuomalaiset | FI | 2 | 2 | 2 | 2 | 2–3 | |
| Ελληνική Λύση | GR | 2 | 1–3 | 1–3 | 1–3 | 1–3 | |
| Danmarksdemokraterne | DK | 1 | 1–2 | 1–2 | 1–2 | 1–2 | |
| Lietuvos valstiečių ir žaliųjų sąjunga | LT | 1 | 1–2 | 1–2 | 1–2 | 1–2 | |
| Most nezavisnih lista | HR | 1 | 0–1 | 0–1 | 0–1 | 0–1 | |
| Sloboda a Solidarita | SK | 1 | 1–2 | 1–2 | 1–2 | 1–2 | |
| Εθνικό Λαϊκό Μέτωπο | CY | 1 | 1 | 1 | 1 | 1 | |
| Dom i Nacionalno Okupljanje | HR | 0 | 0 | 0 | 0 | 0 | |
| Domovinski pokret | HR | 0 | 0 | 0 | 0 | 0 | |
| Eesti Rahvuslased ja Konservatiivid | EE | 0 | 0 | 0 | 0 | 0 | |
| Hrvatski suverenisti | HR | 0 | 0 | 0 | 0 | 0 | |
| Kresťanská únia | SK | 0 | 0 | 0 | 0 | 0 | |
| Lietuvos lenkų rinkimų akcija | LT | 0 | 0 | 0 | 0 | 0 | |
| NL Marija Selak Raspudić | HR | 0 | 0 | 0 | 0 | 0 | |
| Staatkundig Gereformeerde Partij | NL | 0 | 0 | 0 | 0 | 0 | |
| Има такъв народ | BG | 0 | 0 | 0 | 0 | 0 |
Probability Mass Function

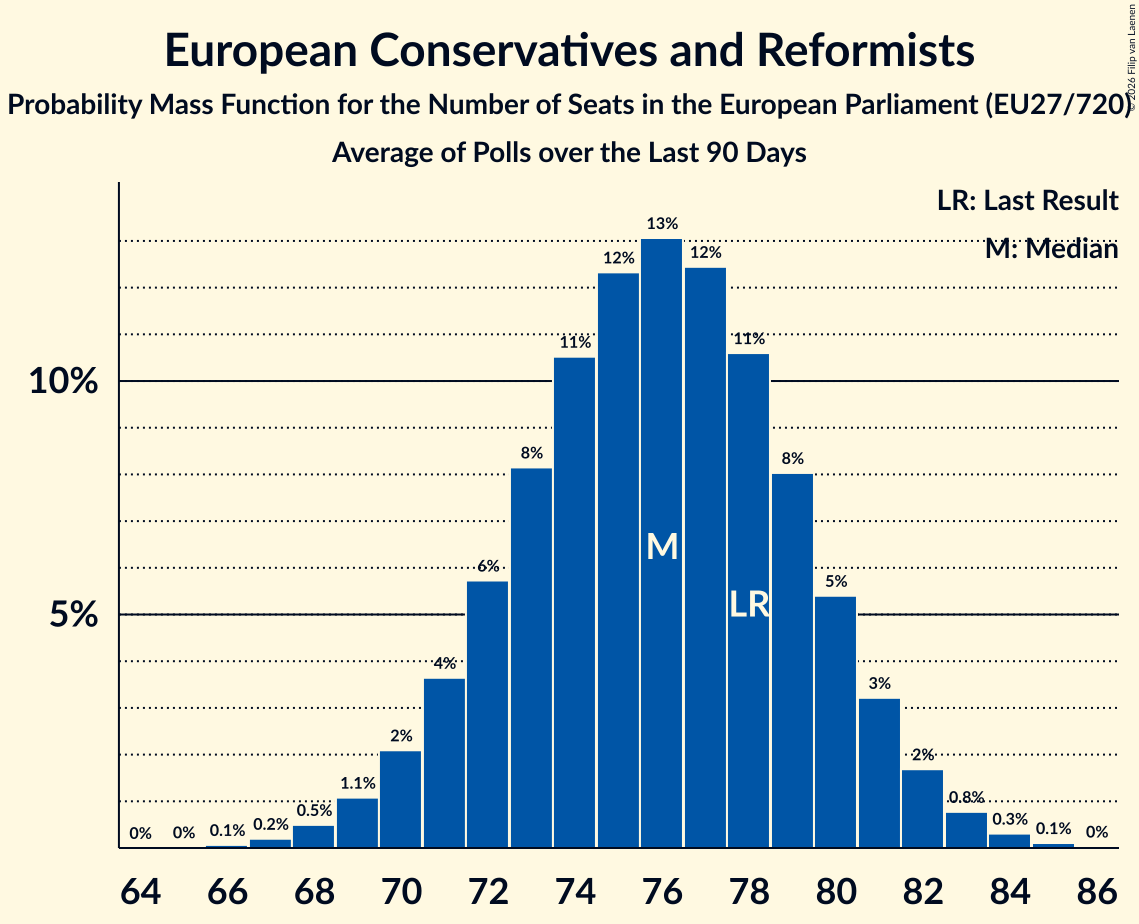
The following table shows the probability mass function per seat for the poll average for European Conservatives and Reformists.
| Number of Seats | Probability | Accumulated | Special Marks |
|---|---|---|---|
| 66 | 0.1% | 100% | |
| 67 | 0.2% | 99.9% | |
| 68 | 0.5% | 99.7% | |
| 69 | 1.1% | 99.2% | |
| 70 | 2% | 98% | |
| 71 | 4% | 96% | |
| 72 | 6% | 92% | |
| 73 | 8% | 87% | |
| 74 | 11% | 79% | |
| 75 | 12% | 68% | |
| 76 | 13% | 56% | Median |
| 77 | 12% | 43% | |
| 78 | 11% | 30% | Last Result |
| 79 | 8% | 20% | |
| 80 | 5% | 12% | |
| 81 | 3% | 6% | |
| 82 | 2% | 3% | |
| 83 | 0.8% | 1.2% | |
| 84 | 0.3% | 0.5% | |
| 85 | 0.1% | 0.1% | |
| 86 | 0% | 0% |