Seat Projection for the European Parliament (EU27/705)
Seats | Voting Intentions | Technical Information
Seats
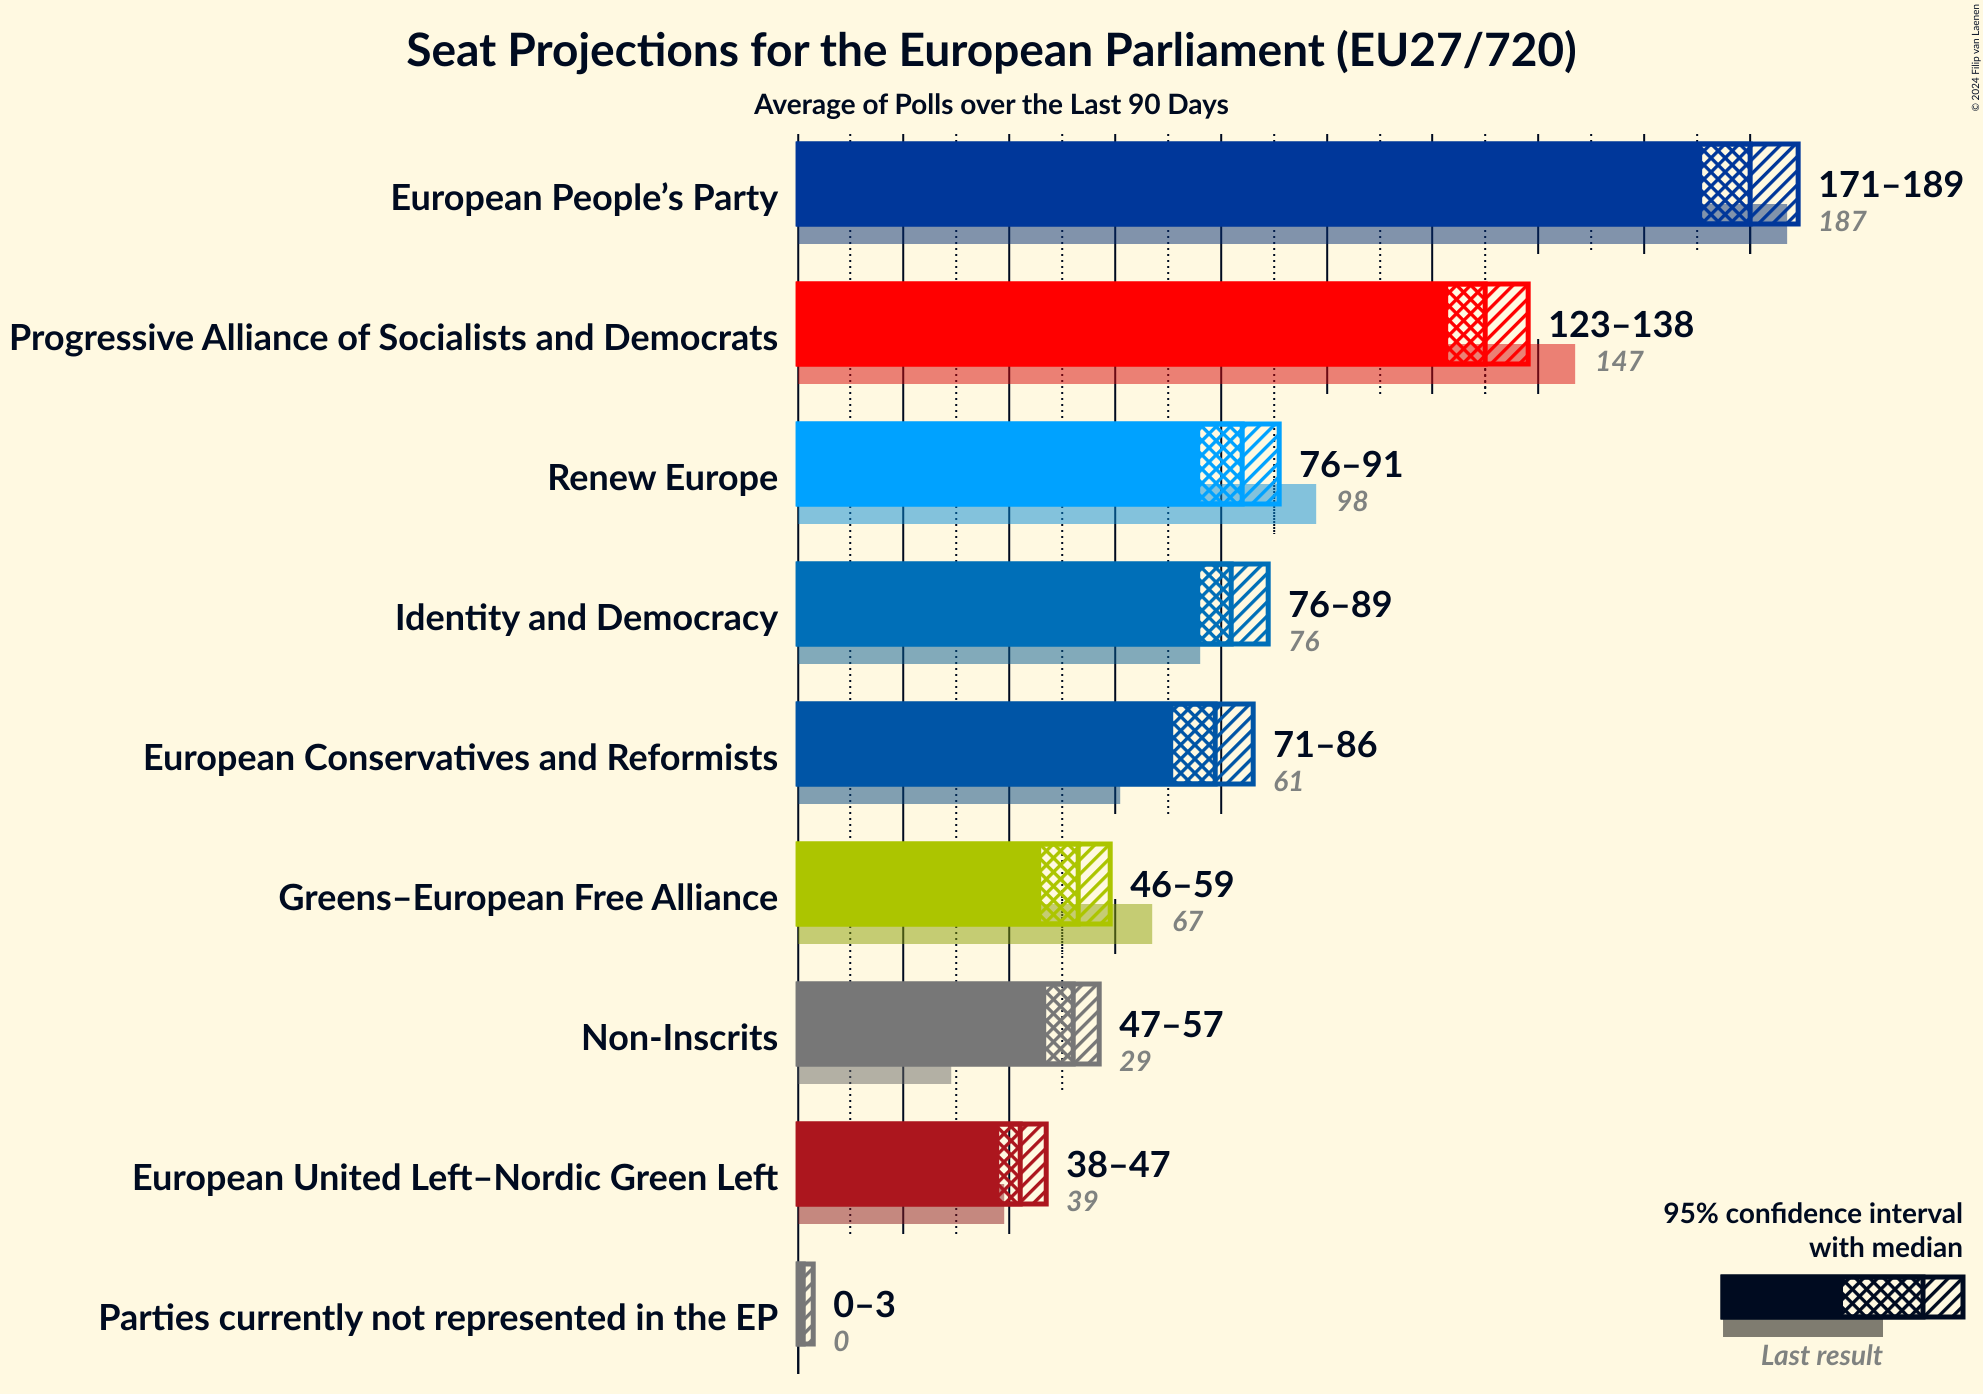
Confidence Intervals
| Group | Last Result | Median | 80% Confidence Interval | 90% Confidence Interval | 95% Confidence Interval | 99% Confidence Interval |
|---|---|---|---|---|---|---|
| European People’s Party | 188 | 150 | 145–155 | 143–157 | 142–158 | 139–160 |
| Progressive Alliance of Socialists and Democrats | 136 | 106 | 101–110 | 100–112 | 99–113 | 97–115 |
| European Conservatives and Reformists | 78 | 76 | 72–80 | 71–81 | 70–82 | 68–83 |
| Patriots for Europe | 84 | 57 | 54–59 | 53–60 | 52–61 | 51–62 |
| Renew Europe | 77 | 46 | 43–50 | 43–51 | 42–52 | 41–54 |
| European United Left–Nordic Green Left | 46 | 41 | 38–45 | 37–46 | 37–46 | 35–48 |
| Europe of Sovereign Nations | 25 | 35 | 32–37 | 32–38 | 31–39 | 30–40 |
| Greens–European Free Alliance | 53 | 33 | 31–36 | 30–37 | 29–37 | 28–39 |
| Non-Inscrits | 32 | 22 | 20–26 | 19–27 | 18–28 | 17–29 |
| Parties currently not represented in the EP | 1 | 8 | 6–8 | 6–9 | 6–9 | 6–10 |
European People’s Party
For a full overview of the results for this party, see the European People’s Party page.
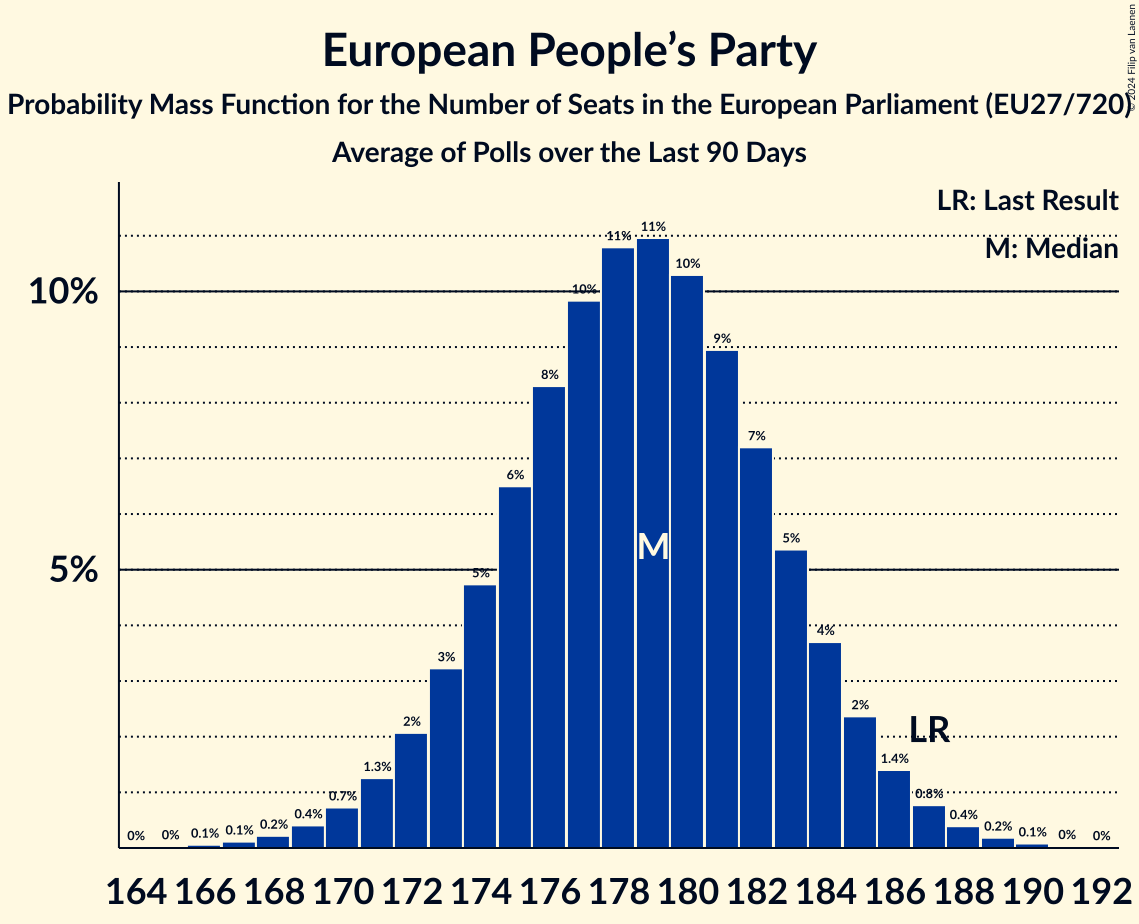
| Number of Seats | Probability | Accumulated | Special Marks |
|---|---|---|---|
| 136 | 0% | 100% | |
| 137 | 0.1% | 99.9% | |
| 138 | 0.2% | 99.8% | |
| 139 | 0.4% | 99.6% | |
| 140 | 0.6% | 99.2% | |
| 141 | 1.0% | 98.6% | |
| 142 | 2% | 98% | |
| 143 | 2% | 96% | |
| 144 | 3% | 94% | |
| 145 | 4% | 91% | |
| 146 | 6% | 86% | |
| 147 | 7% | 81% | |
| 148 | 8% | 74% | |
| 149 | 9% | 65% | |
| 150 | 10% | 56% | Median |
| 151 | 10% | 46% | |
| 152 | 9% | 37% | |
| 153 | 8% | 28% | |
| 154 | 6% | 20% | |
| 155 | 5% | 14% | |
| 156 | 3% | 9% | |
| 157 | 2% | 5% | |
| 158 | 1.4% | 3% | |
| 159 | 0.8% | 2% | |
| 160 | 0.4% | 0.8% | |
| 161 | 0.2% | 0.4% | |
| 162 | 0.1% | 0.2% | |
| 163 | 0% | 0.1% | |
| 164 | 0% | 0% | |
| 165 | 0% | 0% | |
| 166 | 0% | 0% | |
| 167 | 0% | 0% | |
| 168 | 0% | 0% | |
| 169 | 0% | 0% | |
| 170 | 0% | 0% | |
| 171 | 0% | 0% | |
| 172 | 0% | 0% | |
| 173 | 0% | 0% | |
| 174 | 0% | 0% | |
| 175 | 0% | 0% | |
| 176 | 0% | 0% | |
| 177 | 0% | 0% | |
| 178 | 0% | 0% | |
| 179 | 0% | 0% | |
| 180 | 0% | 0% | |
| 181 | 0% | 0% | |
| 182 | 0% | 0% | |
| 183 | 0% | 0% | |
| 184 | 0% | 0% | |
| 185 | 0% | 0% | |
| 186 | 0% | 0% | |
| 187 | 0% | 0% | |
| 188 | 0% | 0% | Last Result |
Progressive Alliance of Socialists and Democrats
For a full overview of the results for this party, see the Progressive Alliance of Socialists and Democrats page.
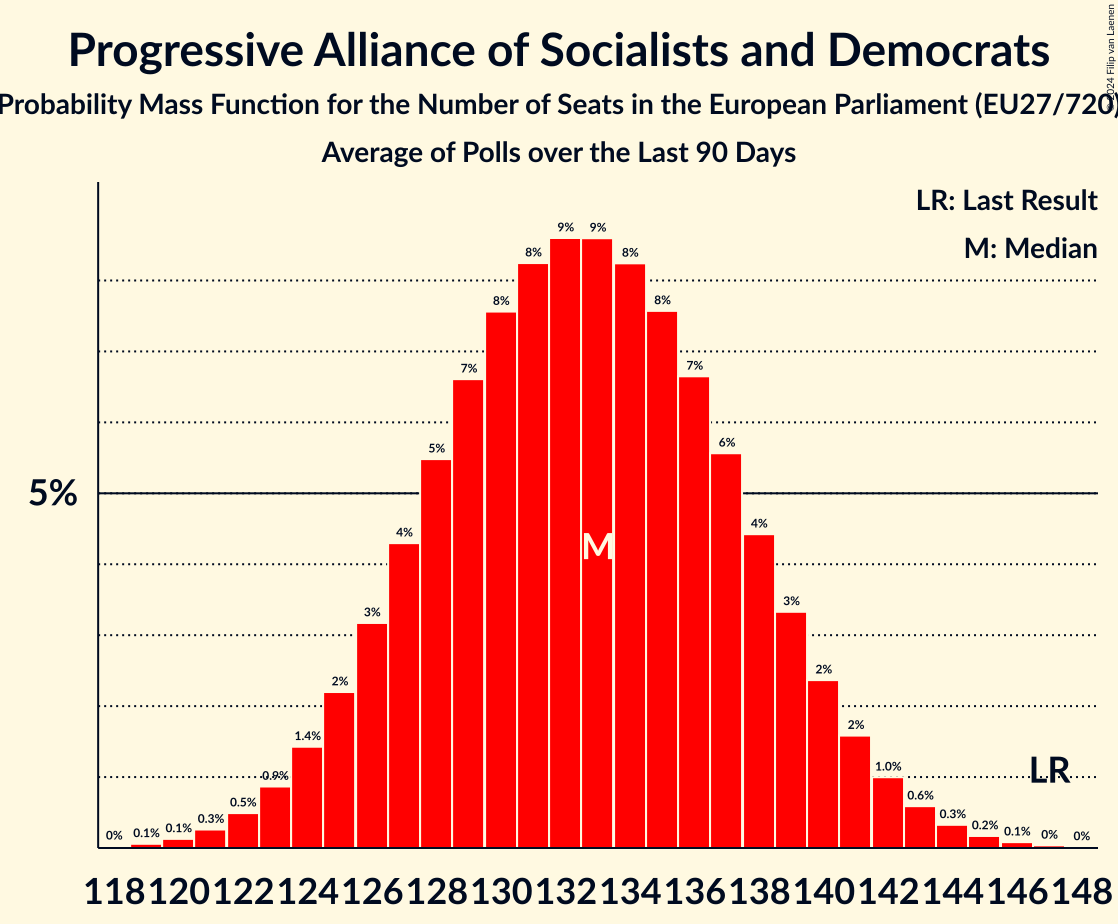
| Number of Seats | Probability | Accumulated | Special Marks |
|---|---|---|---|
| 94 | 0% | 100% | |
| 95 | 0.1% | 99.9% | |
| 96 | 0.2% | 99.8% | |
| 97 | 0.5% | 99.6% | |
| 98 | 1.0% | 99.1% | |
| 99 | 2% | 98% | |
| 100 | 3% | 96% | |
| 101 | 5% | 93% | |
| 102 | 7% | 88% | |
| 103 | 9% | 82% | |
| 104 | 11% | 73% | |
| 105 | 11% | 62% | |
| 106 | 11% | 51% | Median |
| 107 | 10% | 40% | |
| 108 | 9% | 29% | |
| 109 | 7% | 21% | |
| 110 | 5% | 14% | |
| 111 | 3% | 9% | |
| 112 | 2% | 6% | |
| 113 | 1.5% | 3% | |
| 114 | 0.9% | 2% | |
| 115 | 0.5% | 0.9% | |
| 116 | 0.2% | 0.4% | |
| 117 | 0.1% | 0.2% | |
| 118 | 0% | 0.1% | |
| 119 | 0% | 0% | |
| 120 | 0% | 0% | |
| 121 | 0% | 0% | |
| 122 | 0% | 0% | |
| 123 | 0% | 0% | |
| 124 | 0% | 0% | |
| 125 | 0% | 0% | |
| 126 | 0% | 0% | |
| 127 | 0% | 0% | |
| 128 | 0% | 0% | |
| 129 | 0% | 0% | |
| 130 | 0% | 0% | |
| 131 | 0% | 0% | |
| 132 | 0% | 0% | |
| 133 | 0% | 0% | |
| 134 | 0% | 0% | |
| 135 | 0% | 0% | |
| 136 | 0% | 0% | Last Result |
Patriots for Europe
For a full overview of the results for this party, see the Patriots for Europe page.
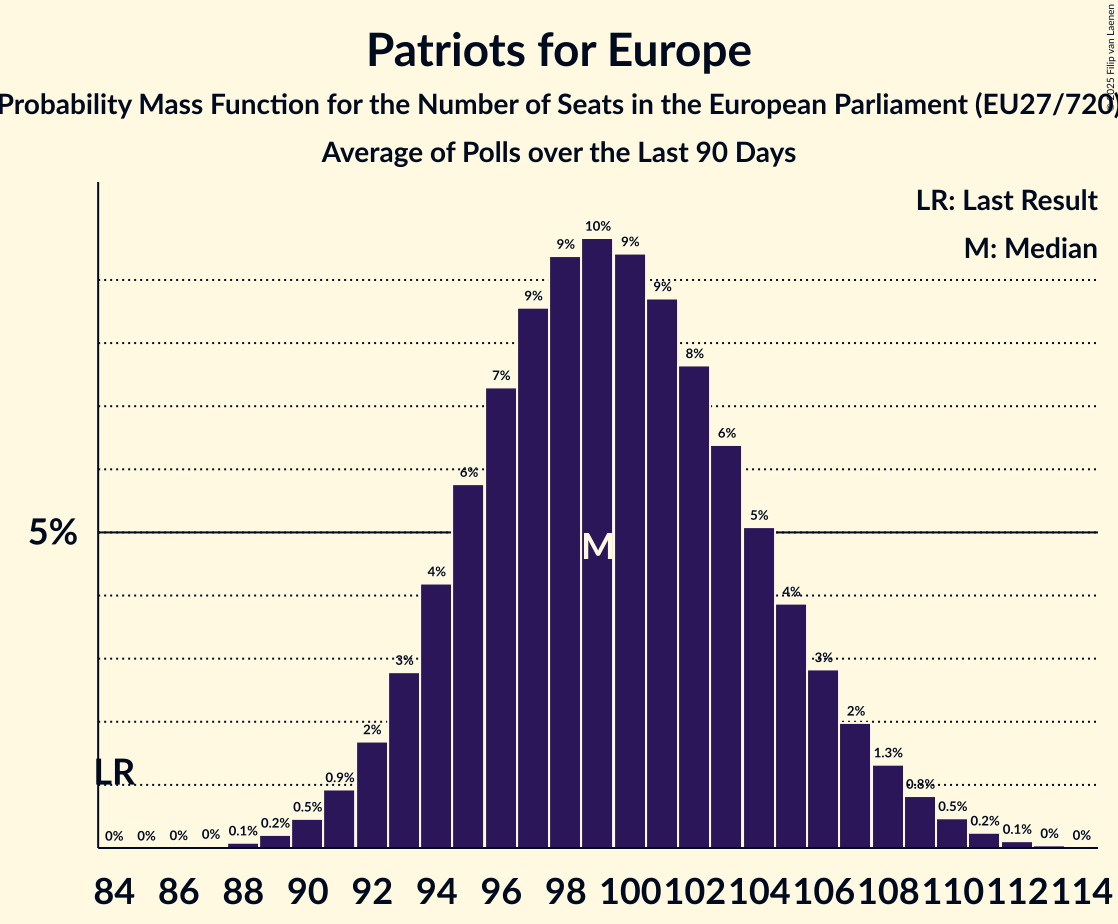
| Number of Seats | Probability | Accumulated | Special Marks |
|---|---|---|---|
| 50 | 0.1% | 100% | |
| 51 | 0.6% | 99.8% | |
| 52 | 2% | 99.3% | |
| 53 | 5% | 97% | |
| 54 | 9% | 93% | |
| 55 | 15% | 84% | |
| 56 | 18% | 69% | |
| 57 | 18% | 51% | Median |
| 58 | 15% | 33% | |
| 59 | 10% | 18% | |
| 60 | 5% | 8% | |
| 61 | 2% | 3% | |
| 62 | 0.8% | 1.1% | |
| 63 | 0.2% | 0.3% | |
| 64 | 0.1% | 0.1% | |
| 65 | 0% | 0% | |
| 66 | 0% | 0% | |
| 67 | 0% | 0% | |
| 68 | 0% | 0% | |
| 69 | 0% | 0% | |
| 70 | 0% | 0% | |
| 71 | 0% | 0% | |
| 72 | 0% | 0% | |
| 73 | 0% | 0% | |
| 74 | 0% | 0% | |
| 75 | 0% | 0% | |
| 76 | 0% | 0% | |
| 77 | 0% | 0% | |
| 78 | 0% | 0% | |
| 79 | 0% | 0% | |
| 80 | 0% | 0% | |
| 81 | 0% | 0% | |
| 82 | 0% | 0% | |
| 83 | 0% | 0% | |
| 84 | 0% | 0% | Last Result |
European Conservatives and Reformists
For a full overview of the results for this party, see the European Conservatives and Reformists page.
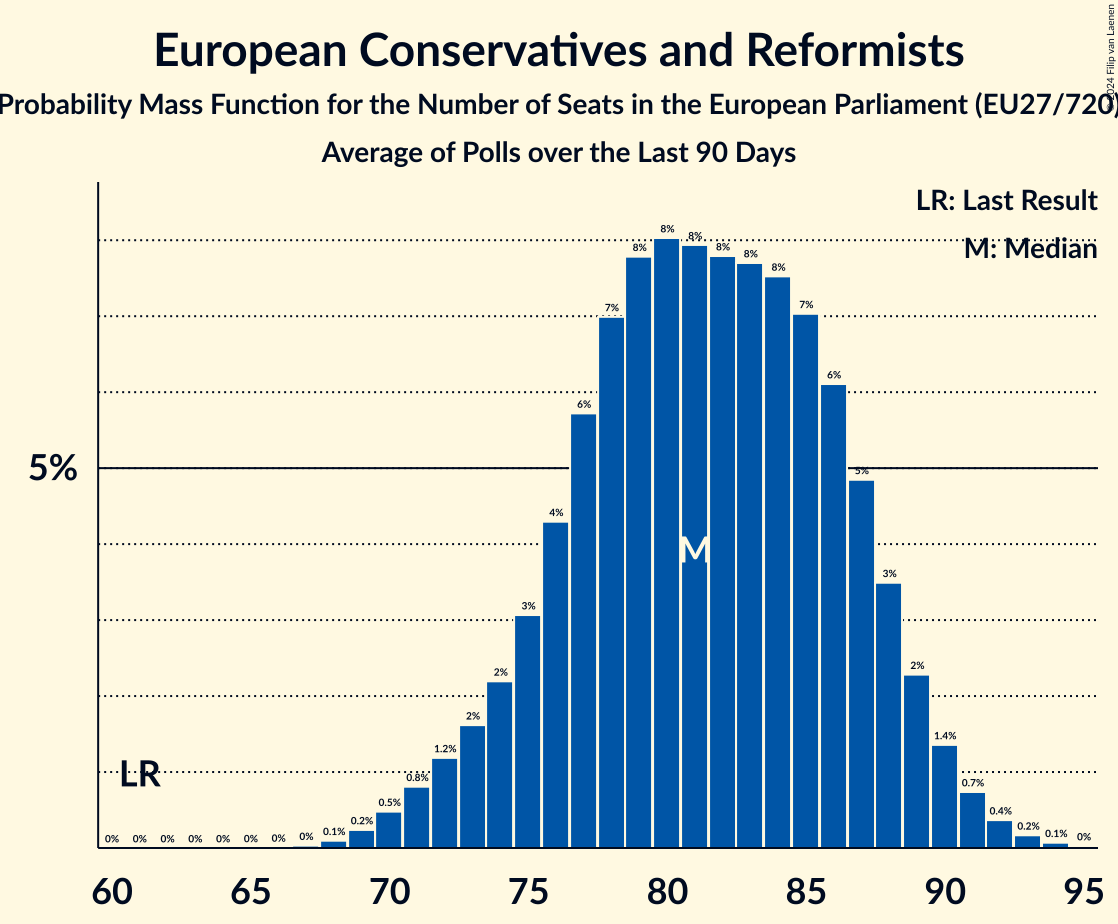
| Number of Seats | Probability | Accumulated | Special Marks |
|---|---|---|---|
| 66 | 0.1% | 100% | |
| 67 | 0.2% | 99.9% | |
| 68 | 0.5% | 99.7% | |
| 69 | 1.1% | 99.2% | |
| 70 | 2% | 98% | |
| 71 | 4% | 96% | |
| 72 | 6% | 92% | |
| 73 | 8% | 87% | |
| 74 | 11% | 79% | |
| 75 | 12% | 68% | |
| 76 | 13% | 56% | Median |
| 77 | 12% | 43% | |
| 78 | 11% | 30% | Last Result |
| 79 | 8% | 20% | |
| 80 | 5% | 12% | |
| 81 | 3% | 6% | |
| 82 | 2% | 3% | |
| 83 | 0.8% | 1.2% | |
| 84 | 0.3% | 0.5% | |
| 85 | 0.1% | 0.1% | |
| 86 | 0% | 0% |
Renew Europe
For a full overview of the results for this party, see the Renew Europe page.
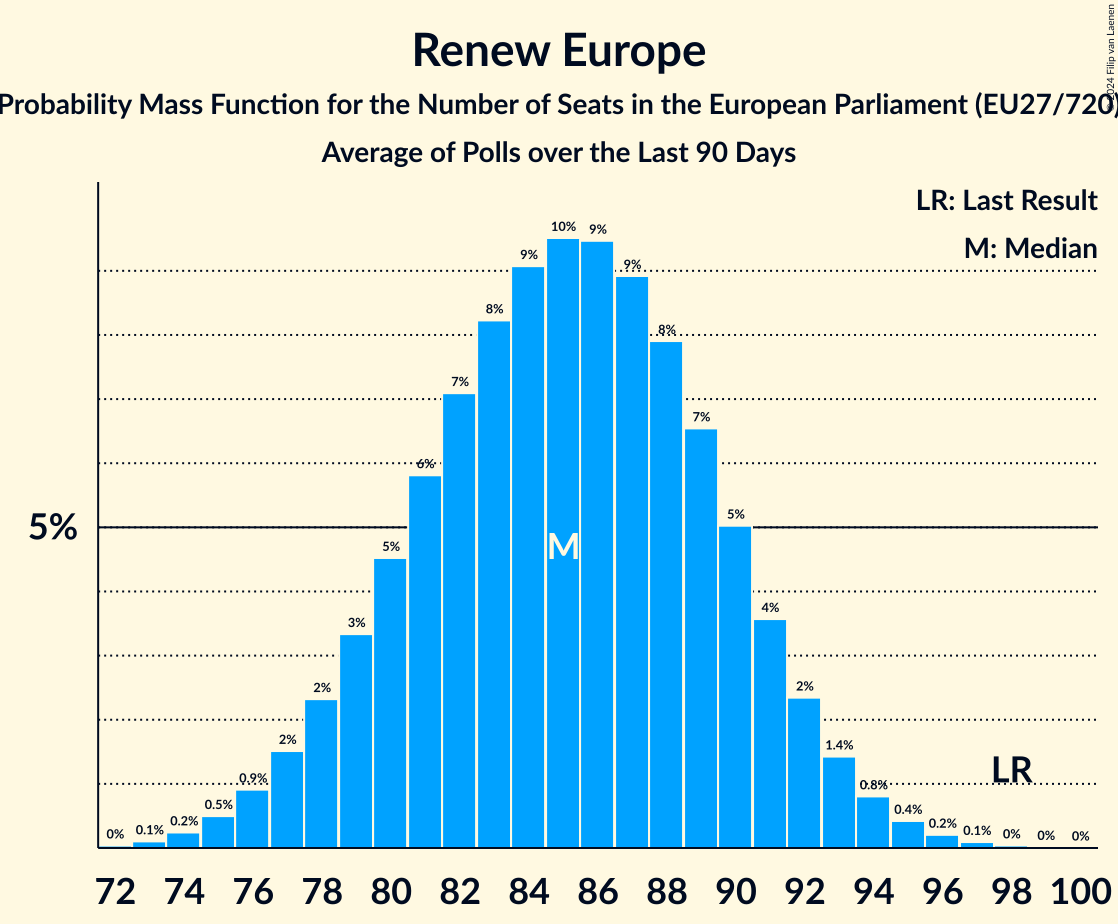
| Number of Seats | Probability | Accumulated | Special Marks |
|---|---|---|---|
| 39 | 0.1% | 100% | |
| 40 | 0.4% | 99.9% | |
| 41 | 1.2% | 99.5% | |
| 42 | 3% | 98% | |
| 43 | 6% | 95% | |
| 44 | 10% | 89% | |
| 45 | 14% | 79% | |
| 46 | 16% | 65% | Median |
| 47 | 15% | 49% | |
| 48 | 12% | 35% | |
| 49 | 9% | 23% | |
| 50 | 6% | 14% | |
| 51 | 4% | 8% | |
| 52 | 2% | 4% | |
| 53 | 1.2% | 2% | |
| 54 | 0.6% | 1.0% | |
| 55 | 0.3% | 0.4% | |
| 56 | 0.1% | 0.1% | |
| 57 | 0% | 0% | |
| 58 | 0% | 0% | |
| 59 | 0% | 0% | |
| 60 | 0% | 0% | |
| 61 | 0% | 0% | |
| 62 | 0% | 0% | |
| 63 | 0% | 0% | |
| 64 | 0% | 0% | |
| 65 | 0% | 0% | |
| 66 | 0% | 0% | |
| 67 | 0% | 0% | |
| 68 | 0% | 0% | |
| 69 | 0% | 0% | |
| 70 | 0% | 0% | |
| 71 | 0% | 0% | |
| 72 | 0% | 0% | |
| 73 | 0% | 0% | |
| 74 | 0% | 0% | |
| 75 | 0% | 0% | |
| 76 | 0% | 0% | |
| 77 | 0% | 0% | Last Result |
Greens–European Free Alliance
For a full overview of the results for this party, see the Greens–European Free Alliance page.
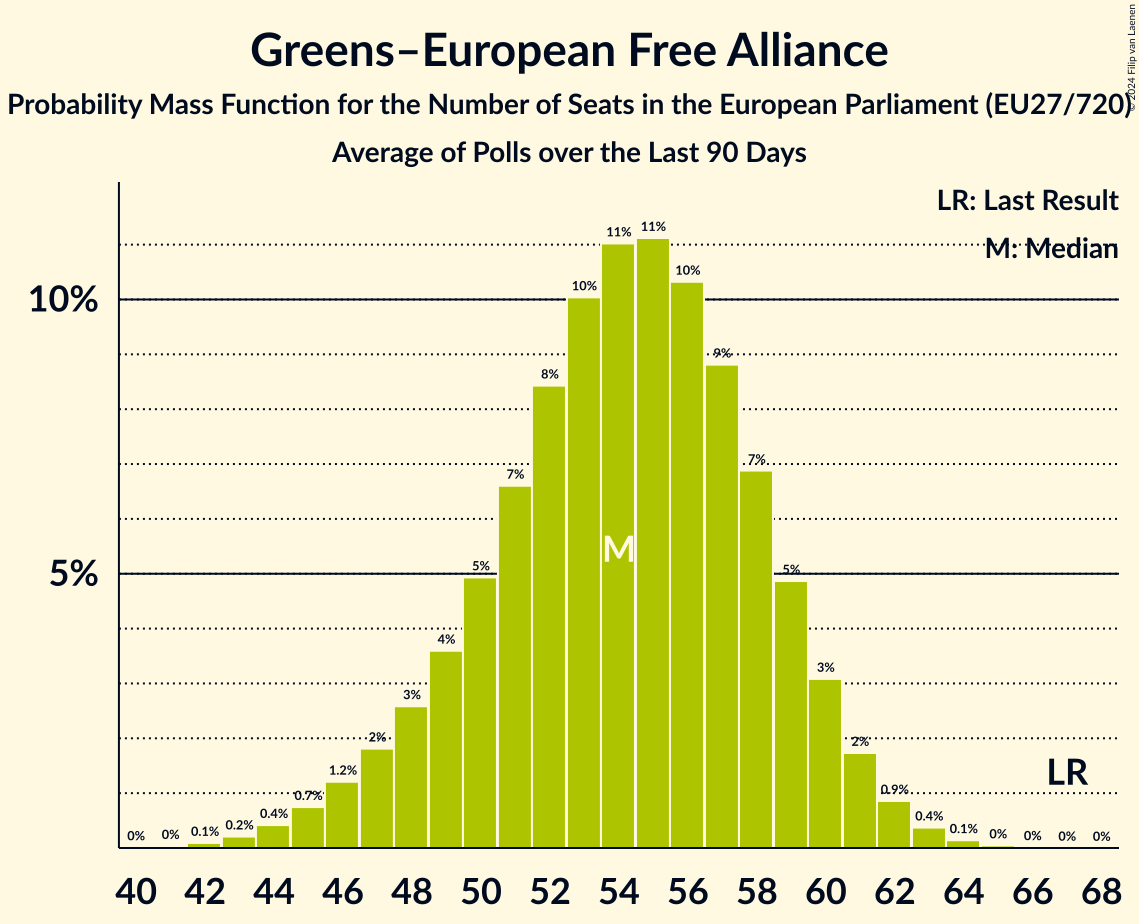
| Number of Seats | Probability | Accumulated | Special Marks |
|---|---|---|---|
| 27 | 0.2% | 100% | |
| 28 | 0.7% | 99.8% | |
| 29 | 2% | 99.1% | |
| 30 | 6% | 97% | |
| 31 | 11% | 91% | |
| 32 | 16% | 80% | |
| 33 | 19% | 64% | Median |
| 34 | 17% | 46% | |
| 35 | 13% | 28% | |
| 36 | 8% | 15% | |
| 37 | 4% | 7% | |
| 38 | 2% | 2% | |
| 39 | 0.5% | 0.7% | |
| 40 | 0.1% | 0.1% | |
| 41 | 0% | 0% | |
| 42 | 0% | 0% | |
| 43 | 0% | 0% | |
| 44 | 0% | 0% | |
| 45 | 0% | 0% | |
| 46 | 0% | 0% | |
| 47 | 0% | 0% | |
| 48 | 0% | 0% | |
| 49 | 0% | 0% | |
| 50 | 0% | 0% | |
| 51 | 0% | 0% | |
| 52 | 0% | 0% | |
| 53 | 0% | 0% | Last Result |
European United Left–Nordic Green Left
For a full overview of the results for this party, see the European United Left–Nordic Green Left page.
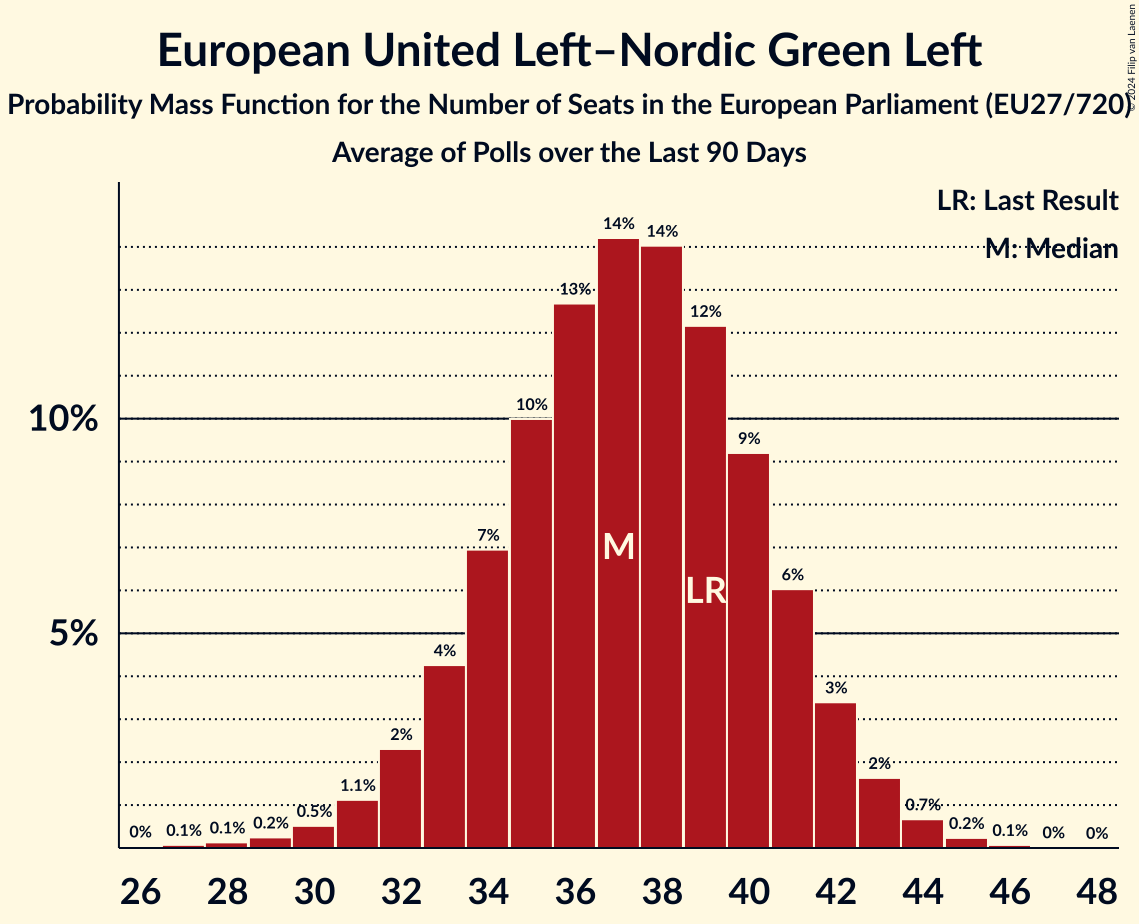
| Number of Seats | Probability | Accumulated | Special Marks |
|---|---|---|---|
| 33 | 0% | 100% | |
| 34 | 0.2% | 99.9% | |
| 35 | 0.5% | 99.8% | |
| 36 | 1.4% | 99.3% | |
| 37 | 3% | 98% | |
| 38 | 6% | 95% | |
| 39 | 10% | 89% | |
| 40 | 13% | 79% | |
| 41 | 16% | 65% | Median |
| 42 | 16% | 50% | |
| 43 | 13% | 34% | |
| 44 | 10% | 21% | |
| 45 | 6% | 11% | |
| 46 | 3% | 5% | Last Result |
| 47 | 1.4% | 2% | |
| 48 | 0.6% | 0.8% | |
| 49 | 0.2% | 0.3% | |
| 50 | 0.1% | 0.1% | |
| 51 | 0% | 0% |
Europe of Sovereign Nations
For a full overview of the results for this party, see the Europe of Sovereign Nations page.
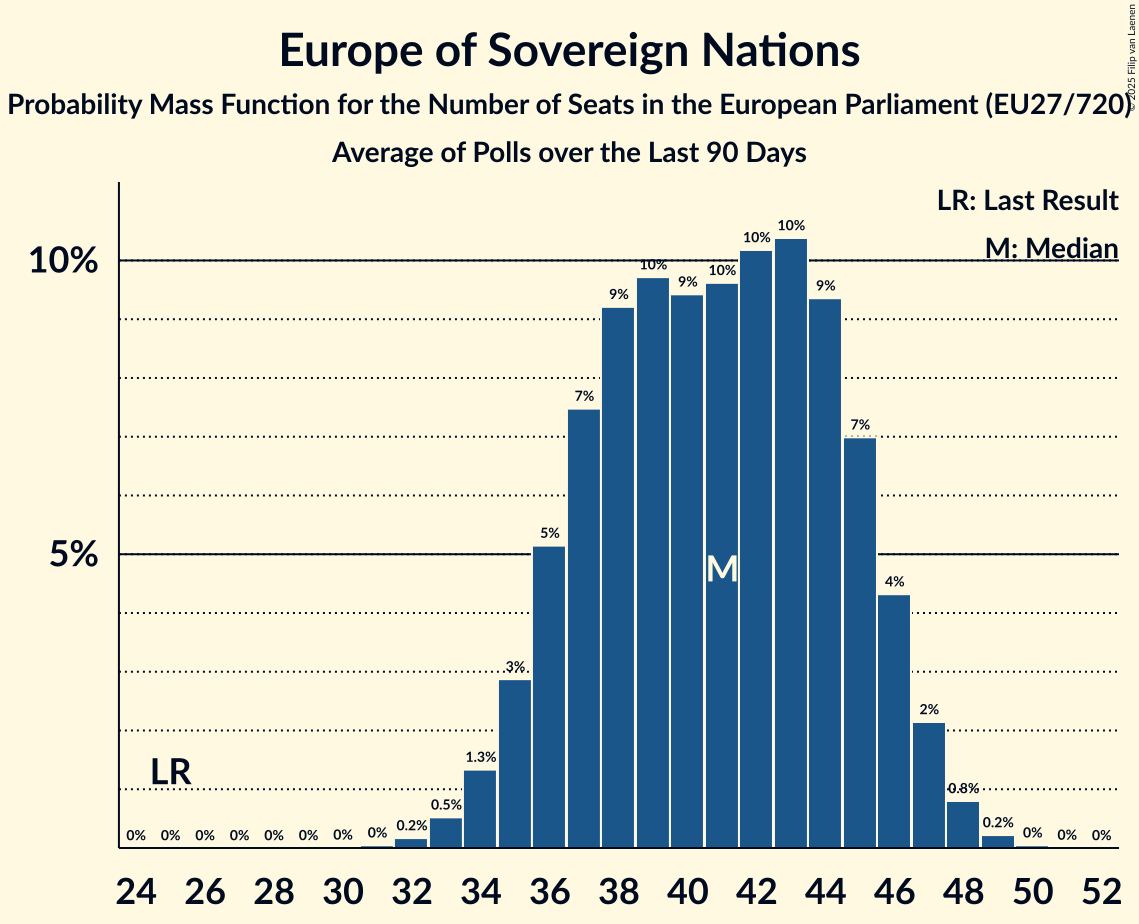
| Number of Seats | Probability | Accumulated | Special Marks |
|---|---|---|---|
| 25 | 0% | 100% | Last Result |
| 26 | 0% | 100% | |
| 27 | 0% | 100% | |
| 28 | 0% | 100% | |
| 29 | 0.2% | 100% | |
| 30 | 1.1% | 99.7% | |
| 31 | 3% | 98.7% | |
| 32 | 8% | 95% | |
| 33 | 14% | 87% | |
| 34 | 19% | 73% | |
| 35 | 20% | 53% | Median |
| 36 | 16% | 34% | |
| 37 | 10% | 18% | |
| 38 | 5% | 8% | |
| 39 | 2% | 3% | |
| 40 | 0.8% | 1.2% | |
| 41 | 0.3% | 0.4% | |
| 42 | 0.1% | 0.1% | |
| 43 | 0% | 0% |
Non-Inscrits
For a full overview of the results for this party, see the Non-Inscrits page.
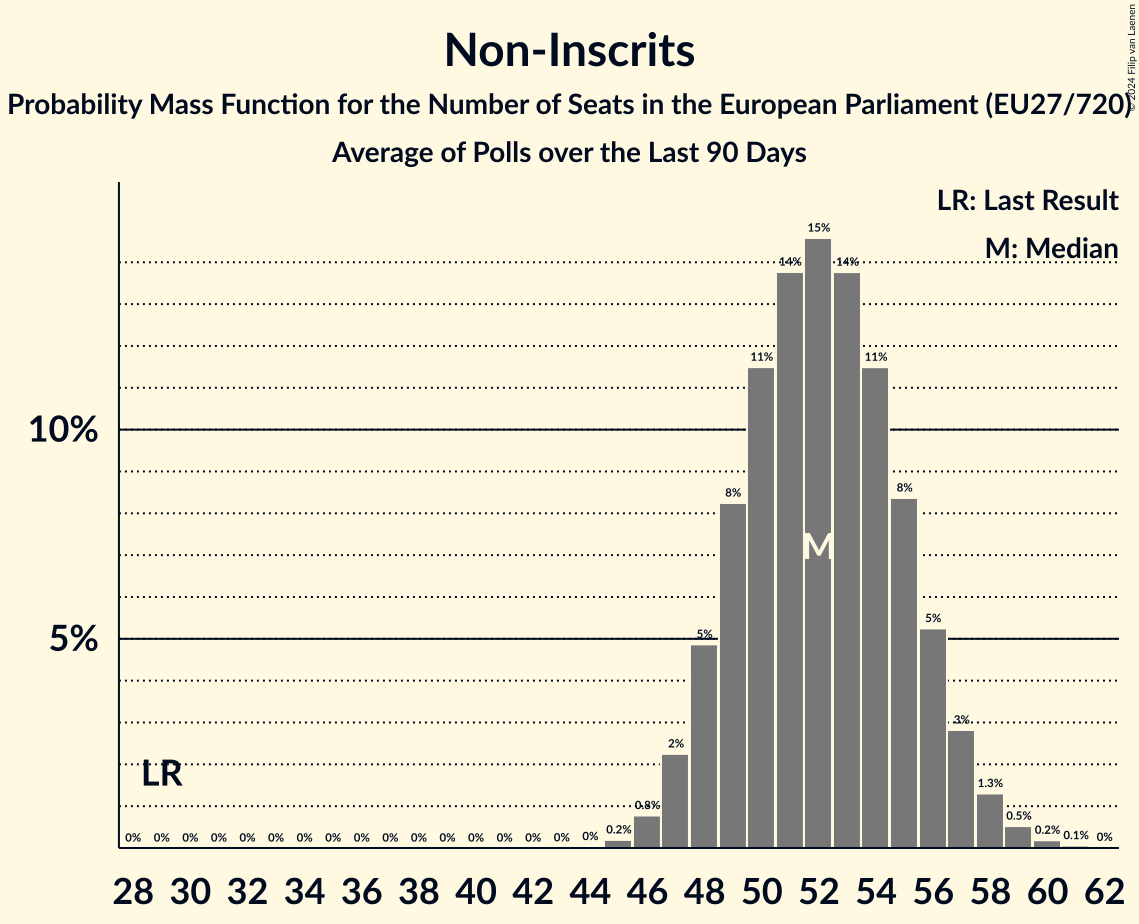
| Number of Seats | Probability | Accumulated | Special Marks |
|---|---|---|---|
| 16 | 0.1% | 100% | |
| 17 | 0.5% | 99.9% | |
| 18 | 2% | 99.3% | |
| 19 | 5% | 97% | |
| 20 | 10% | 92% | |
| 21 | 15% | 82% | |
| 22 | 18% | 67% | Median |
| 23 | 17% | 49% | |
| 24 | 13% | 31% | |
| 25 | 8% | 18% | |
| 26 | 5% | 10% | |
| 27 | 3% | 5% | |
| 28 | 1.5% | 3% | |
| 29 | 0.7% | 1.2% | |
| 30 | 0.3% | 0.5% | |
| 31 | 0.1% | 0.2% | |
| 32 | 0% | 0% | Last Result |
Parties currently not represented in the EP
For a full overview of the results for this party, see the Parties currently not represented in the EP page.
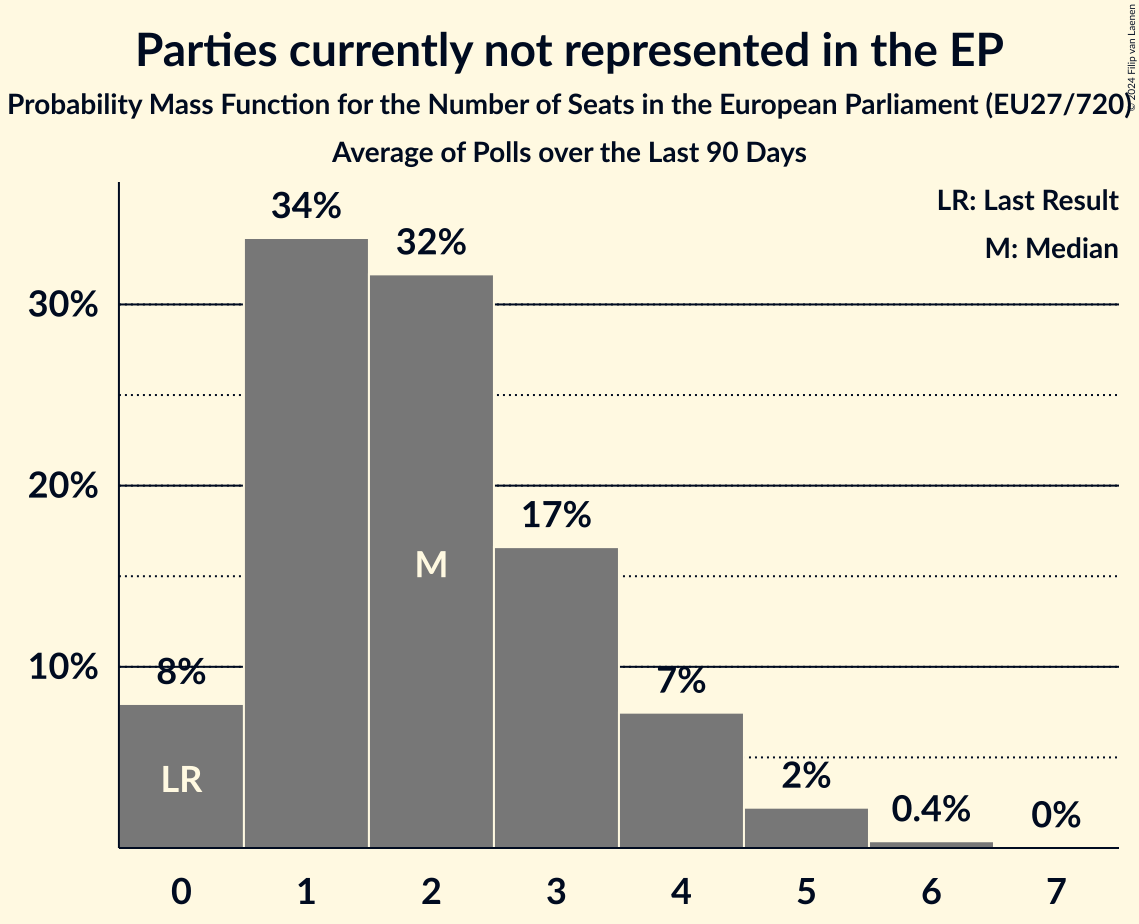
| Number of Seats | Probability | Accumulated | Special Marks |
|---|---|---|---|
| 1 | 0% | 100% | Last Result |
| 2 | 0% | 100% | |
| 3 | 0% | 100% | |
| 4 | 0% | 100% | |
| 5 | 0.1% | 100% | |
| 6 | 10% | 99.9% | |
| 7 | 39% | 90% | |
| 8 | 42% | 51% | Median |
| 9 | 8% | 9% | |
| 10 | 0.7% | 0.7% | |
| 11 | 0% | 0% |
Voting Intentions

Confidence Intervals
| Party | Last Result | Median | 80% Confidence Interval | 90% Confidence Interval | 95% Confidence Interval | 99% Confidence Interval |
|---|---|---|---|---|---|---|
| European People’s Party | 0.0% | N/A | N/A | N/A | N/A | N/A |
| Progressive Alliance of Socialists and Democrats | 0.0% | N/A | N/A | N/A | N/A | N/A |
| Patriots for Europe | 0.0% | N/A | N/A | N/A | N/A | N/A |
| European Conservatives and Reformists | 0.0% | N/A | N/A | N/A | N/A | N/A |
| Renew Europe | 0.0% | N/A | N/A | N/A | N/A | N/A |
| Greens–European Free Alliance | 0.0% | N/A | N/A | N/A | N/A | N/A |
| European United Left–Nordic Green Left | 0.0% | N/A | N/A | N/A | N/A | N/A |
| Europe of Sovereign Nations | 0.0% | N/A | N/A | N/A | N/A | N/A |
| Non-Inscrits | 0.0% | N/A | N/A | N/A | N/A | N/A |
| Parties currently not represented in the EP | 0.0% | N/A | N/A | N/A | N/A | N/A |
Technical Information
The seat and voting intentions projection for the European Parliament presented on this page was based on the averages of the most recent polls for the following countries:
| Country | No of Seats | No of Constituencies | Method | Threshold |
|---|---|---|---|---|
| Austria ⁰ | 19 | 1 | D’Hondt | 4% |
| Belgium: Flanders | 12 | 1 | D’Hondt | No |
| Belgium: French Community ⁰ | 8 | 1 | D’Hondt | No |
| Belgium: German-speaking constituency¹ | 1 | 1 | D’Hondt | No |
| Bulgaria | 17 | 1 | Hare-Niemeyer | 5% |
| Croatia ⁰ | 12 | 1 | D’Hondt | 5% |
| Cyprus ⁰ | 6 | 1 | Hare-Niemeyer | No |
| Czech Republic ⁰ | 21 | 1 | D’Hondt | 5% |
| Denmark | 14 | 1 | D’Hondt | No |
| Estonia | 7 | 1 | D’Hondt | No |
| Finland | 14 | 1 | D’Hondt | No |
| France ⁰ | 79 | 1 | D’Hondt | 5% |
| Germany | 96 | 1 | Sainte-Laguë | No |
| Greece | 21 | 1 | Droop | 3% |
| Hungary | 21 | 1 | D’Hondt | No |
| Ireland | 13 | 3 | Single transferable vote² | N/A |
| Italy ⁰ | 76 | 1 | Hare-Niemeyer | 4% |
| Latvia | 8 | 1 | Sainte-Laguë | 5% |
| Lithuania ⁰ | 11 | 1 | Hare–Niemeyer | 5% |
| Luxembourg | 6 | 1 | D’Hondt | No |
| Malta ⁰ | 6 | 1 | Single transferable vote² | N/A |
| Netherlands ⁰ | 29 | 1 | D’Hondt | 1/26 |
| Poland ⁰ | 52 | 1 | D’Hondt | 5% |
| Portugal | 21 | 1 | D’Hondt | No |
| Romania | 33 | 1 | D’Hondt | 5% |
| Slovakia | 14 | 1 | Hagenbach-Bischoff | 5% |
| Slovenia | 8 | 1 | D’Hondt | 5% |
| Spain | 59 | 1 | D’Hondt | No |
| Sweden | 21 | 1 | Modified Sainte-Laguë | 4% |
| Total | 705 | 31 |
¹ No new opinion polls reported since the last European election; the results from the last European election are therefore used in the current projection for the European election.
² Implemented as D’Hondt.