Patriots for Europe
Members registered from 14 countries:
AT, CZ, DK, EE, ES, FR, GR, HU, IT, LT, NL, PT, SI, SK
Seats
Last result: 84 seats (General Election of 26 May 2019)
Current median: 90 seats (+6 seats)
At least one member in 12 countries have a median of 1 seat or more:
AT, CZ, DK, EE, ES, FR, GR, HU, IT, LT, NL, PT
Confidence Intervals
| Party | Area | Last Result | Median | 80% Confidence Interval | 90% Confidence Interval | 95% Confidence Interval | 99% Confidence Interval |
|---|---|---|---|---|---|---|---|
| Patriots for Europe | EU | 84 | 90 | 85–94 | 84–95 | 83–96 | 80–98 |
| Rassemblement national | FR | 32 | 28–35 | 27–35 | 27–36 | 27–37 | |
| Vox | ES | 13 | 12–14 | 11–14 | 11–15 | 10–15 | |
| ANO 2011 | CZ | 9 | 8–10 | 8–10 | 8–10 | 7–10 | |
| Freiheitliche Partei Österreichs | AT | 9 | 8–9 | 8–10 | 8–10 | 7–10 | |
| Chega | PT | 7 | 5–8 | 5–8 | 5–8 | 5–9 | |
| Fidesz–Kereszténydemokrata Néppárt | HU | 6 | 5–6 | 5–6 | 5–6 | 5–6 | |
| Lega Nord | IT | 5 | 4–6 | 3–7 | 0–7 | 0–8 | |
| Partij voor de Vrijheid | NL | 5 | 4–5 | 4–5 | 4–5 | 4–6 | |
| Dansk Folkeparti | DK | 2 | 2 | 2 | 2–3 | 2–3 | |
| Nemuno aušra | LT | 2 | 1–2 | 1–2 | 1–2 | 1–2 | |
| Eesti Konservatiivne Rahvaerakond | EE | 1 | 1 | 1–2 | 1–2 | 1–2 | |
| Φωνή Λογικής | GR | 1 | 0–1 | 0–1 | 0–1 | 0–1 | |
| Motoristé sobě | CZ | 0 | 0–1 | 0–1 | 0–1 | 0–2 | |
| Přísaha | CZ | 0 | 0 | 0 | 0 | 0 | |
| SME RODINA | SK | 0 | 0 | 0 | 0 | 0 | |
| Slovenska nacionalna stranka | SI | 0 | 0 | 0 | 0 | 0 | |
| Slovenská národná strana | SK | 0 | 0 | 0 | 0–1 | 0–1 |
Probability Mass Function
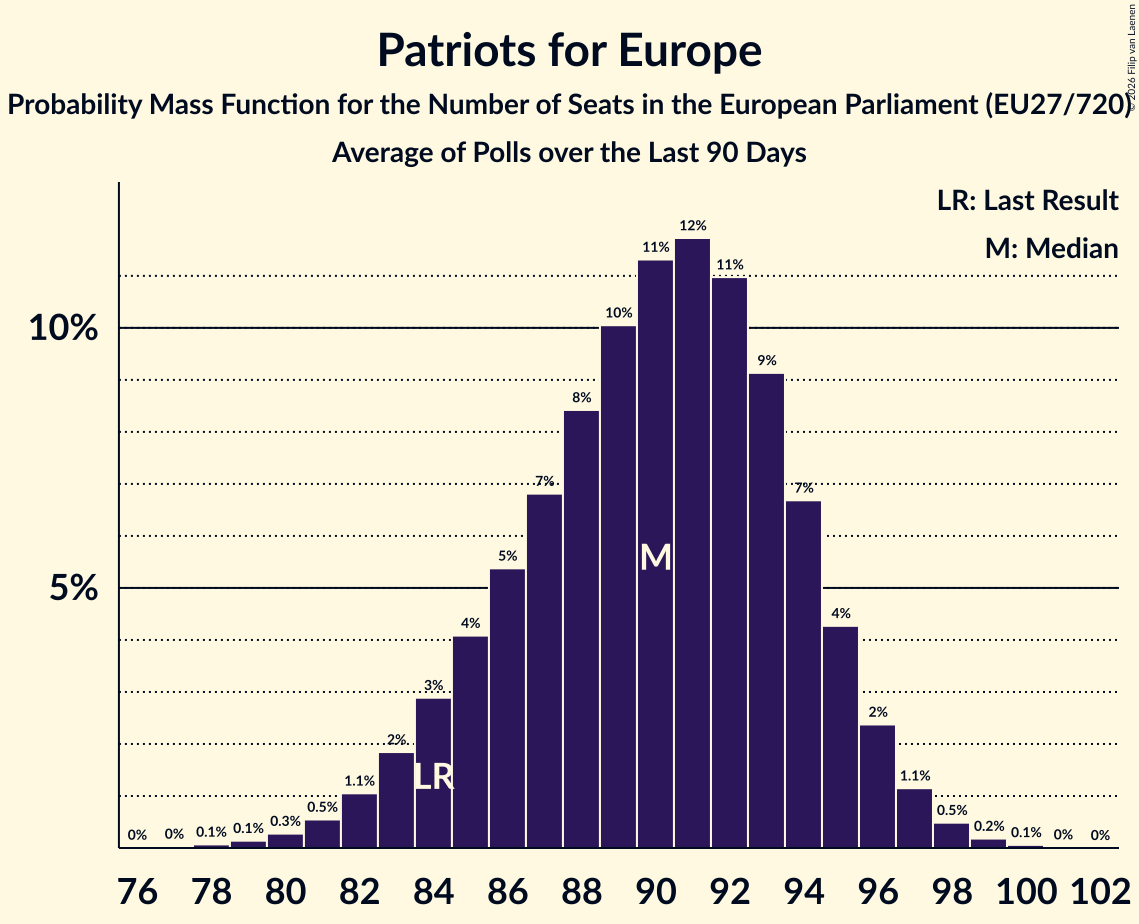
The following table shows the probability mass function per seat for the poll average for Patriots for Europe.
| Number of Seats | Probability | Accumulated | Special Marks |
|---|---|---|---|
| 78 | 0.1% | 100% | |
| 79 | 0.1% | 99.9% | |
| 80 | 0.3% | 99.7% | |
| 81 | 0.5% | 99.5% | |
| 82 | 1.1% | 98.9% | |
| 83 | 2% | 98% | |
| 84 | 3% | 96% | Last Result |
| 85 | 4% | 93% | |
| 86 | 5% | 89% | |
| 87 | 7% | 84% | |
| 88 | 8% | 77% | |
| 89 | 10% | 68% | |
| 90 | 11% | 58% | Median |
| 91 | 12% | 47% | |
| 92 | 11% | 35% | |
| 93 | 9% | 24% | |
| 94 | 7% | 15% | |
| 95 | 4% | 9% | |
| 96 | 2% | 4% | |
| 97 | 1.1% | 2% | |
| 98 | 0.5% | 0.8% | |
| 99 | 0.2% | 0.3% | |
| 100 | 0.1% | 0.1% | |
| 101 | 0% | 0% |