Progressive Alliance of Socialists and Democrats
Members registered from 21 countries:
AT, BG, CY, CZ, DE, DK, EE, ES, FI, GR, HR, HU, IE, IT, LT, MT, NL, PL, RO, SE, SI
Seats
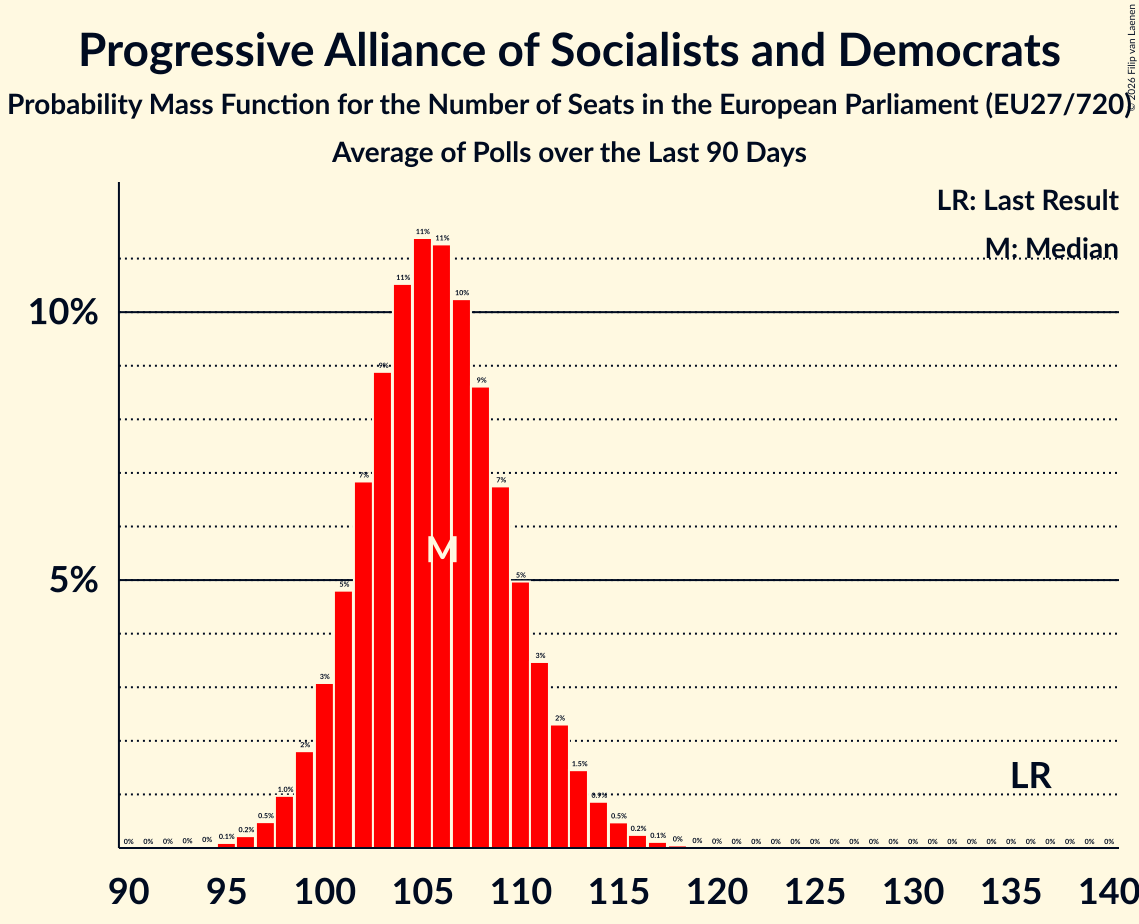
Last result: 136 seats (General Election of 26 May 2019)
Current median: 106 seats (-30 seats)
At least one member in 18 countries have a median of 1 seat or more:
AT, CY, DE, DK, EE, ES, FI, GR, HR, IE, IT, LT, MT, NL, PL, RO, SE, SI
Confidence Intervals
| Party | Area | Last Result | Median | 80% Confidence Interval | 90% Confidence Interval | 95% Confidence Interval | 99% Confidence Interval |
|---|---|---|---|---|---|---|---|
| Progressive Alliance of Socialists and Democrats | EU | 136 | 106 | 101–110 | 100–112 | 99–113 | 97–115 |
| Partito Democratico | IT | 19 | 17–21 | 17–22 | 16–22 | 15–22 | |
| Partido Socialista Obrero Español | ES | 18 | 17–22 | 17–23 | 16–24 | 15–24 | |
| Sozialdemokratische Partei Deutschlands | DE | 14 | 13–16 | 12–16 | 12–16 | 12–17 | |
| Partidul Social Democrat | RO | 8 | 7–9 | 6–10 | 6–10 | 6–10 | |
| Sveriges socialdemokratiska arbetareparti | SE | 8 | 7–8 | 7–8 | 7–8 | 7–8 | |
| Suomen Sosialidemokraattinen Puolue | FI | 5 | 4–5 | 4–5 | 4–5 | 4–5 | |
| Nowa Lewica | PL | 4 | 3–5 | 3–6 | 3–6 | 0–6 | |
| Socialdemokraterne | DK | 4 | 4–5 | 4–5 | 3–5 | 3–5 | |
| Socijaldemokratska partija Hrvatske | HR | 4 | 3–4 | 3–4 | 3–4 | 3–5 | |
| Sozialdemokratische Partei Österreichs | AT | 4 | 3–4 | 3–5 | 3–5 | 3–5 | |
| Partij van de Arbeid | NL | 3 | 2–3 | 2–3 | 2–3 | 2–3 | |
| Partit Laburista | MT | 3 | 3 | 3 | 3 | 3–4 | |
| Κίνημα Αλλαγής | GR | 3 | 2–3 | 2–3 | 2–3 | 2–4 | |
| Lietuvos socialdemokratų partija | LT | 2 | 1–2 | 1–2 | 1–2 | 1–3 | |
| Nemuno aušra | LT | 2 | 1–2 | 1–2 | 1–2 | 1–2 | |
| Social Democrats | IE | 2 | 1–3 | 0–3 | 0–3 | 0–3 | |
| Socialni demokrati | SI | 1 | 0–1 | 0–1 | 0–1 | 0–1 | |
| Sotsiaaldemokraatlik Erakond | EE | 1 | 1 | 1 | 1 | 1 | |
| Δημοκρατικό Κόμμα | CY | 1 | 0–1 | 0–1 | 0–1 | 0–1 | |
| Demokratikus Koalíció | HU | 0 | 0–1 | 0–1 | 0–1 | 0–1 | |
| Labour Party | IE | 0 | 0–1 | 0–1 | 0–1 | 0–1 | |
| Sociální demokracie | CZ | 0 | 0 | 0 | 0 | 0 | |
| Κίνημα Σοσιαλδημοκρατών | CY | 0 | 0 | 0 | 0 | 0 | |
| БСП – обединена левица | BG | 0 | 0 | 0 | 0 | 0 |
Probability Mass Function

The following table shows the probability mass function per seat for the poll average for Progressive Alliance of Socialists and Democrats.
| Number of Seats | Probability | Accumulated | Special Marks |
|---|---|---|---|
| 94 | 0% | 100% | |
| 95 | 0.1% | 99.9% | |
| 96 | 0.2% | 99.8% | |
| 97 | 0.5% | 99.6% | |
| 98 | 1.0% | 99.1% | |
| 99 | 2% | 98% | |
| 100 | 3% | 96% | |
| 101 | 5% | 93% | |
| 102 | 7% | 88% | |
| 103 | 9% | 82% | |
| 104 | 11% | 73% | |
| 105 | 11% | 62% | |
| 106 | 11% | 51% | Median |
| 107 | 10% | 40% | |
| 108 | 9% | 29% | |
| 109 | 7% | 21% | |
| 110 | 5% | 14% | |
| 111 | 3% | 9% | |
| 112 | 2% | 6% | |
| 113 | 1.5% | 3% | |
| 114 | 0.9% | 2% | |
| 115 | 0.5% | 0.9% | |
| 116 | 0.2% | 0.4% | |
| 117 | 0.1% | 0.2% | |
| 118 | 0% | 0.1% | |
| 119 | 0% | 0% | |
| 120 | 0% | 0% | |
| 121 | 0% | 0% | |
| 122 | 0% | 0% | |
| 123 | 0% | 0% | |
| 124 | 0% | 0% | |
| 125 | 0% | 0% | |
| 126 | 0% | 0% | |
| 127 | 0% | 0% | |
| 128 | 0% | 0% | |
| 129 | 0% | 0% | |
| 130 | 0% | 0% | |
| 131 | 0% | 0% | |
| 132 | 0% | 0% | |
| 133 | 0% | 0% | |
| 134 | 0% | 0% | |
| 135 | 0% | 0% | |
| 136 | 0% | 0% | Last Result |