Opinion Poll by Social Changes, 26–30 April 2019
Voting Intentions | Seats | Coalitions | Technical Information
Voting Intentions
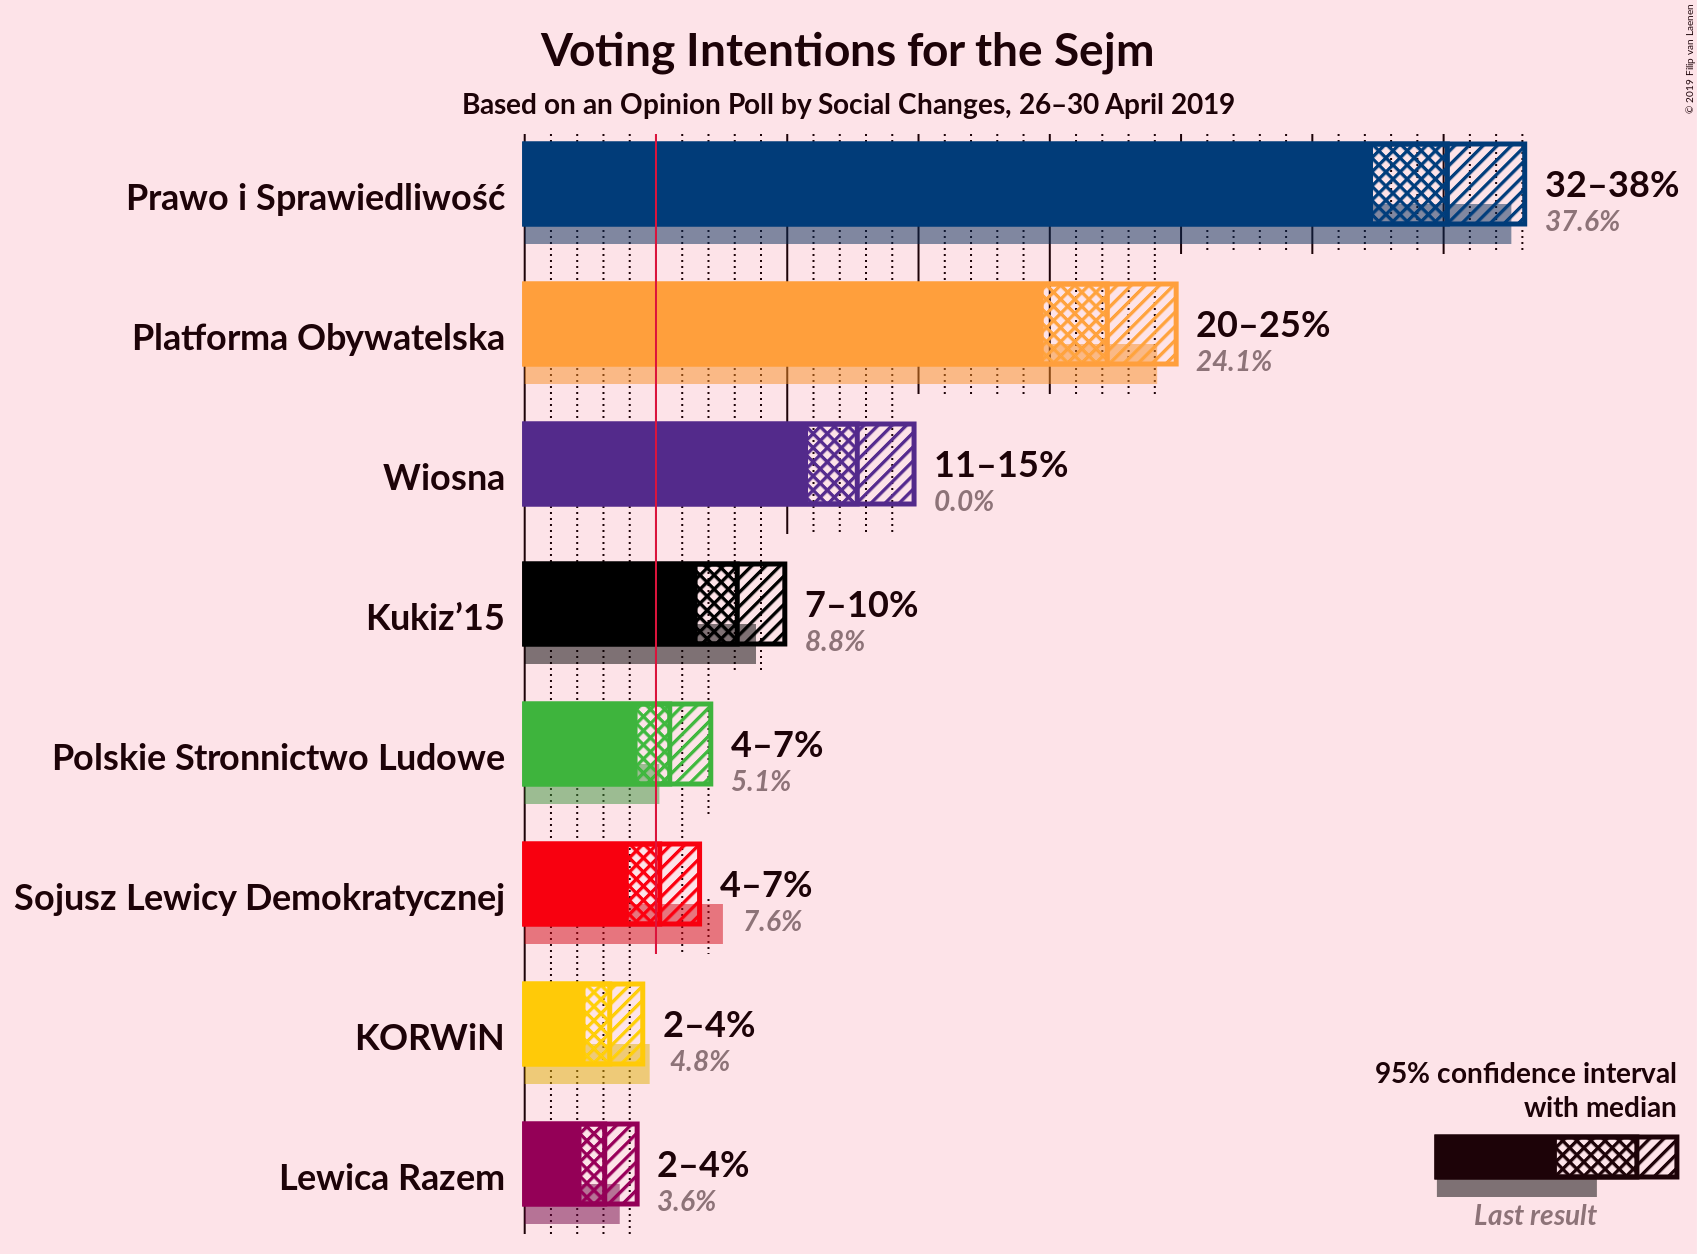
Confidence Intervals
| Party | Last Result | Poll Result | 80% Confidence Interval | 90% Confidence Interval | 95% Confidence Interval | 99% Confidence Interval |
|---|---|---|---|---|---|---|
| Prawo i Sprawiedliwość | 37.6% | 35.1% | 33.3–37.1% | 32.8–37.6% | 32.3–38.1% | 31.4–39.0% |
| Platforma Obywatelska | 24.1% | 22.2% | 20.6–23.9% | 20.2–24.4% | 19.8–24.8% | 19.0–25.7% |
| Wiosna | 0.0% | 12.7% | 11.4–14.1% | 11.1–14.5% | 10.8–14.8% | 10.2–15.5% |
| Kukiz’15 | 8.8% | 8.1% | 7.1–9.3% | 6.8–9.6% | 6.6–9.9% | 6.1–10.5% |
| Polskie Stronnictwo Ludowe | 5.1% | 5.5% | 4.7–6.5% | 4.5–6.8% | 4.3–7.1% | 3.9–7.6% |
| Sojusz Lewicy Demokratycznej | 7.6% | 5.1% | 4.4–6.1% | 4.1–6.4% | 4.0–6.7% | 3.6–7.2% |
| KORWiN | 4.8% | 3.2% | 2.6–4.1% | 2.5–4.3% | 2.3–4.5% | 2.1–4.9% |
| Lewica Razem | 3.6% | 3.0% | 2.5–3.9% | 2.3–4.1% | 2.2–4.3% | 1.9–4.7% |
Note: The poll result column reflects the actual value used in the calculations. Published results may vary slightly, and in addition be rounded to fewer digits.
Seats
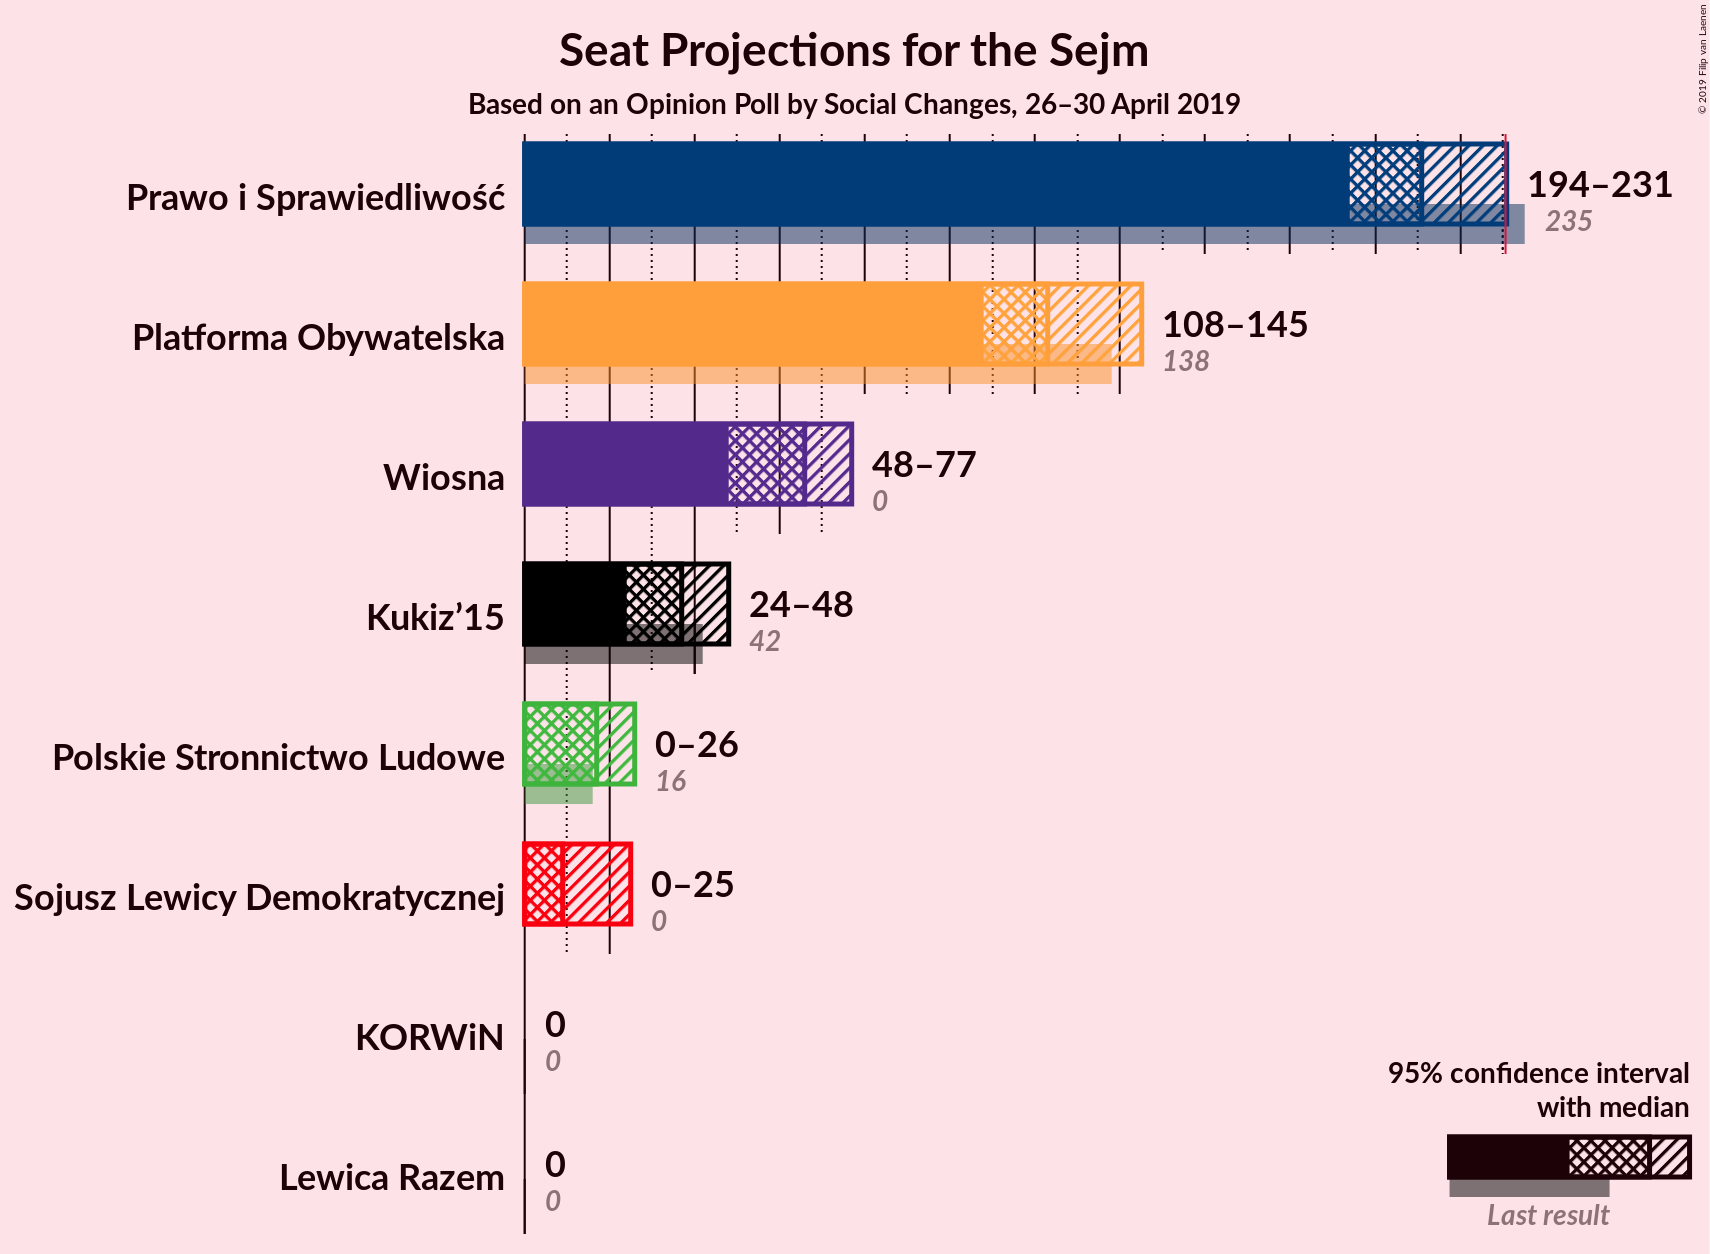
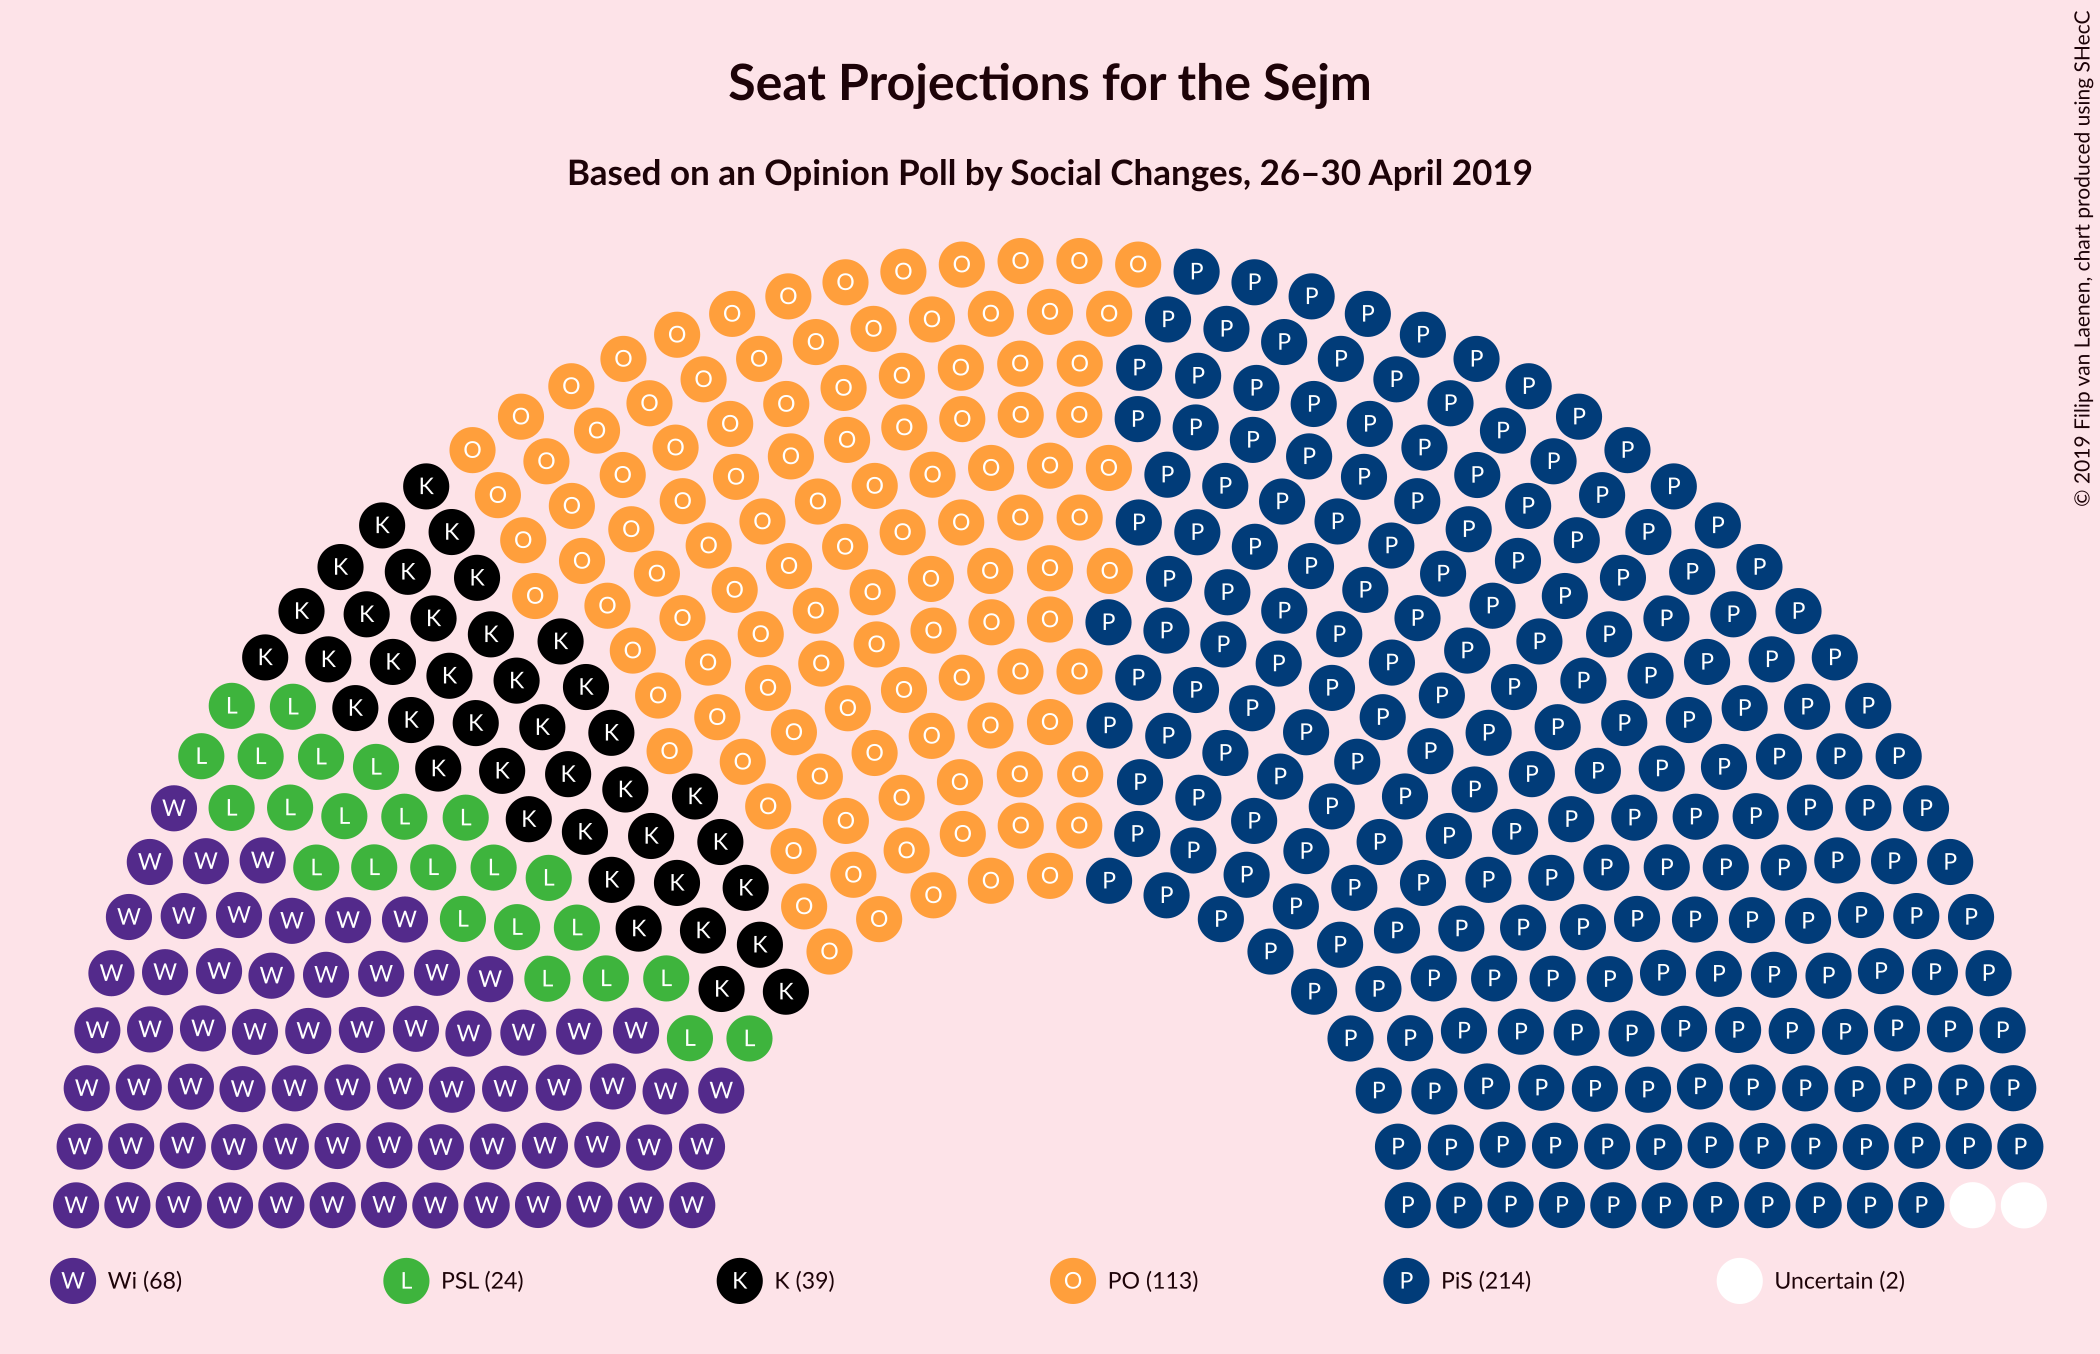
Confidence Intervals
| Party | Last Result | Median | 80% Confidence Interval | 90% Confidence Interval | 95% Confidence Interval | 99% Confidence Interval |
|---|---|---|---|---|---|---|
| Prawo i Sprawiedliwość | 235 | 211 | 199–222 | 196–228 | 194–231 | 188–238 |
| Platforma Obywatelska | 138 | 123 | 113–135 | 110–140 | 108–145 | 102–150 |
| Wiosna | 0 | 66 | 54–74 | 50–76 | 48–77 | 44–80 |
| Kukiz’15 | 42 | 37 | 30–45 | 27–48 | 24–48 | 17–51 |
| Polskie Stronnictwo Ludowe | 16 | 17 | 0–26 | 0–26 | 0–26 | 0–29 |
| Sojusz Lewicy Demokratycznej | 0 | 9 | 0–22 | 0–24 | 0–25 | 0–29 |
| KORWiN | 0 | 0 | 0 | 0 | 0 | 0 |
| Lewica Razem | 0 | 0 | 0 | 0 | 0 | 0 |
Prawo i Sprawiedliwość
For a full overview of the results for this party, see the Prawo i Sprawiedliwość page.
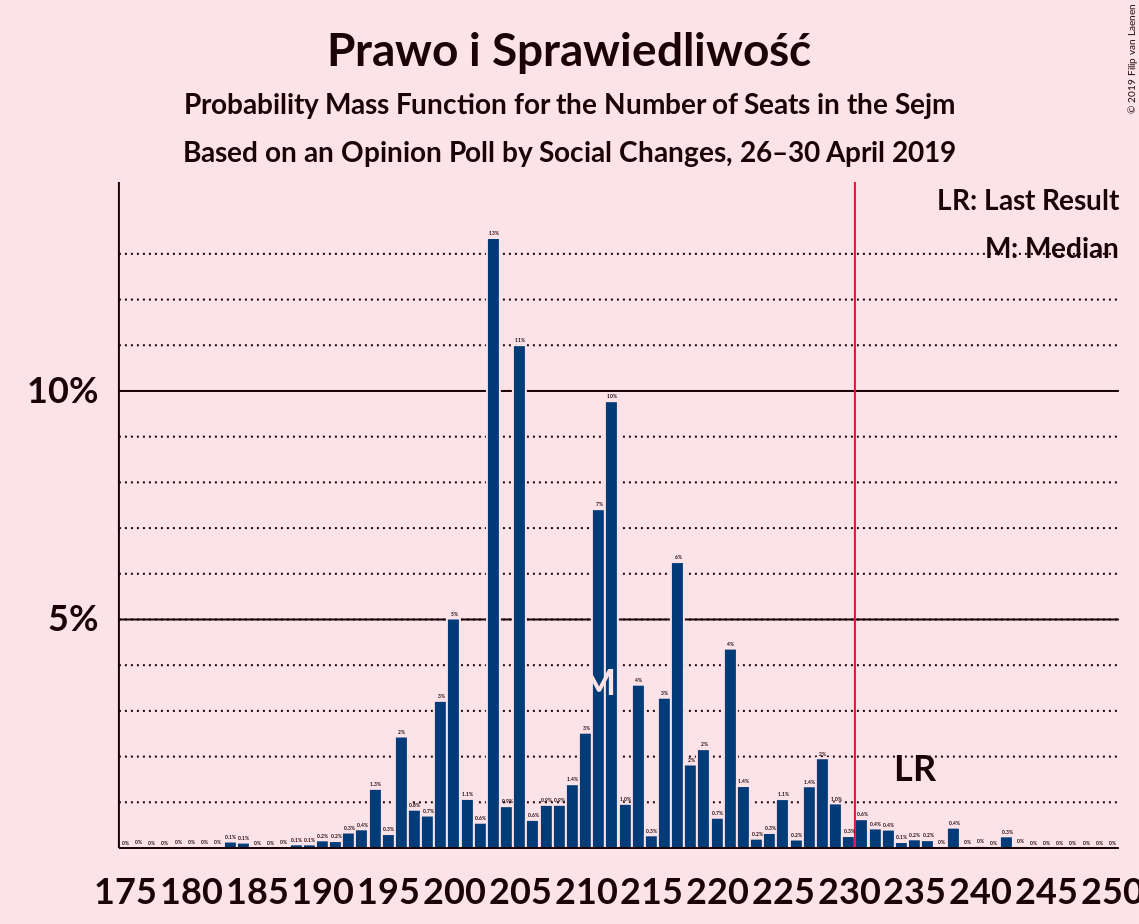
| Number of Seats | Probability | Accumulated | Special Marks |
|---|---|---|---|
| 178 | 0% | 100% | |
| 179 | 0% | 99.9% | |
| 180 | 0% | 99.9% | |
| 181 | 0% | 99.9% | |
| 182 | 0% | 99.9% | |
| 183 | 0.1% | 99.8% | |
| 184 | 0.1% | 99.7% | |
| 185 | 0% | 99.6% | |
| 186 | 0% | 99.6% | |
| 187 | 0% | 99.6% | |
| 188 | 0.1% | 99.5% | |
| 189 | 0.1% | 99.4% | |
| 190 | 0.2% | 99.4% | |
| 191 | 0.2% | 99.2% | |
| 192 | 0.3% | 99.0% | |
| 193 | 0.4% | 98.7% | |
| 194 | 1.3% | 98% | |
| 195 | 0.3% | 97% | |
| 196 | 2% | 97% | |
| 197 | 0.8% | 94% | |
| 198 | 0.7% | 93% | |
| 199 | 3% | 93% | |
| 200 | 5% | 89% | |
| 201 | 1.1% | 84% | |
| 202 | 0.6% | 83% | |
| 203 | 13% | 83% | |
| 204 | 0.9% | 69% | |
| 205 | 11% | 69% | |
| 206 | 0.6% | 58% | |
| 207 | 0.9% | 57% | |
| 208 | 0.9% | 56% | |
| 209 | 1.4% | 55% | |
| 210 | 3% | 54% | |
| 211 | 7% | 51% | Median |
| 212 | 10% | 44% | |
| 213 | 1.0% | 34% | |
| 214 | 4% | 33% | |
| 215 | 0.3% | 29% | |
| 216 | 3% | 29% | |
| 217 | 6% | 26% | |
| 218 | 2% | 20% | |
| 219 | 2% | 18% | |
| 220 | 0.7% | 16% | |
| 221 | 4% | 15% | |
| 222 | 1.4% | 11% | |
| 223 | 0.2% | 9% | |
| 224 | 0.3% | 9% | |
| 225 | 1.1% | 9% | |
| 226 | 0.2% | 8% | |
| 227 | 1.4% | 7% | |
| 228 | 2% | 6% | |
| 229 | 1.0% | 4% | |
| 230 | 0.3% | 3% | |
| 231 | 0.6% | 3% | Majority |
| 232 | 0.4% | 2% | |
| 233 | 0.4% | 2% | |
| 234 | 0.1% | 1.4% | |
| 235 | 0.2% | 1.3% | Last Result |
| 236 | 0.2% | 1.1% | |
| 237 | 0% | 0.9% | |
| 238 | 0.4% | 0.9% | |
| 239 | 0% | 0.5% | |
| 240 | 0% | 0.4% | |
| 241 | 0% | 0.4% | |
| 242 | 0.3% | 0.4% | |
| 243 | 0% | 0.1% | |
| 244 | 0% | 0.1% | |
| 245 | 0% | 0.1% | |
| 246 | 0% | 0.1% | |
| 247 | 0% | 0.1% | |
| 248 | 0% | 0.1% | |
| 249 | 0% | 0% |
Platforma Obywatelska
For a full overview of the results for this party, see the Platforma Obywatelska page.
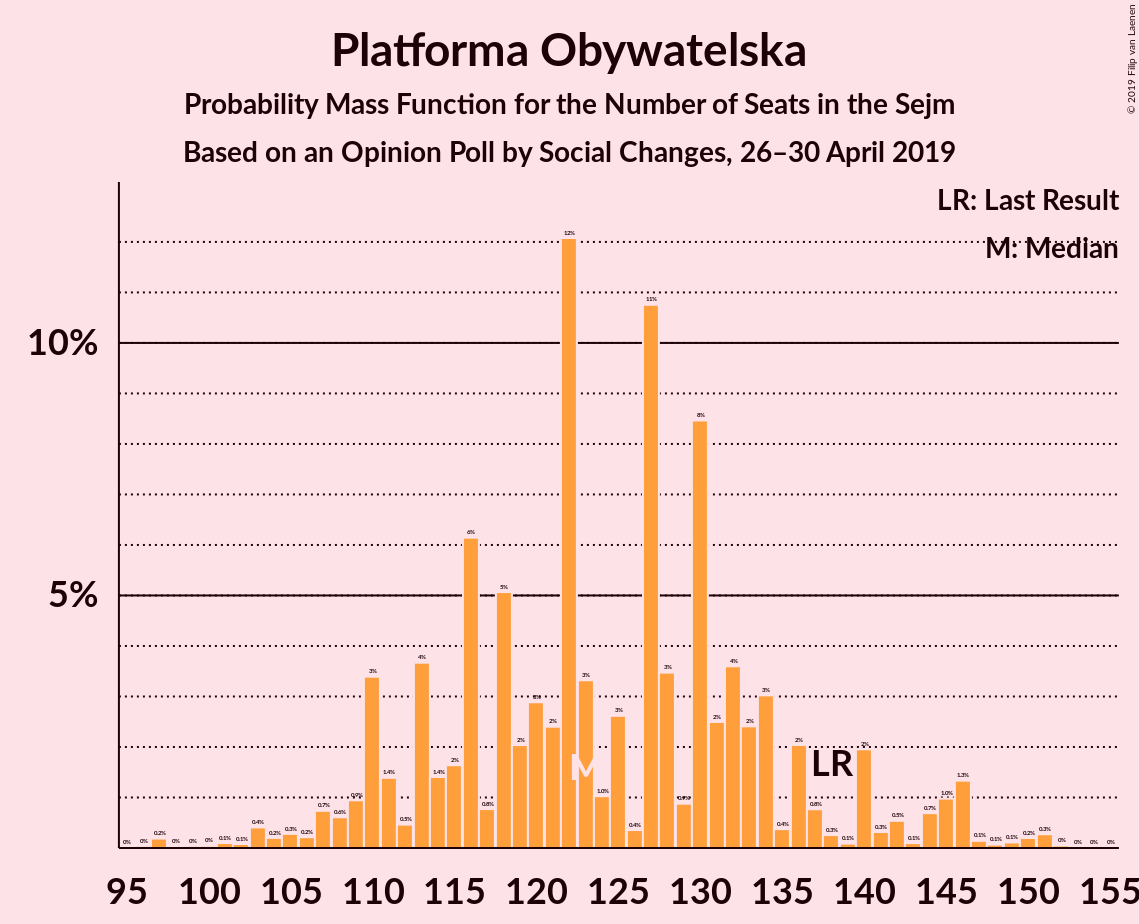
| Number of Seats | Probability | Accumulated | Special Marks |
|---|---|---|---|
| 96 | 0% | 100% | |
| 97 | 0.2% | 99.9% | |
| 98 | 0% | 99.7% | |
| 99 | 0% | 99.7% | |
| 100 | 0% | 99.7% | |
| 101 | 0.1% | 99.6% | |
| 102 | 0.1% | 99.5% | |
| 103 | 0.4% | 99.5% | |
| 104 | 0.2% | 99.1% | |
| 105 | 0.3% | 98.9% | |
| 106 | 0.2% | 98.6% | |
| 107 | 0.7% | 98% | |
| 108 | 0.6% | 98% | |
| 109 | 0.9% | 97% | |
| 110 | 3% | 96% | |
| 111 | 1.4% | 93% | |
| 112 | 0.5% | 91% | |
| 113 | 4% | 91% | |
| 114 | 1.4% | 87% | |
| 115 | 2% | 86% | |
| 116 | 6% | 84% | |
| 117 | 0.8% | 78% | |
| 118 | 5% | 77% | |
| 119 | 2% | 72% | |
| 120 | 3% | 70% | |
| 121 | 2% | 67% | |
| 122 | 12% | 65% | |
| 123 | 3% | 53% | Median |
| 124 | 1.0% | 49% | |
| 125 | 3% | 48% | |
| 126 | 0.4% | 46% | |
| 127 | 11% | 45% | |
| 128 | 3% | 35% | |
| 129 | 0.9% | 31% | |
| 130 | 8% | 30% | |
| 131 | 2% | 22% | |
| 132 | 4% | 19% | |
| 133 | 2% | 16% | |
| 134 | 3% | 13% | |
| 135 | 0.4% | 10% | |
| 136 | 2% | 10% | |
| 137 | 0.8% | 8% | |
| 138 | 0.3% | 7% | Last Result |
| 139 | 0.1% | 7% | |
| 140 | 2% | 7% | |
| 141 | 0.3% | 5% | |
| 142 | 0.5% | 5% | |
| 143 | 0.1% | 4% | |
| 144 | 0.7% | 4% | |
| 145 | 1.0% | 3% | |
| 146 | 1.3% | 2% | |
| 147 | 0.1% | 0.9% | |
| 148 | 0.1% | 0.7% | |
| 149 | 0.1% | 0.7% | |
| 150 | 0.2% | 0.6% | |
| 151 | 0.3% | 0.4% | |
| 152 | 0% | 0.1% | |
| 153 | 0% | 0% |
Wiosna
For a full overview of the results for this party, see the Wiosna page.
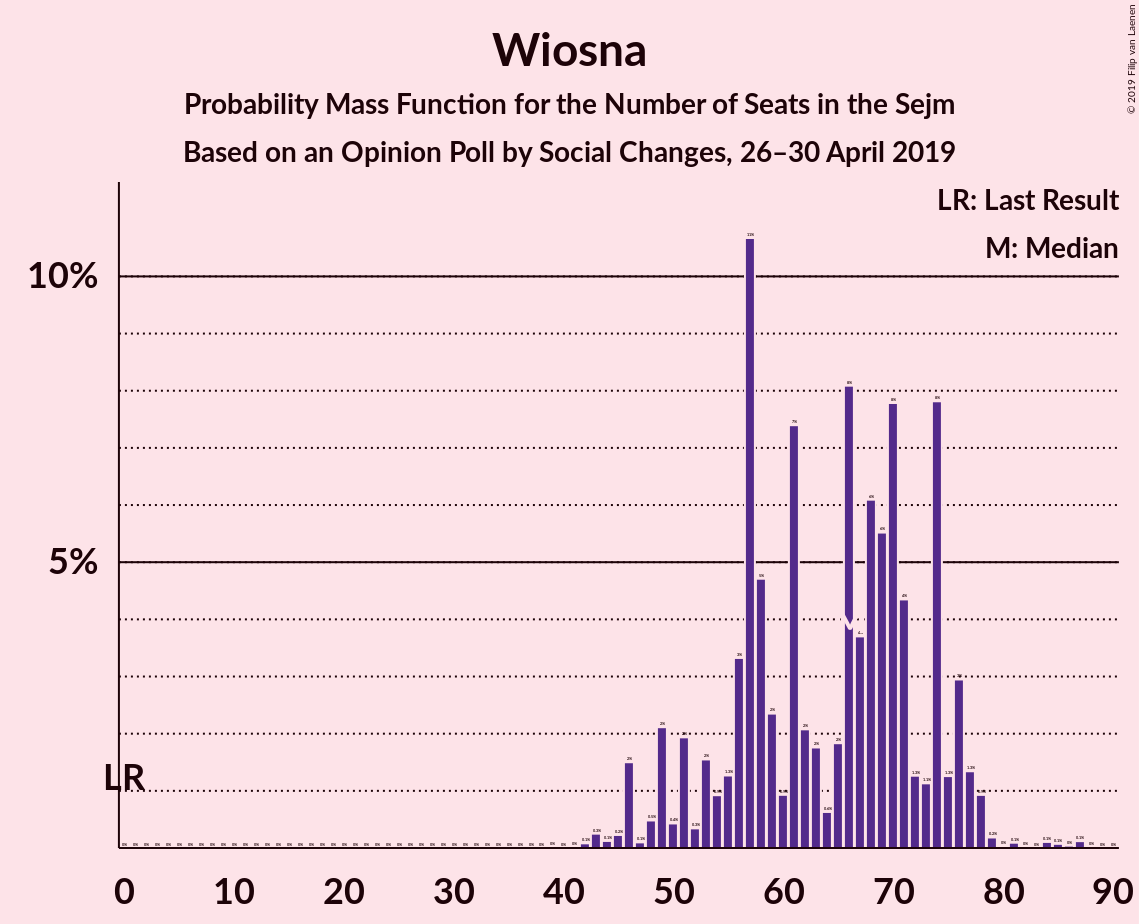
| Number of Seats | Probability | Accumulated | Special Marks |
|---|---|---|---|
| 0 | 0% | 100% | Last Result |
| 1 | 0% | 100% | |
| 2 | 0% | 100% | |
| 3 | 0% | 100% | |
| 4 | 0% | 100% | |
| 5 | 0% | 100% | |
| 6 | 0% | 100% | |
| 7 | 0% | 100% | |
| 8 | 0% | 100% | |
| 9 | 0% | 100% | |
| 10 | 0% | 100% | |
| 11 | 0% | 100% | |
| 12 | 0% | 100% | |
| 13 | 0% | 100% | |
| 14 | 0% | 100% | |
| 15 | 0% | 100% | |
| 16 | 0% | 100% | |
| 17 | 0% | 100% | |
| 18 | 0% | 100% | |
| 19 | 0% | 100% | |
| 20 | 0% | 100% | |
| 21 | 0% | 100% | |
| 22 | 0% | 100% | |
| 23 | 0% | 100% | |
| 24 | 0% | 100% | |
| 25 | 0% | 100% | |
| 26 | 0% | 100% | |
| 27 | 0% | 100% | |
| 28 | 0% | 100% | |
| 29 | 0% | 100% | |
| 30 | 0% | 100% | |
| 31 | 0% | 100% | |
| 32 | 0% | 100% | |
| 33 | 0% | 100% | |
| 34 | 0% | 100% | |
| 35 | 0% | 100% | |
| 36 | 0% | 100% | |
| 37 | 0% | 100% | |
| 38 | 0% | 100% | |
| 39 | 0% | 100% | |
| 40 | 0% | 100% | |
| 41 | 0% | 100% | |
| 42 | 0.1% | 99.9% | |
| 43 | 0.3% | 99.9% | |
| 44 | 0.1% | 99.6% | |
| 45 | 0.2% | 99.5% | |
| 46 | 2% | 99.3% | |
| 47 | 0.1% | 98% | |
| 48 | 0.5% | 98% | |
| 49 | 2% | 97% | |
| 50 | 0.4% | 95% | |
| 51 | 2% | 95% | |
| 52 | 0.3% | 93% | |
| 53 | 2% | 92% | |
| 54 | 0.9% | 91% | |
| 55 | 1.3% | 90% | |
| 56 | 3% | 89% | |
| 57 | 11% | 85% | |
| 58 | 5% | 75% | |
| 59 | 2% | 70% | |
| 60 | 0.9% | 68% | |
| 61 | 7% | 67% | |
| 62 | 2% | 59% | |
| 63 | 2% | 57% | |
| 64 | 0.6% | 55% | |
| 65 | 2% | 55% | |
| 66 | 8% | 53% | Median |
| 67 | 4% | 45% | |
| 68 | 6% | 41% | |
| 69 | 6% | 35% | |
| 70 | 8% | 30% | |
| 71 | 4% | 22% | |
| 72 | 1.3% | 17% | |
| 73 | 1.1% | 16% | |
| 74 | 8% | 15% | |
| 75 | 1.3% | 7% | |
| 76 | 3% | 6% | |
| 77 | 1.3% | 3% | |
| 78 | 0.9% | 2% | |
| 79 | 0.2% | 0.7% | |
| 80 | 0% | 0.5% | |
| 81 | 0.1% | 0.5% | |
| 82 | 0% | 0.4% | |
| 83 | 0% | 0.4% | |
| 84 | 0.1% | 0.4% | |
| 85 | 0.1% | 0.3% | |
| 86 | 0% | 0.2% | |
| 87 | 0.1% | 0.1% | |
| 88 | 0% | 0% |
Kukiz’15
For a full overview of the results for this party, see the Kukiz’15 page.
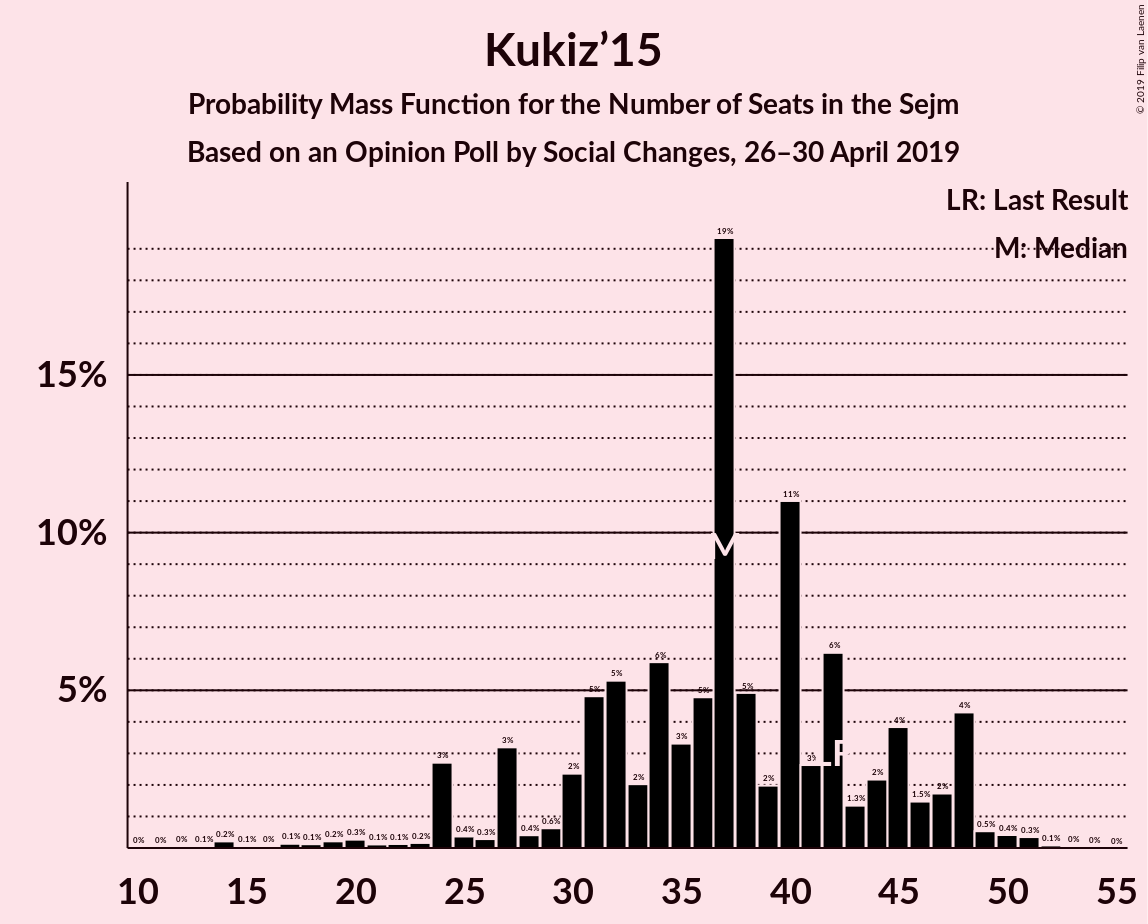
| Number of Seats | Probability | Accumulated | Special Marks |
|---|---|---|---|
| 12 | 0% | 100% | |
| 13 | 0.1% | 99.9% | |
| 14 | 0.2% | 99.9% | |
| 15 | 0.1% | 99.7% | |
| 16 | 0% | 99.6% | |
| 17 | 0.1% | 99.6% | |
| 18 | 0.1% | 99.4% | |
| 19 | 0.2% | 99.3% | |
| 20 | 0.3% | 99.1% | |
| 21 | 0.1% | 98.8% | |
| 22 | 0.1% | 98.7% | |
| 23 | 0.2% | 98.6% | |
| 24 | 3% | 98% | |
| 25 | 0.4% | 96% | |
| 26 | 0.3% | 95% | |
| 27 | 3% | 95% | |
| 28 | 0.4% | 92% | |
| 29 | 0.6% | 91% | |
| 30 | 2% | 91% | |
| 31 | 5% | 88% | |
| 32 | 5% | 84% | |
| 33 | 2% | 78% | |
| 34 | 6% | 76% | |
| 35 | 3% | 70% | |
| 36 | 5% | 67% | |
| 37 | 19% | 62% | Median |
| 38 | 5% | 43% | |
| 39 | 2% | 38% | |
| 40 | 11% | 36% | |
| 41 | 3% | 25% | |
| 42 | 6% | 22% | Last Result |
| 43 | 1.3% | 16% | |
| 44 | 2% | 15% | |
| 45 | 4% | 13% | |
| 46 | 1.5% | 9% | |
| 47 | 2% | 7% | |
| 48 | 4% | 6% | |
| 49 | 0.5% | 1.5% | |
| 50 | 0.4% | 0.9% | |
| 51 | 0.3% | 0.5% | |
| 52 | 0.1% | 0.2% | |
| 53 | 0% | 0.1% | |
| 54 | 0% | 0% |
Polskie Stronnictwo Ludowe
For a full overview of the results for this party, see the Polskie Stronnictwo Ludowe page.
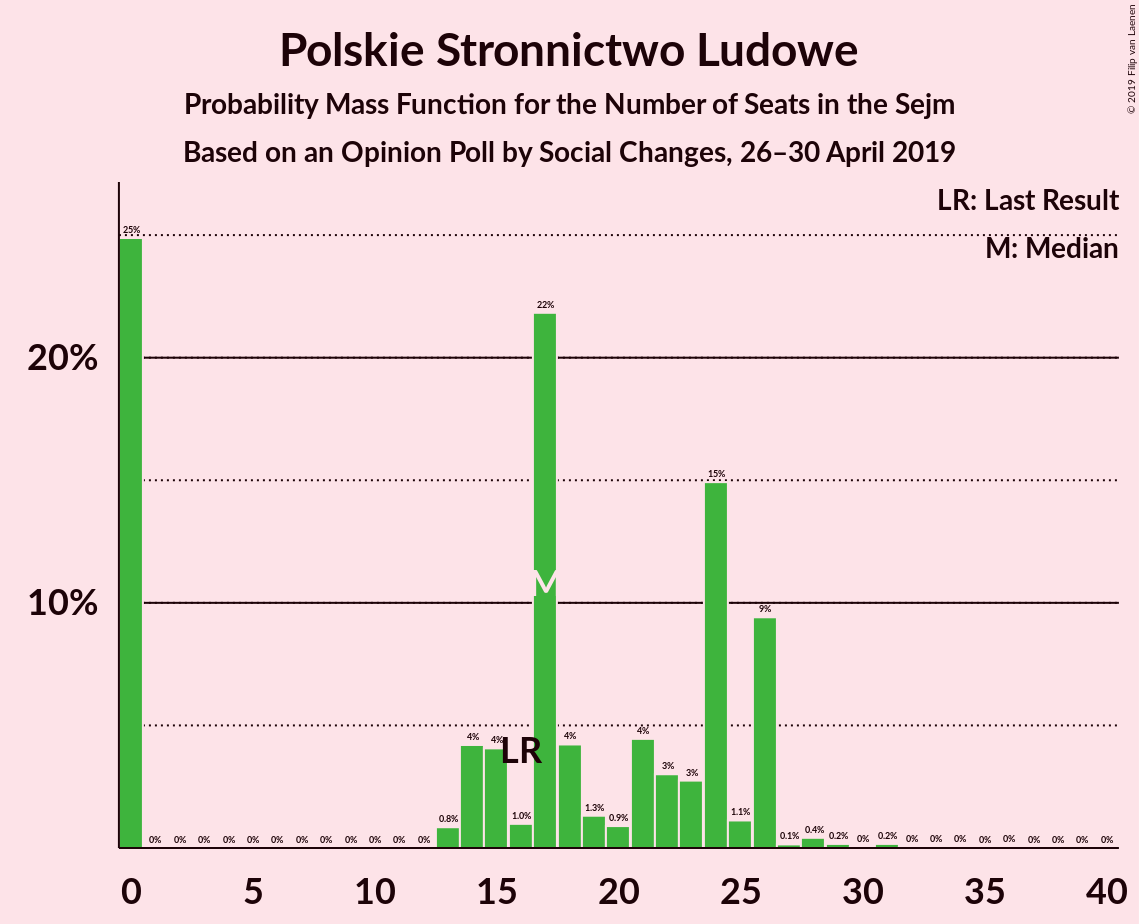
| Number of Seats | Probability | Accumulated | Special Marks |
|---|---|---|---|
| 0 | 25% | 100% | |
| 1 | 0% | 75% | |
| 2 | 0% | 75% | |
| 3 | 0% | 75% | |
| 4 | 0% | 75% | |
| 5 | 0% | 75% | |
| 6 | 0% | 75% | |
| 7 | 0% | 75% | |
| 8 | 0% | 75% | |
| 9 | 0% | 75% | |
| 10 | 0% | 75% | |
| 11 | 0% | 75% | |
| 12 | 0% | 75% | |
| 13 | 0.8% | 75% | |
| 14 | 4% | 74% | |
| 15 | 4% | 70% | |
| 16 | 1.0% | 66% | Last Result |
| 17 | 22% | 65% | Median |
| 18 | 4% | 43% | |
| 19 | 1.3% | 39% | |
| 20 | 0.9% | 38% | |
| 21 | 4% | 37% | |
| 22 | 3% | 32% | |
| 23 | 3% | 29% | |
| 24 | 15% | 27% | |
| 25 | 1.1% | 12% | |
| 26 | 9% | 10% | |
| 27 | 0.1% | 1.1% | |
| 28 | 0.4% | 0.9% | |
| 29 | 0.2% | 0.5% | |
| 30 | 0% | 0.4% | |
| 31 | 0.2% | 0.3% | |
| 32 | 0% | 0.1% | |
| 33 | 0% | 0.1% | |
| 34 | 0% | 0.1% | |
| 35 | 0% | 0.1% | |
| 36 | 0% | 0.1% | |
| 37 | 0% | 0% |
Sojusz Lewicy Demokratycznej
For a full overview of the results for this party, see the Sojusz Lewicy Demokratycznej page.
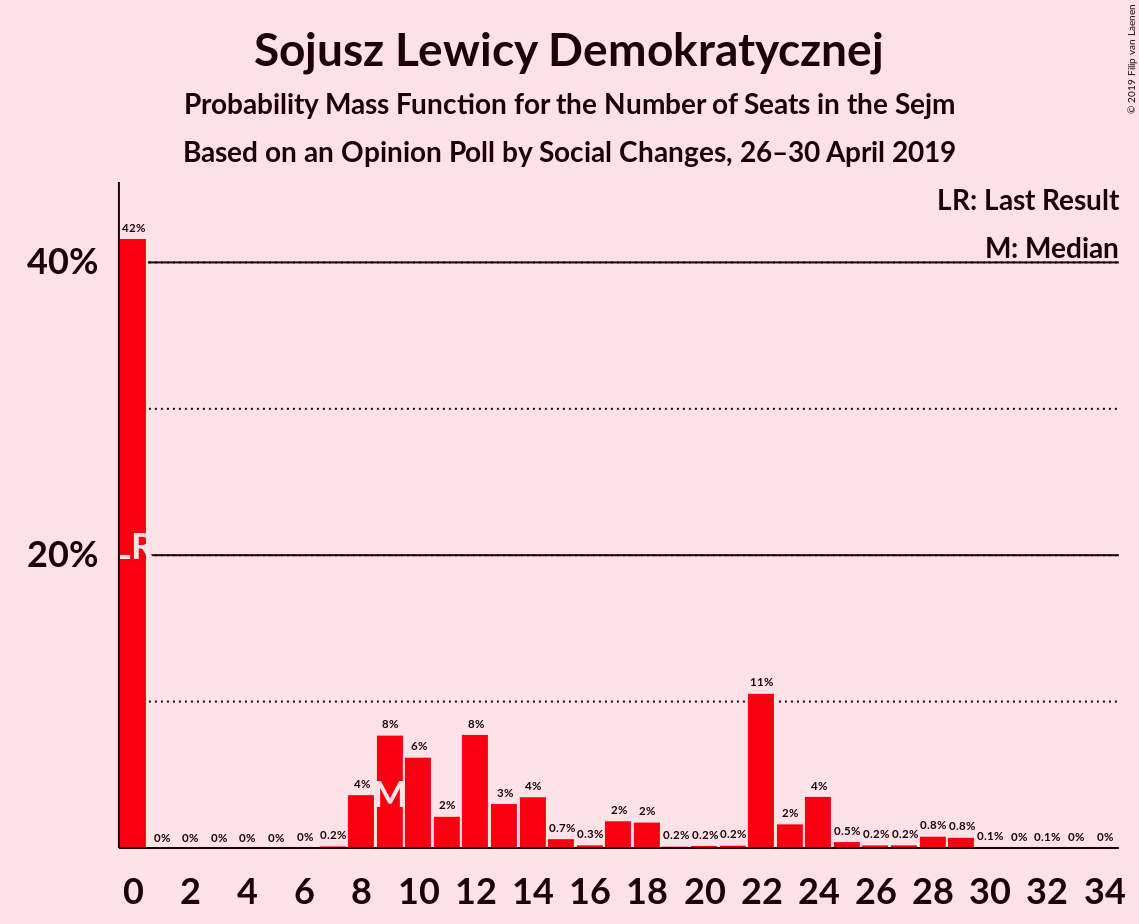
| Number of Seats | Probability | Accumulated | Special Marks |
|---|---|---|---|
| 0 | 42% | 100% | Last Result |
| 1 | 0% | 58% | |
| 2 | 0% | 58% | |
| 3 | 0% | 58% | |
| 4 | 0% | 58% | |
| 5 | 0% | 58% | |
| 6 | 0% | 58% | |
| 7 | 0.2% | 58% | |
| 8 | 4% | 58% | |
| 9 | 8% | 54% | Median |
| 10 | 6% | 47% | |
| 11 | 2% | 40% | |
| 12 | 8% | 38% | |
| 13 | 3% | 30% | |
| 14 | 4% | 27% | |
| 15 | 0.7% | 24% | |
| 16 | 0.3% | 23% | |
| 17 | 2% | 23% | |
| 18 | 2% | 21% | |
| 19 | 0.2% | 19% | |
| 20 | 0.2% | 19% | |
| 21 | 0.2% | 19% | |
| 22 | 11% | 19% | |
| 23 | 2% | 8% | |
| 24 | 4% | 6% | |
| 25 | 0.5% | 3% | |
| 26 | 0.2% | 2% | |
| 27 | 0.2% | 2% | |
| 28 | 0.8% | 2% | |
| 29 | 0.8% | 1.0% | |
| 30 | 0.1% | 0.2% | |
| 31 | 0% | 0.1% | |
| 32 | 0.1% | 0.1% | |
| 33 | 0% | 0% |
KORWiN
For a full overview of the results for this party, see the KORWiN page.
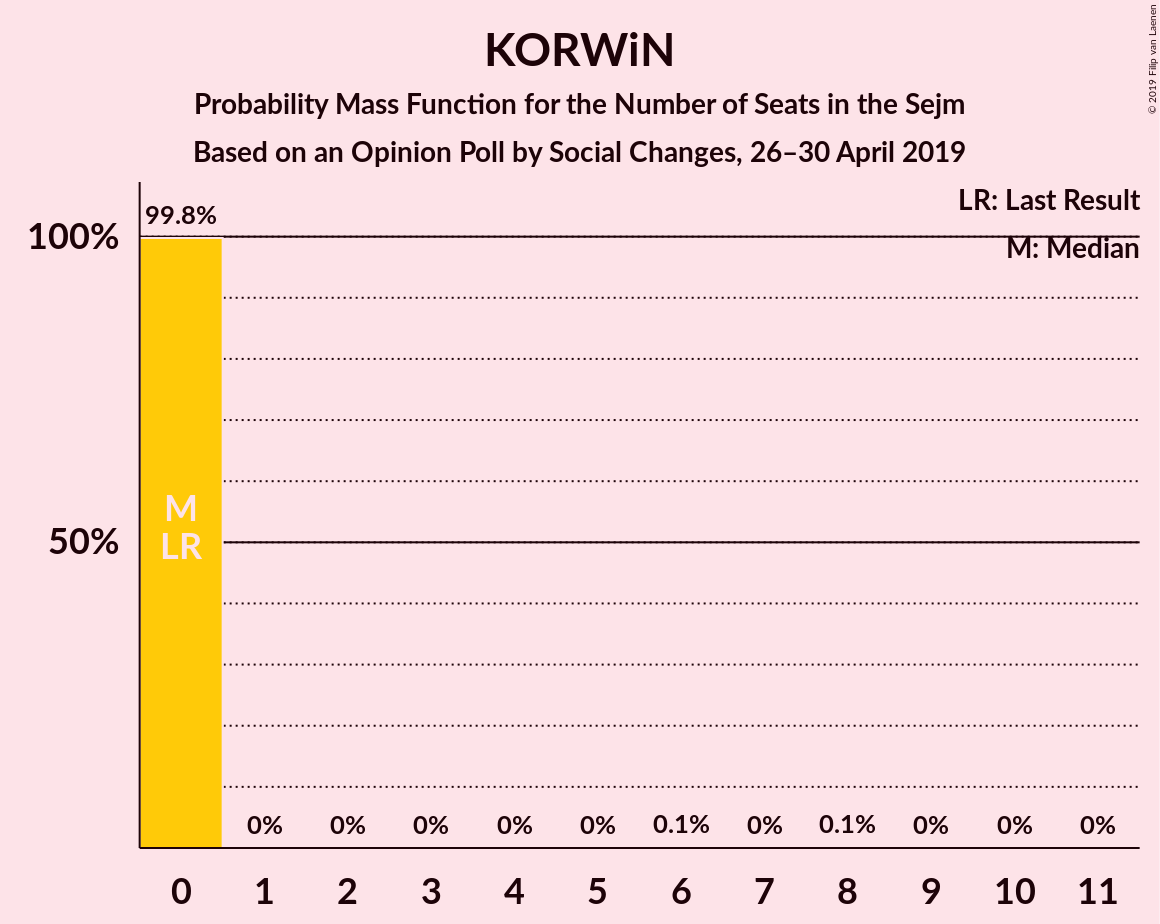
| Number of Seats | Probability | Accumulated | Special Marks |
|---|---|---|---|
| 0 | 99.8% | 100% | Last Result, Median |
| 1 | 0% | 0.2% | |
| 2 | 0% | 0.2% | |
| 3 | 0% | 0.2% | |
| 4 | 0% | 0.2% | |
| 5 | 0% | 0.2% | |
| 6 | 0.1% | 0.2% | |
| 7 | 0% | 0.2% | |
| 8 | 0.1% | 0.1% | |
| 9 | 0% | 0.1% | |
| 10 | 0% | 0.1% | |
| 11 | 0% | 0% |
Lewica Razem
For a full overview of the results for this party, see the Lewica Razem page.
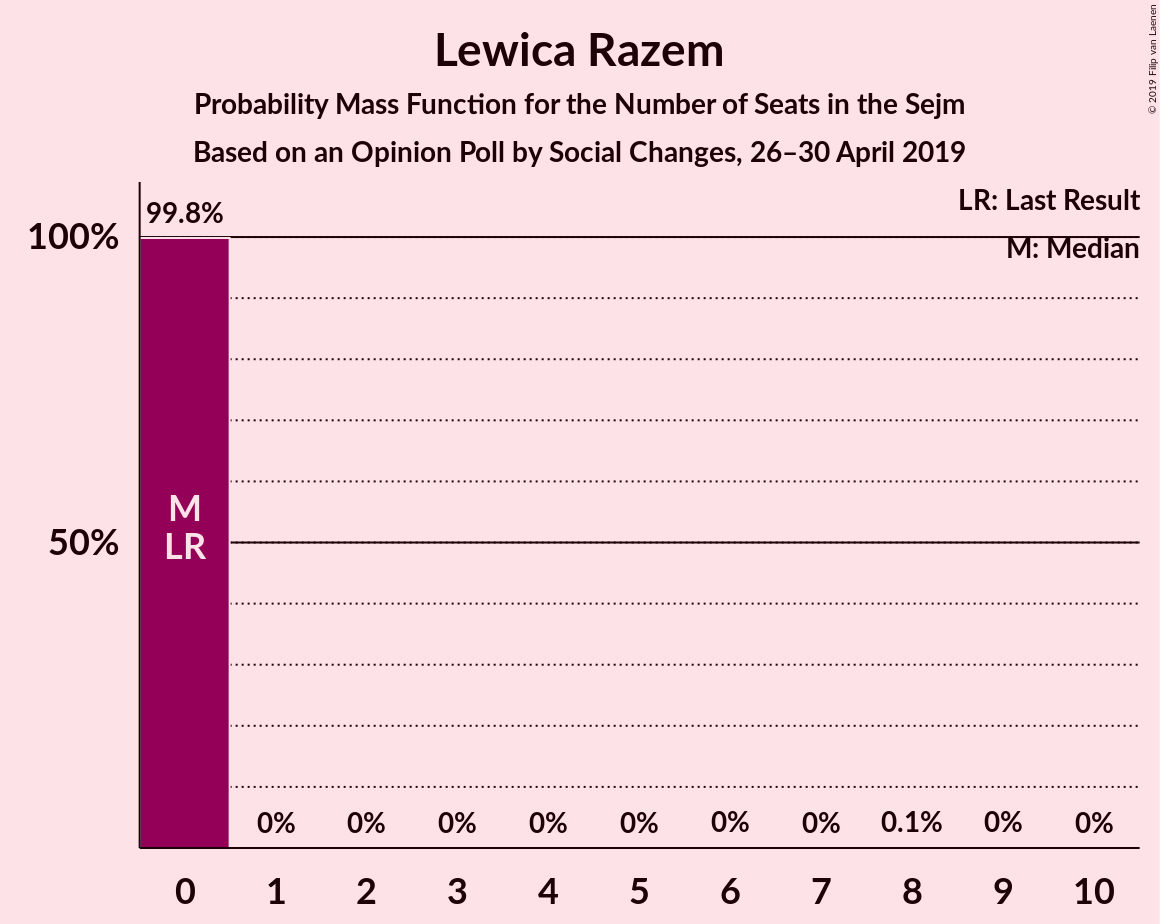
| Number of Seats | Probability | Accumulated | Special Marks |
|---|---|---|---|
| 0 | 99.8% | 100% | Last Result, Median |
| 1 | 0% | 0.2% | |
| 2 | 0% | 0.2% | |
| 3 | 0% | 0.2% | |
| 4 | 0% | 0.2% | |
| 5 | 0% | 0.2% | |
| 6 | 0% | 0.2% | |
| 7 | 0% | 0.1% | |
| 8 | 0.1% | 0.1% | |
| 9 | 0% | 0.1% | |
| 10 | 0% | 0% |
Coalitions
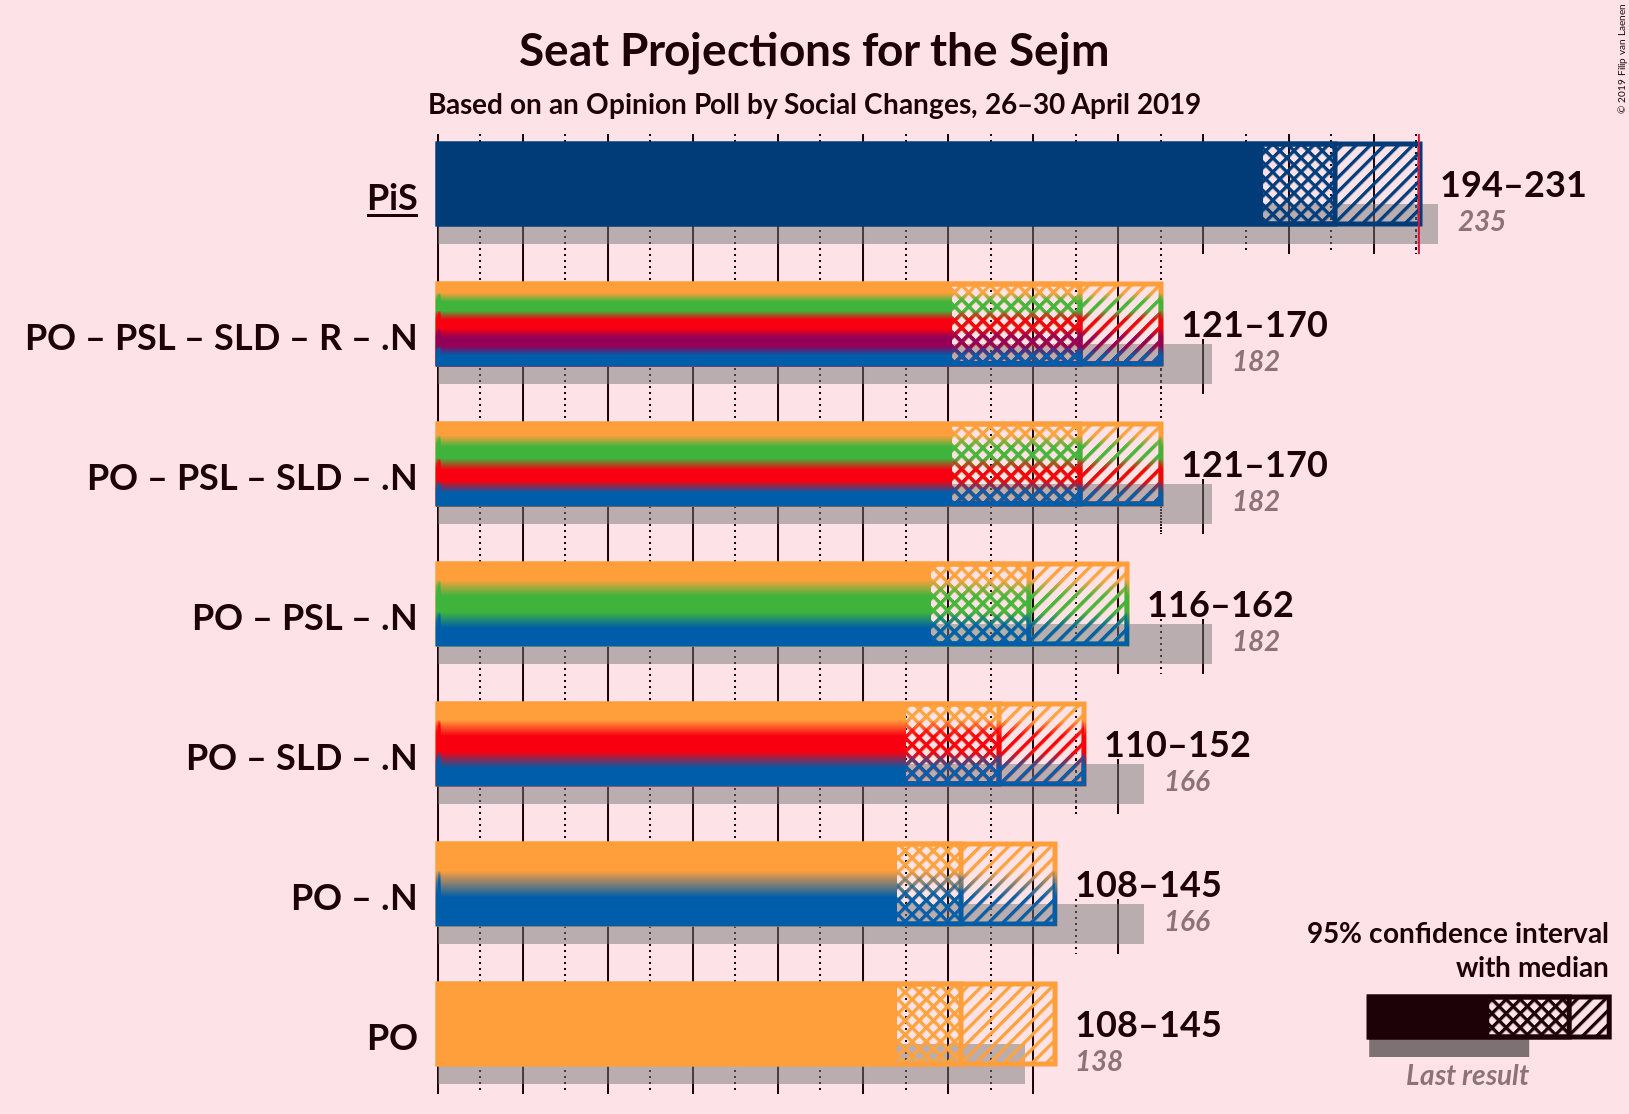
Confidence Intervals
| Coalition | Last Result | Median | Majority? | 80% Confidence Interval | 90% Confidence Interval | 95% Confidence Interval | 99% Confidence Interval |
|---|---|---|---|---|---|---|---|
| Prawo i Sprawiedliwość | 235 | 211 | 3% | 199–222 | 196–228 | 194–231 | 188–238 |
| Platforma Obywatelska | 138 | 123 | 0% | 113–135 | 110–140 | 108–145 | 102–150 |
Prawo i Sprawiedliwość
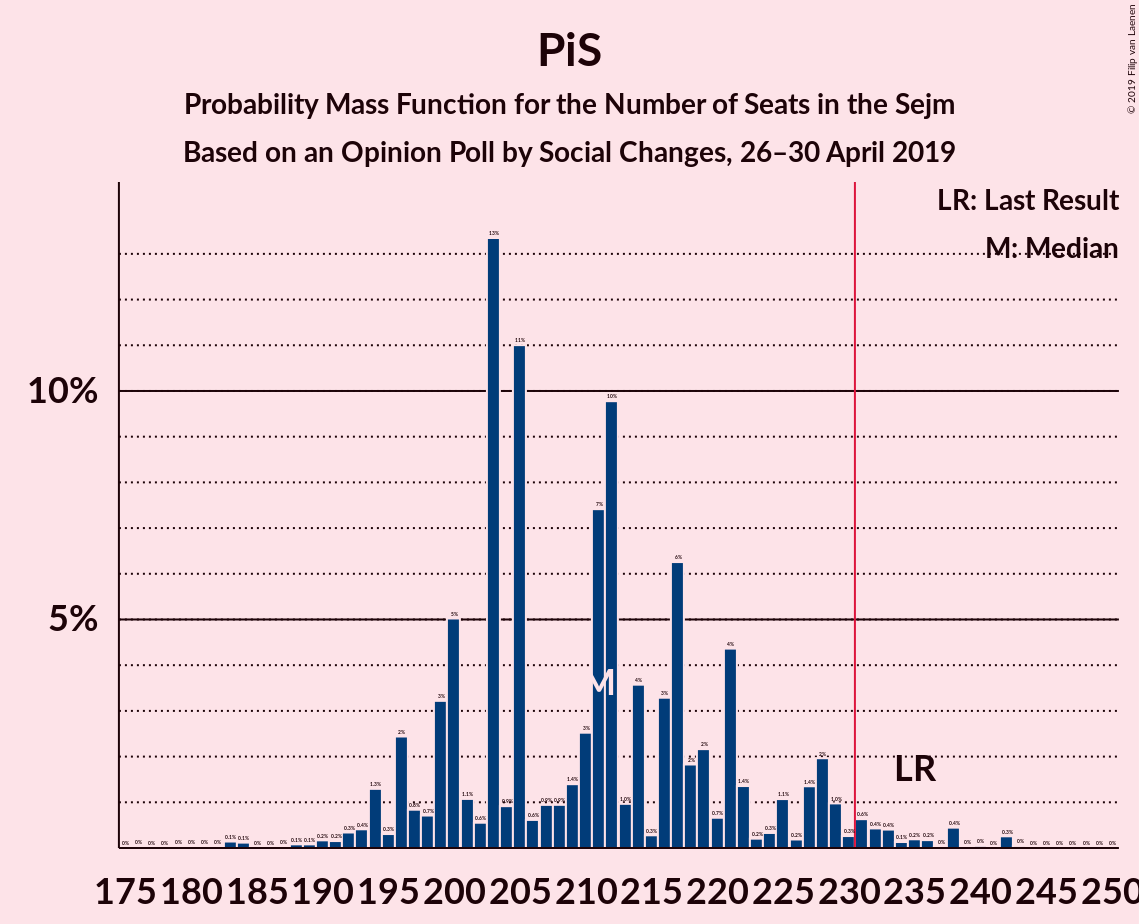
| Number of Seats | Probability | Accumulated | Special Marks |
|---|---|---|---|
| 178 | 0% | 100% | |
| 179 | 0% | 99.9% | |
| 180 | 0% | 99.9% | |
| 181 | 0% | 99.9% | |
| 182 | 0% | 99.9% | |
| 183 | 0.1% | 99.8% | |
| 184 | 0.1% | 99.7% | |
| 185 | 0% | 99.6% | |
| 186 | 0% | 99.6% | |
| 187 | 0% | 99.6% | |
| 188 | 0.1% | 99.5% | |
| 189 | 0.1% | 99.4% | |
| 190 | 0.2% | 99.4% | |
| 191 | 0.2% | 99.2% | |
| 192 | 0.3% | 99.0% | |
| 193 | 0.4% | 98.7% | |
| 194 | 1.3% | 98% | |
| 195 | 0.3% | 97% | |
| 196 | 2% | 97% | |
| 197 | 0.8% | 94% | |
| 198 | 0.7% | 93% | |
| 199 | 3% | 93% | |
| 200 | 5% | 89% | |
| 201 | 1.1% | 84% | |
| 202 | 0.6% | 83% | |
| 203 | 13% | 83% | |
| 204 | 0.9% | 69% | |
| 205 | 11% | 69% | |
| 206 | 0.6% | 58% | |
| 207 | 0.9% | 57% | |
| 208 | 0.9% | 56% | |
| 209 | 1.4% | 55% | |
| 210 | 3% | 54% | |
| 211 | 7% | 51% | Median |
| 212 | 10% | 44% | |
| 213 | 1.0% | 34% | |
| 214 | 4% | 33% | |
| 215 | 0.3% | 29% | |
| 216 | 3% | 29% | |
| 217 | 6% | 26% | |
| 218 | 2% | 20% | |
| 219 | 2% | 18% | |
| 220 | 0.7% | 16% | |
| 221 | 4% | 15% | |
| 222 | 1.4% | 11% | |
| 223 | 0.2% | 9% | |
| 224 | 0.3% | 9% | |
| 225 | 1.1% | 9% | |
| 226 | 0.2% | 8% | |
| 227 | 1.4% | 7% | |
| 228 | 2% | 6% | |
| 229 | 1.0% | 4% | |
| 230 | 0.3% | 3% | |
| 231 | 0.6% | 3% | Majority |
| 232 | 0.4% | 2% | |
| 233 | 0.4% | 2% | |
| 234 | 0.1% | 1.4% | |
| 235 | 0.2% | 1.3% | Last Result |
| 236 | 0.2% | 1.1% | |
| 237 | 0% | 0.9% | |
| 238 | 0.4% | 0.9% | |
| 239 | 0% | 0.5% | |
| 240 | 0% | 0.4% | |
| 241 | 0% | 0.4% | |
| 242 | 0.3% | 0.4% | |
| 243 | 0% | 0.1% | |
| 244 | 0% | 0.1% | |
| 245 | 0% | 0.1% | |
| 246 | 0% | 0.1% | |
| 247 | 0% | 0.1% | |
| 248 | 0% | 0.1% | |
| 249 | 0% | 0% |
Platforma Obywatelska
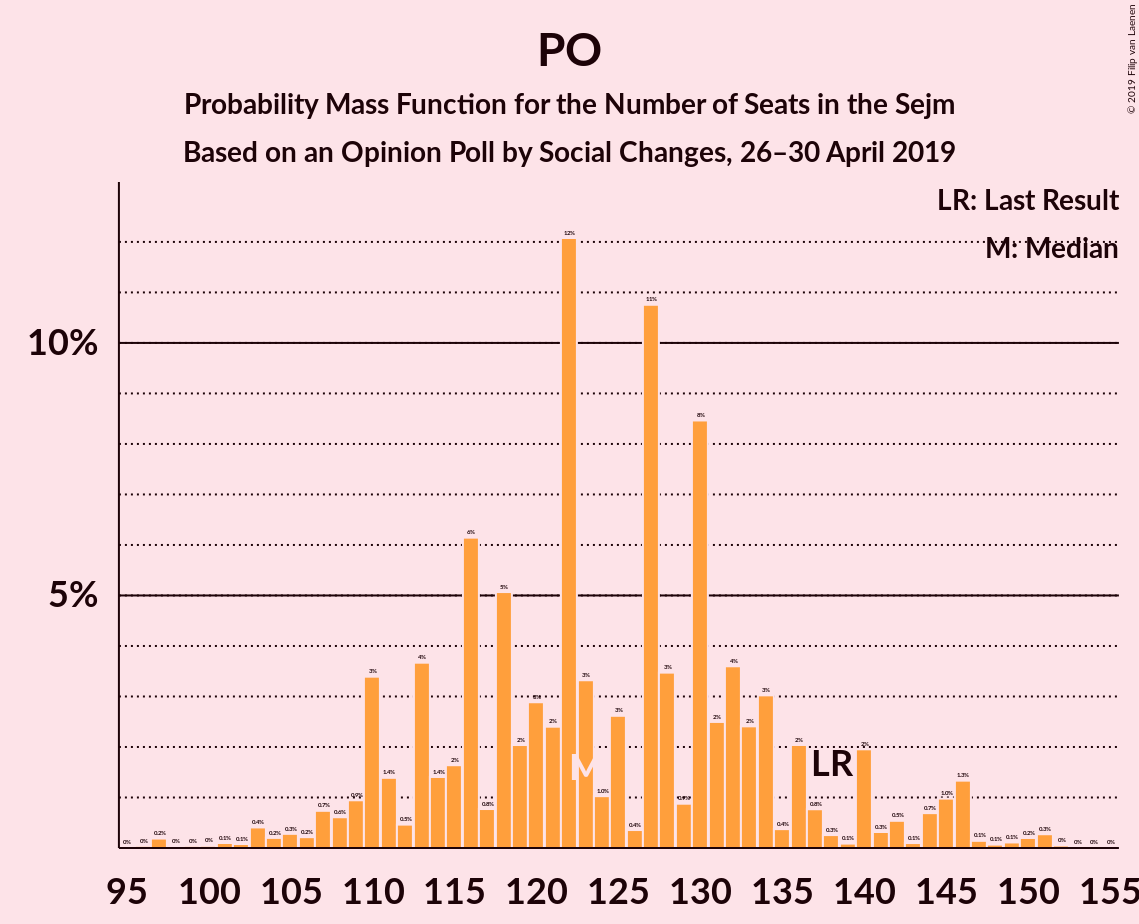
| Number of Seats | Probability | Accumulated | Special Marks |
|---|---|---|---|
| 96 | 0% | 100% | |
| 97 | 0.2% | 99.9% | |
| 98 | 0% | 99.7% | |
| 99 | 0% | 99.7% | |
| 100 | 0% | 99.7% | |
| 101 | 0.1% | 99.6% | |
| 102 | 0.1% | 99.5% | |
| 103 | 0.4% | 99.5% | |
| 104 | 0.2% | 99.1% | |
| 105 | 0.3% | 98.9% | |
| 106 | 0.2% | 98.6% | |
| 107 | 0.7% | 98% | |
| 108 | 0.6% | 98% | |
| 109 | 0.9% | 97% | |
| 110 | 3% | 96% | |
| 111 | 1.4% | 93% | |
| 112 | 0.5% | 91% | |
| 113 | 4% | 91% | |
| 114 | 1.4% | 87% | |
| 115 | 2% | 86% | |
| 116 | 6% | 84% | |
| 117 | 0.8% | 78% | |
| 118 | 5% | 77% | |
| 119 | 2% | 72% | |
| 120 | 3% | 70% | |
| 121 | 2% | 67% | |
| 122 | 12% | 65% | |
| 123 | 3% | 53% | Median |
| 124 | 1.0% | 49% | |
| 125 | 3% | 48% | |
| 126 | 0.4% | 46% | |
| 127 | 11% | 45% | |
| 128 | 3% | 35% | |
| 129 | 0.9% | 31% | |
| 130 | 8% | 30% | |
| 131 | 2% | 22% | |
| 132 | 4% | 19% | |
| 133 | 2% | 16% | |
| 134 | 3% | 13% | |
| 135 | 0.4% | 10% | |
| 136 | 2% | 10% | |
| 137 | 0.8% | 8% | |
| 138 | 0.3% | 7% | Last Result |
| 139 | 0.1% | 7% | |
| 140 | 2% | 7% | |
| 141 | 0.3% | 5% | |
| 142 | 0.5% | 5% | |
| 143 | 0.1% | 4% | |
| 144 | 0.7% | 4% | |
| 145 | 1.0% | 3% | |
| 146 | 1.3% | 2% | |
| 147 | 0.1% | 0.9% | |
| 148 | 0.1% | 0.7% | |
| 149 | 0.1% | 0.7% | |
| 150 | 0.2% | 0.6% | |
| 151 | 0.3% | 0.4% | |
| 152 | 0% | 0.1% | |
| 153 | 0% | 0% |
Technical Information
Opinion Poll
- Polling firm: Social Changes
- Commissioner(s): —
- Fieldwork period: 26–30 April 2019
Calculations
- Sample size: 1050
- Simulations done: 131,072
- Error estimate: 1.81%