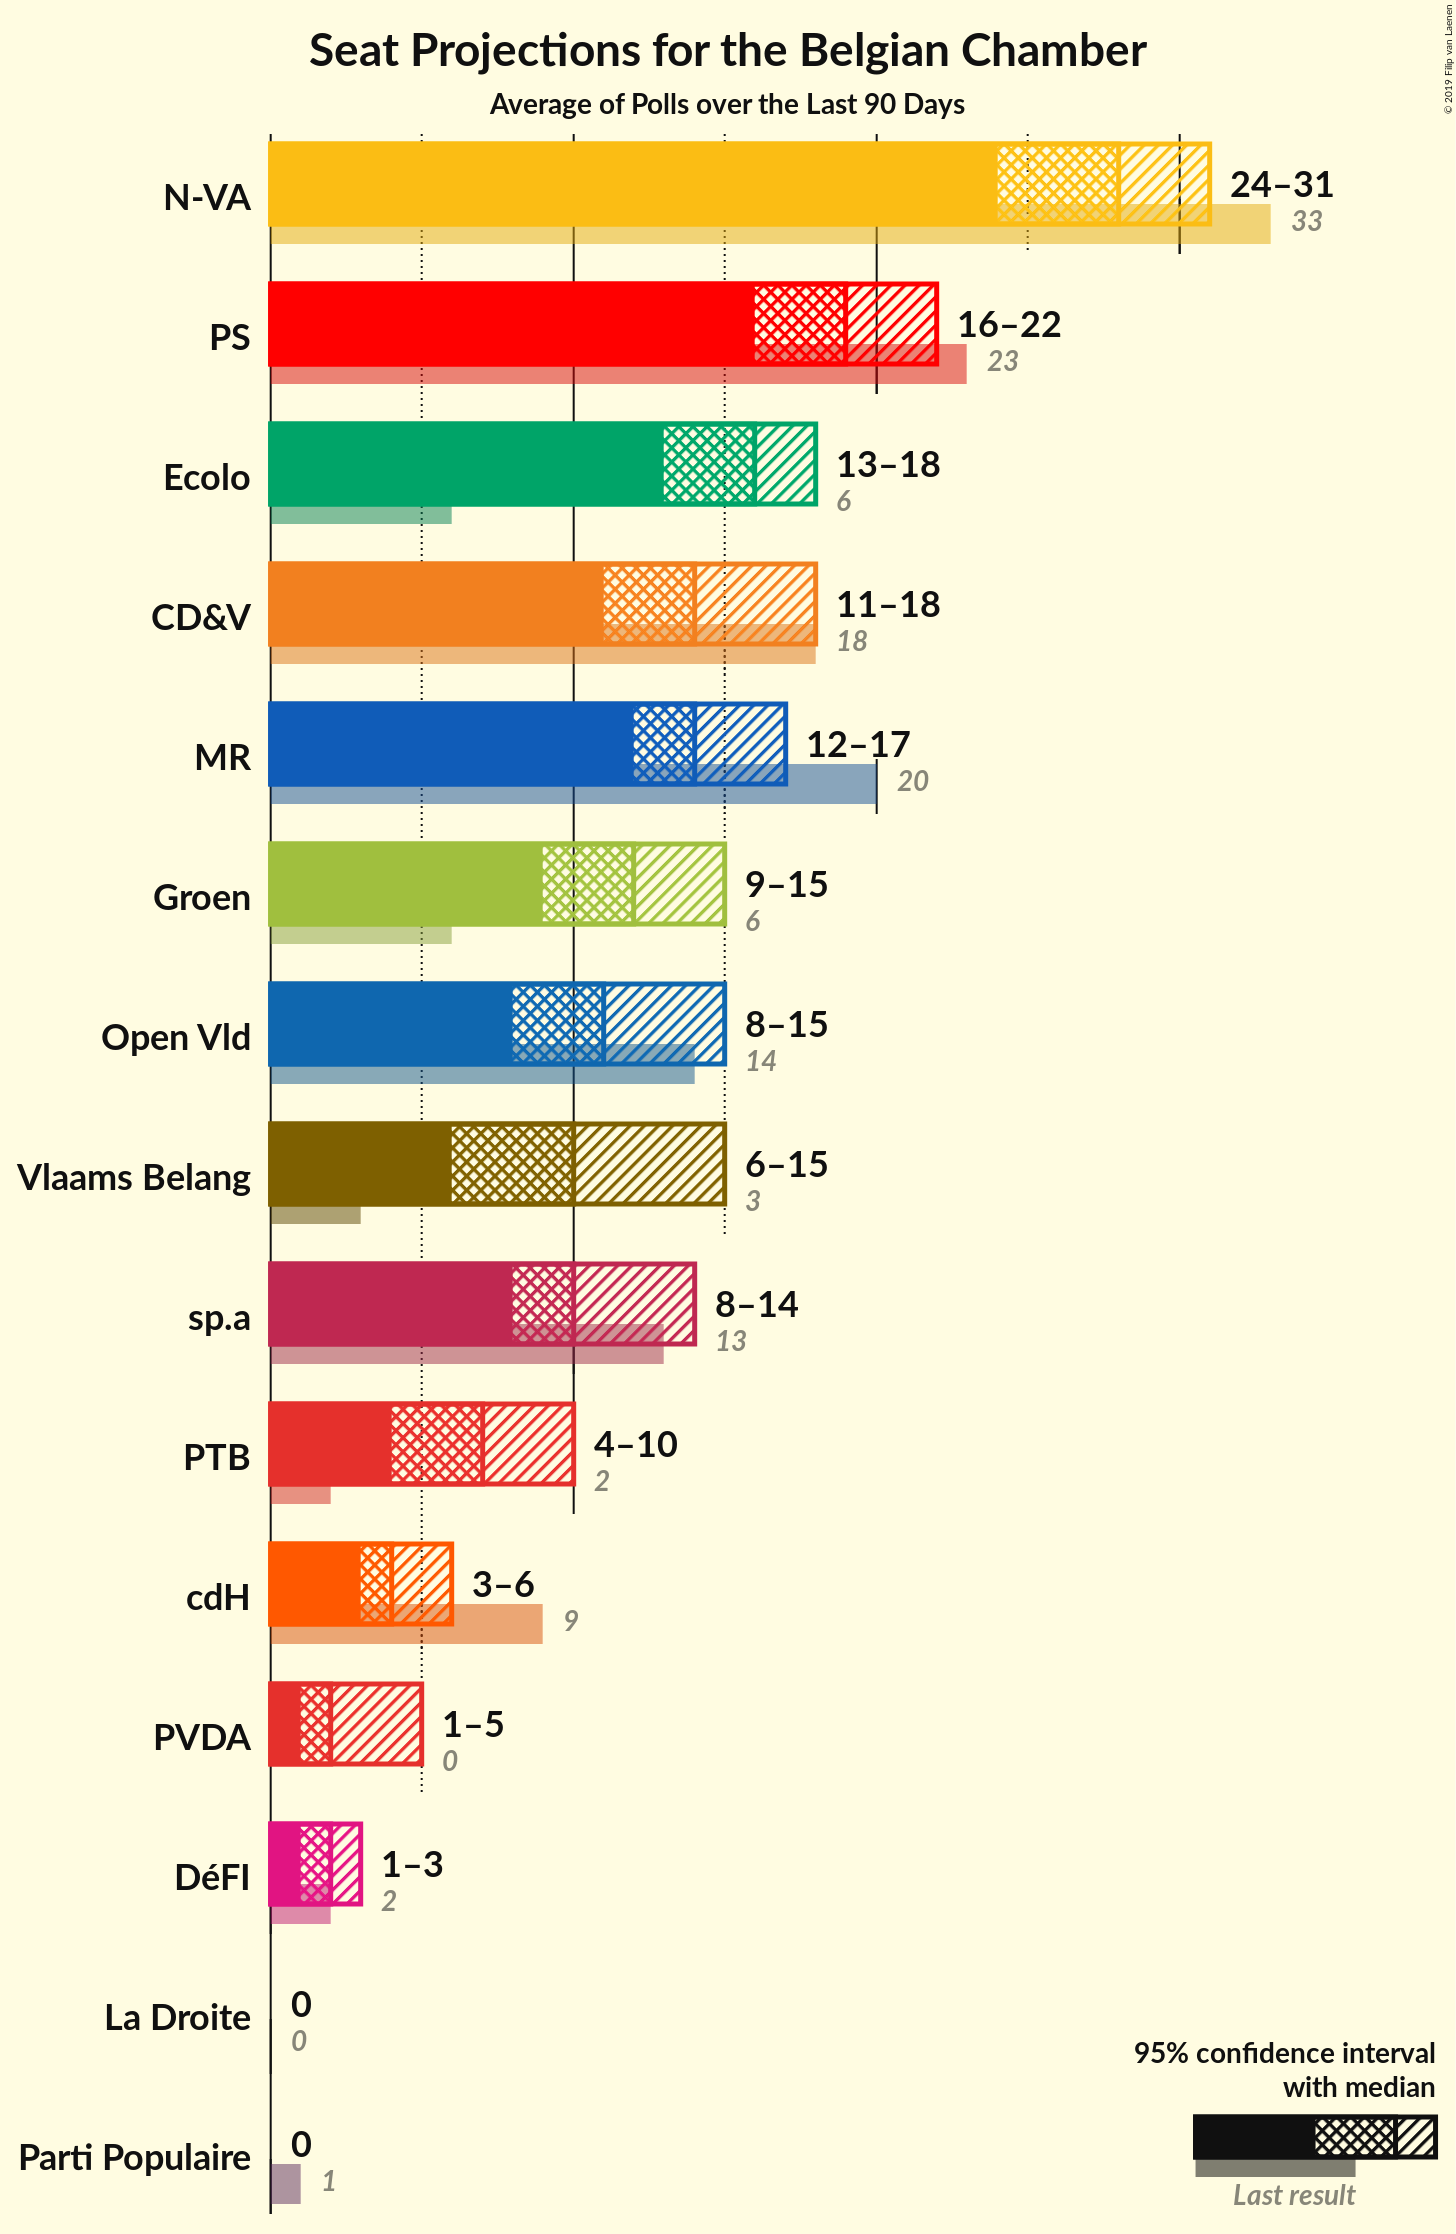
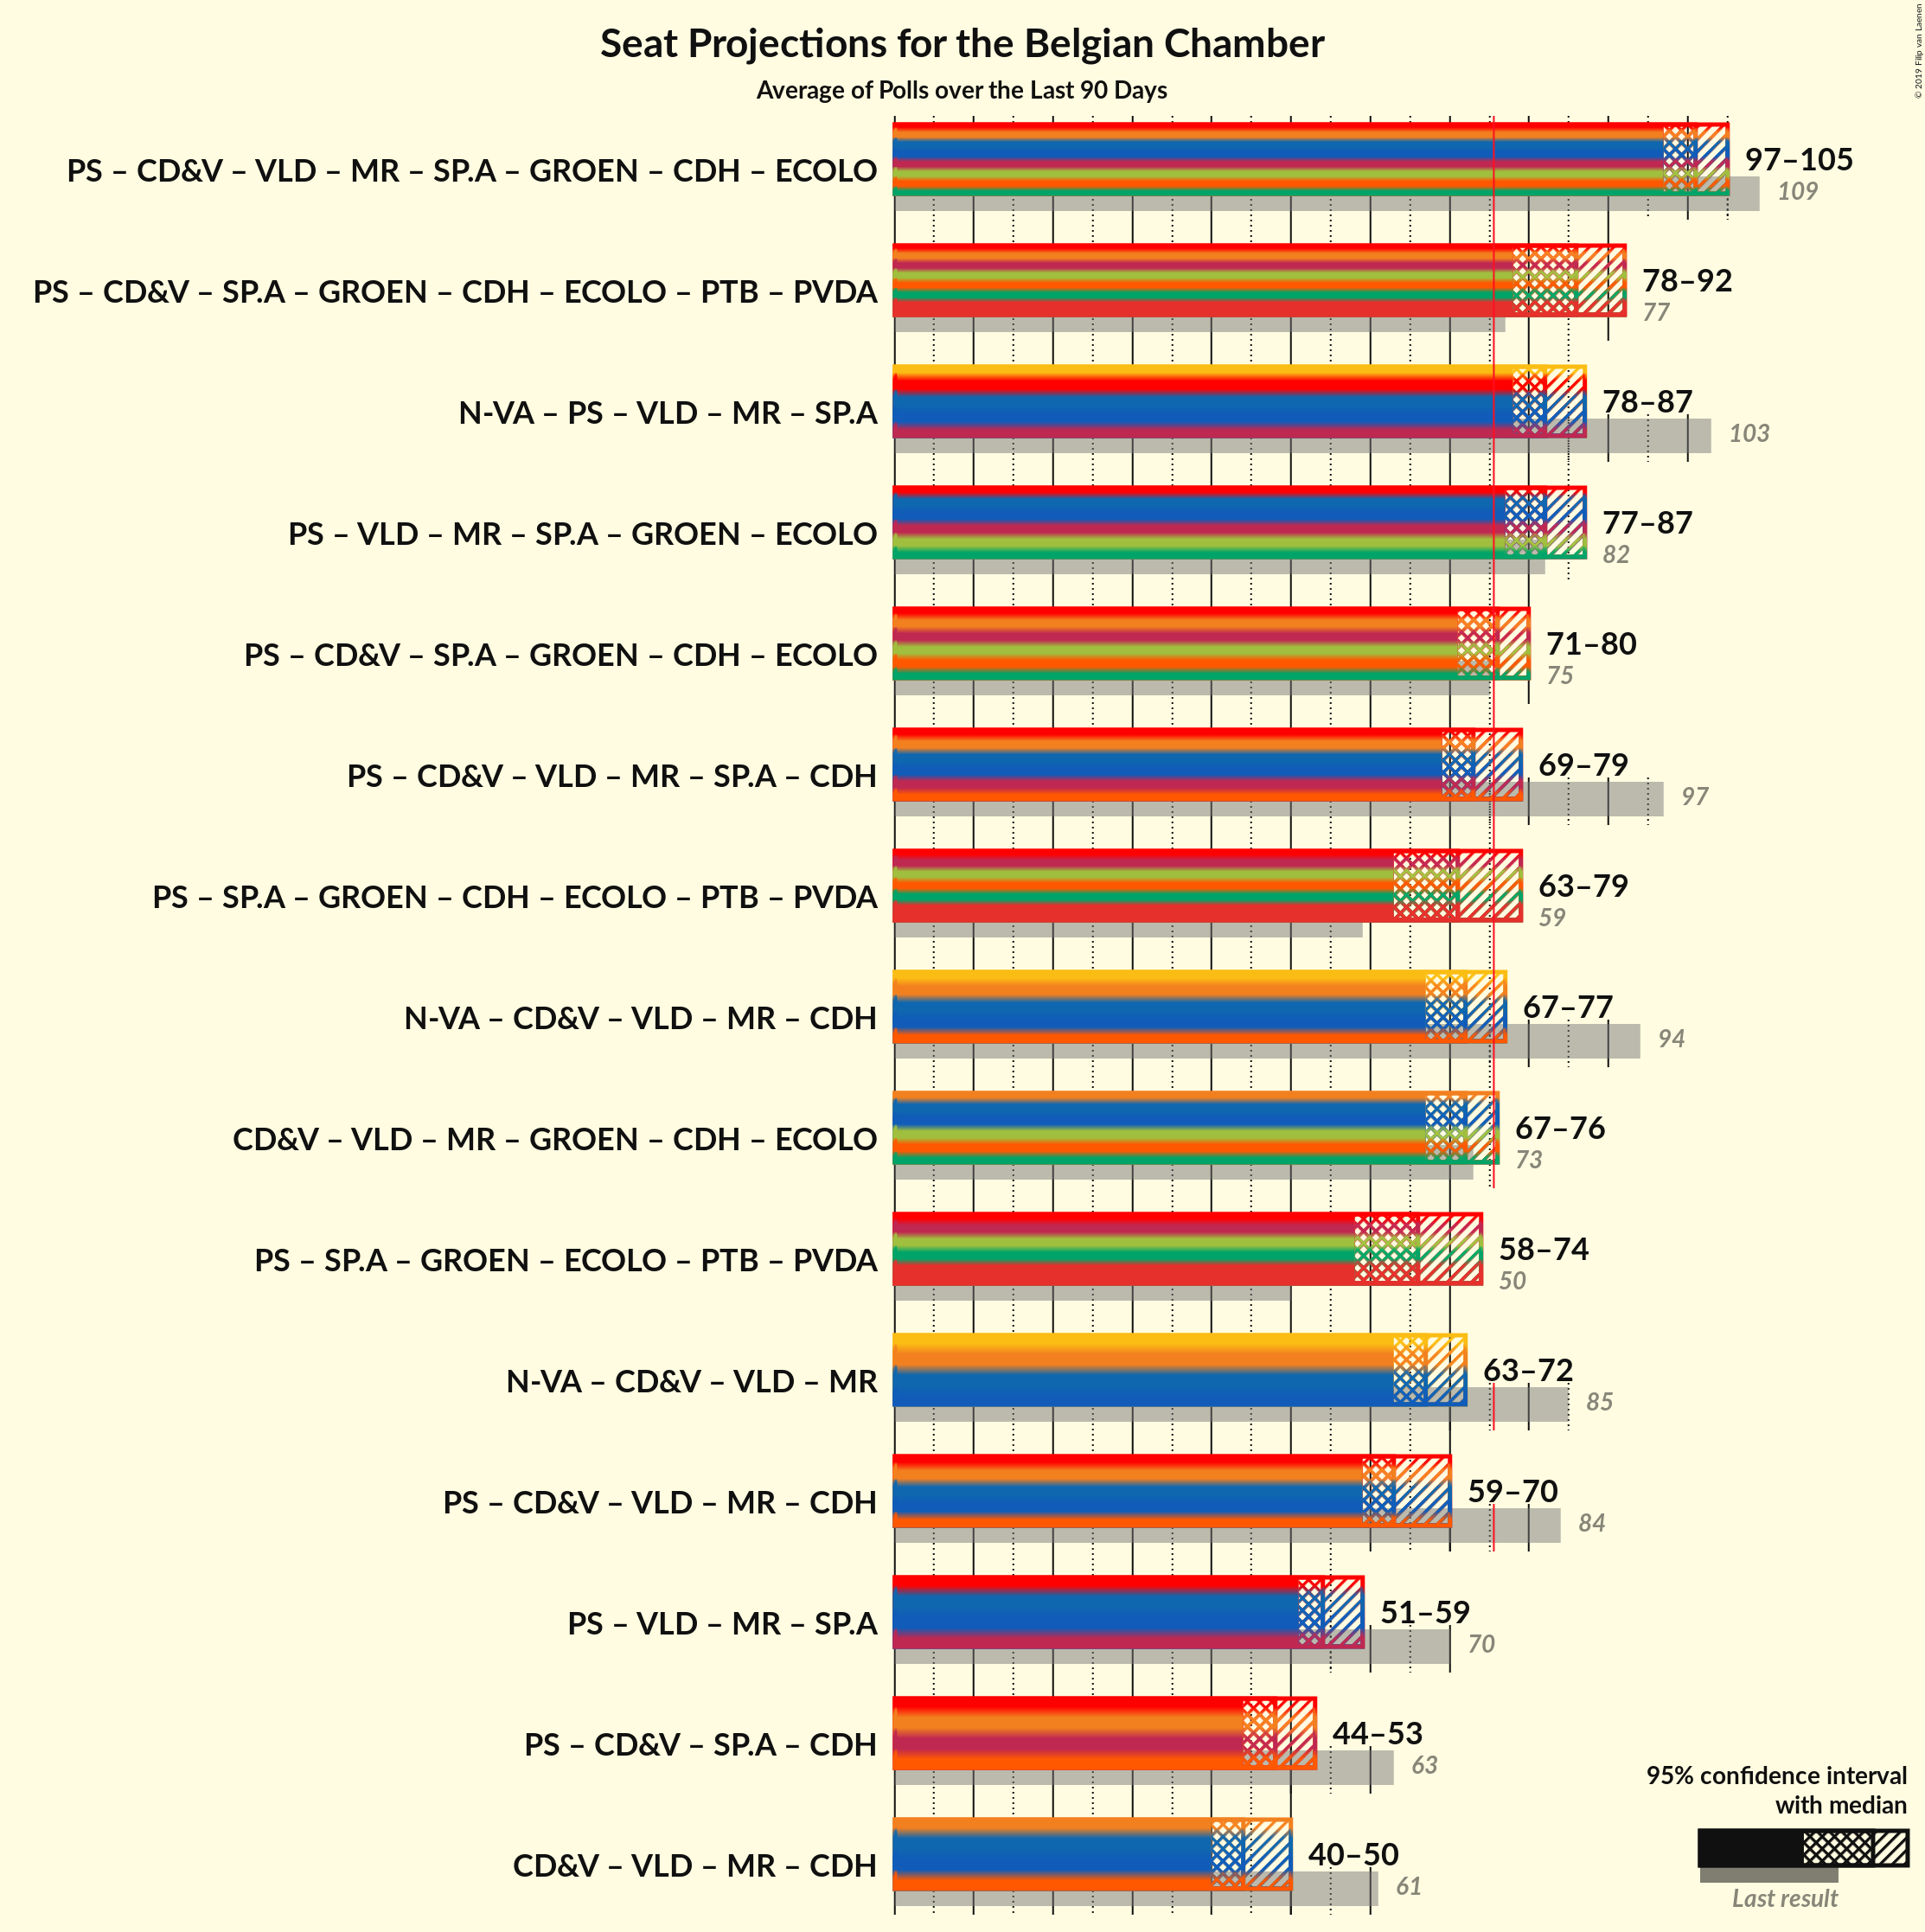
Overview
The table below lists the most recent polls (less than 90 days old) registered and analyzed so far.
| Period | Polling firm/Commissioner(s) | N-VA | PS | CD&V | VLD | MR | SP.A | GROEN | CDH | VB | ECOLO | PTB | DÉFI | PVDA | PP | DLB | LDD | DROITE | PIRAAT | ISLAM | WDA | PIRATE | RWF | FW |
|---|---|---|---|---|---|---|---|---|---|---|---|---|---|---|---|---|---|---|---|---|---|---|---|---|
| 25 May 2014 | General Election | 20.3% 33 |
11.7% 23 |
11.6% 18 |
9.8% 14 |
9.6% 20 |
8.8% 13 |
5.3% 6 |
5.0% 9 |
3.7% 3 |
3.3% 6 |
2.0% 2 |
1.8% 2 |
1.8% 0 |
1.5% 1 |
0.9% 0 |
0.4% 0 |
0.4% 0 |
0.3% 0 |
0.2% 0 |
0.2% 0 |
0.2% 0 |
0.1% 0 |
0.1% 0 |
| N/A | Poll Average | 15–17% 24–31 |
8–9% 16–22 |
8–9% 11–18 |
6–7% 8–15 |
6% 12–17 |
6–7% 8–14 |
6–10% 9–15 |
3% 3–6 |
5–6% 6–15 |
6–7% 13–18 |
3% 4–10 |
1–2% 1–3 |
2–4% 1–5 |
1% 0 |
N/A N/A |
N/A N/A |
0% 0 |
N/A N/A |
N/A N/A |
N/A N/A |
N/A N/A |
N/A N/A |
N/A N/A |
| 6–14 May 2019 | Ipsos Het Laatste Nieuws, Le Soir, RTL TVi and VTM |
16–17% 24–31 |
9% 18–22 |
9–10% 13–18 |
5–6% 8–12 |
7–8% 13–17 |
6–8% 7–11 |
6–8% 8–12 |
3% 3–7 |
8–9% 11–15 |
6–7% 12–17 |
3% 4–6 |
2% 2–3 |
2–3% 1–3 |
1% 0–1 |
N/A N/A |
N/A N/A |
0% 0 |
N/A N/A |
N/A N/A |
N/A N/A |
N/A N/A |
N/A N/A |
N/A N/A |
| 25 March–14 April 2019 | TNS De Standaard, La Libre Belgique, RTBf and VRT |
15–17% 24–30 |
8% 16–20 |
8% 11–15 |
7–8% 11–16 |
6% 11–15 |
6–7% 9–14 |
8–10% 11–16 |
3% 3–6 |
4–5% 6–8 |
7–8% 15–18 |
4–5% 8–11 |
1–2% 1–2 |
3–4% 1–5 |
1% 0 |
N/A N/A |
N/A N/A |
N/A N/A |
N/A N/A |
N/A N/A |
N/A N/A |
N/A N/A |
N/A N/A |
N/A N/A |
| 25 May 2014 | General Election | 20.3% 33 |
11.7% 23 |
11.6% 18 |
9.8% 14 |
9.6% 20 |
8.8% 13 |
5.3% 6 |
5.0% 9 |
3.7% 3 |
3.3% 6 |
2.0% 2 |
1.8% 2 |
1.8% 0 |
1.5% 1 |
0.9% 0 |
0.4% 0 |
0.4% 0 |
0.3% 0 |
0.2% 0 |
0.2% 0 |
0.2% 0 |
0.1% 0 |
0.1% 0 |
Only polls for which at least the sample size has been published are included in the table above.
Legend:
- Top half of each row: Voting intentions (95% confidence interval)
- Bottom half of each row: Seat projections for the Belgian Chamber (95% confidence interval)
- N-VA: N-VA
- PS: PS
- CD&V: CD&V
- VLD: Open Vld
- MR: MR
- SP.A: sp.a
- GROEN: Groen
- CDH: cdH
- VB: Vlaams Belang
- ECOLO: Ecolo
- PTB: PTB
- DÉFI: DéFI
- PVDA: PVDA
- PP: Parti Populaire
- DLB: Debout les Belges
- LDD: Lijst Dedecker
- DROITE: La Droite
- PIRAAT: Piratenpartij
- ISLAM: ISLAM
- WDA: Wallonie d’Abord
- PIRATE: PIRATE
- RWF: R.W.F.
- FW: FW
- N/A (single party): Party not included the published results
- N/A (entire row): Calculation for this opinion poll not started yet


