Poll Average
Voting Intentions | Seats | Coalitions | Technical Information
Summary
The table below lists the polls on which the average is based. They are the most recent polls (less than 90 days old) registered and analyzed so far.
| Period | Polling firm/Commissioner(s) | N-VA | PS | CD&V | VLD | MR | SP.A | GROEN | CDH | VB | ECOLO | PTB | DÉFI | PVDA | PP | DLB | LDD | DROITE | PIRAAT | ISLAM | WDA | PIRATE | RWF | FW |
|---|---|---|---|---|---|---|---|---|---|---|---|---|---|---|---|---|---|---|---|---|---|---|---|---|
| 25 May 2014 | General Election | 20.3% 33 |
11.7% 23 |
11.6% 18 |
9.8% 14 |
9.6% 20 |
8.8% 13 |
5.3% 6 |
5.0% 9 |
3.7% 3 |
3.3% 6 |
2.0% 2 |
1.8% 2 |
1.8% 0 |
1.5% 1 |
0.9% 0 |
0.4% 0 |
0.4% 0 |
0.3% 0 |
0.2% 0 |
0.2% 0 |
0.2% 0 |
0.1% 0 |
0.1% 0 |
| N/A | Poll Average | 15–17% 24–31 |
8–9% 16–22 |
8–9% 11–18 |
6–7% 8–15 |
6% 12–17 |
6–7% 8–14 |
6–10% 9–15 |
3% 3–6 |
5–6% 6–15 |
6–7% 13–18 |
3% 4–10 |
1–2% 1–3 |
2–4% 1–5 |
1% 0 |
N/A N/A |
N/A N/A |
0% 0 |
N/A N/A |
N/A N/A |
N/A N/A |
N/A N/A |
N/A N/A |
N/A N/A |
| 6–14 May 2019 | Ipsos Het Laatste Nieuws, Le Soir, RTL TVi and VTM |
16–17% 24–31 |
9% 18–22 |
9–10% 13–18 |
5–6% 8–12 |
7–8% 13–17 |
6–8% 7–11 |
6–8% 8–12 |
3% 3–7 |
8–9% 11–15 |
6–7% 12–17 |
3% 4–6 |
2% 2–3 |
2–3% 1–3 |
1% 0–1 |
N/A N/A |
N/A N/A |
0% 0 |
N/A N/A |
N/A N/A |
N/A N/A |
N/A N/A |
N/A N/A |
N/A N/A |
| 25 March–14 April 2019 | TNS De Standaard, La Libre Belgique, RTBf and VRT |
15–17% 24–30 |
8% 16–20 |
8% 11–15 |
7–8% 11–16 |
6% 11–15 |
6–7% 9–14 |
8–10% 11–16 |
3% 3–6 |
4–5% 6–8 |
7–8% 15–18 |
4–5% 8–11 |
1–2% 1–2 |
3–4% 1–5 |
1% 0 |
N/A N/A |
N/A N/A |
N/A N/A |
N/A N/A |
N/A N/A |
N/A N/A |
N/A N/A |
N/A N/A |
N/A N/A |
| 25 May 2014 | General Election | 20.3% 33 |
11.7% 23 |
11.6% 18 |
9.8% 14 |
9.6% 20 |
8.8% 13 |
5.3% 6 |
5.0% 9 |
3.7% 3 |
3.3% 6 |
2.0% 2 |
1.8% 2 |
1.8% 0 |
1.5% 1 |
0.9% 0 |
0.4% 0 |
0.4% 0 |
0.3% 0 |
0.2% 0 |
0.2% 0 |
0.2% 0 |
0.1% 0 |
0.1% 0 |
Only polls for which at least the sample size has been published are included in the table above.
Legend:
- Top half of each row: Voting intentions (95% confidence interval)
- Bottom half of each row: Seat projections for the Belgian Chamber (95% confidence interval)
- N-VA: N-VA
- PS: PS
- CD&V: CD&V
- VLD: Open Vld
- MR: MR
- SP.A: sp.a
- GROEN: Groen
- CDH: cdH
- VB: Vlaams Belang
- ECOLO: Ecolo
- PTB: PTB
- DÉFI: DéFI
- PVDA: PVDA
- PP: Parti Populaire
- DLB: Debout les Belges
- LDD: Lijst Dedecker
- DROITE: La Droite
- PIRAAT: Piratenpartij
- ISLAM: ISLAM
- WDA: Wallonie d’Abord
- PIRATE: PIRATE
- RWF: R.W.F.
- FW: FW
- N/A (single party): Party not included the published results
- N/A (entire row): Calculation for this opinion poll not started yet
Voting Intentions

Confidence Intervals
| Party | Last Result | Median | 80% Confidence Interval | 90% Confidence Interval | 95% Confidence Interval | 99% Confidence Interval |
|---|---|---|---|---|---|---|
| N-VA | 20.3% | 16.4% | 15.8–16.7% | 15.6–16.7% | 15.4–16.7% | 15.0–16.7% |
| PS | 11.7% | 8.4% | 8.1–8.6% | 8.0–8.6% | 7.9–8.6% | 7.7–8.6% |
| CD&V | 11.6% | 8.5% | 8.0–8.8% | 7.8–8.8% | 7.6–8.8% | 7.3–8.8% |
| Open Vld | 9.8% | 6.3% | 5.9–6.6% | 5.7–6.6% | 5.6–6.6% | 5.3–6.6% |
| MR | 9.6% | 6.3% | 6.0–6.4% | 5.9–6.4% | 5.8–6.4% | 5.6–6.4% |
| sp.a | 8.8% | 6.9% | 6.2–7.3% | 6.0–7.3% | 5.8–7.3% | 5.5–7.3% |
| Groen | 5.3% | 8.1% | 6.9–9.3% | 6.7–9.4% | 6.5–9.5% | 6.1–9.6% |
| cdH | 5.0% | 2.9% | 2.7–3.0% | 2.7–3.0% | 2.6–3.0% | 2.5–3.0% |
| Vlaams Belang | 3.7% | 5.3% | 4.9–5.5% | 4.7–5.5% | 4.6–5.5% | 4.3–5.6% |
| Ecolo | 3.3% | 7.0% | 6.7–7.1% | 6.6–7.2% | 6.5–7.2% | 6.4–7.2% |
| PTB | 2.0% | 3.0% | 2.8–3.1% | 2.8–3.1% | 2.7–3.1% | 2.6–3.2% |
| DéFI | 1.8% | 1.6% | 1.4–1.6% | 1.4–1.6% | 1.4–1.6% | 1.3–1.7% |
| PVDA | 1.8% | 3.2% | 2.6–3.8% | 2.4–4.0% | 2.3–4.0% | 2.1–4.1% |
| Parti Populaire | 1.5% | 0.9% | 0.8–0.9% | 0.7–0.9% | 0.7–0.9% | 0.6–0.9% |
| Debout les Belges | 0.9% | N/A | N/A | N/A | N/A | N/A |
| Lijst Dedecker | 0.4% | N/A | N/A | N/A | N/A | N/A |
| La Droite | 0.4% | 0.4% | 0.3–0.5% | 0.3–0.5% | 0.2–0.5% | 0.2–0.5% |
| Piratenpartij | 0.3% | N/A | N/A | N/A | N/A | N/A |
| ISLAM | 0.2% | N/A | N/A | N/A | N/A | N/A |
| Wallonie d’Abord | 0.2% | N/A | N/A | N/A | N/A | N/A |
| PIRATE | 0.2% | N/A | N/A | N/A | N/A | N/A |
| R.W.F. | 0.1% | N/A | N/A | N/A | N/A | N/A |
| FW | 0.1% | N/A | N/A | N/A | N/A | N/A |
N-VA
For a full overview of the results for this party, see the N-VA page.
| Voting Intentions | Probability | Accumulated | Special Marks |
|---|---|---|---|
| 13.5–14.5% | 0.1% | 100% | |
| 14.5–15.5% | 4% | 99.9% | |
| 15.5–16.5% | 64% | 96% | Median |
| 16.5–17.5% | 100% | 32% | |
| 17.5–18.5% | 100% | 0% | |
| 18.5–19.5% | 100% | 0% | |
| 19.5–20.5% | 15% | 0% | Last Result |
| 20.5–21.5% | 0.7% | 0% |
PS
For a full overview of the results for this party, see the PS page.
| Voting Intentions | Probability | Accumulated | Special Marks |
|---|---|---|---|
| 5.5–6.5% | 0% | 100% | |
| 6.5–7.5% | 0.1% | 100% | |
| 7.5–8.5% | 83% | 99.9% | Median |
| 8.5–9.5% | 100% | 16% | |
| 9.5–10.5% | 100% | 0% | |
| 10.5–11.5% | 81% | 0% | |
| 11.5–12.5% | 0.4% | 0% | Last Result |
CD&V
For a full overview of the results for this party, see the CD&V page.
| Voting Intentions | Probability | Accumulated | Special Marks |
|---|---|---|---|
| 5.5–6.5% | 0% | 100% | |
| 6.5–7.5% | 2% | 100% | |
| 7.5–8.5% | 54% | 98% | |
| 8.5–9.5% | 100% | 44% | Median |
| 9.5–10.5% | 100% | 0% | |
| 10.5–11.5% | 100% | 0% | |
| 11.5–12.5% | 44% | 0% | Last Result |
| 12.5–13.5% | 3% | 0% |
Open Vld
For a full overview of the results for this party, see the Open Vld page.
| Voting Intentions | Probability | Accumulated | Special Marks |
|---|---|---|---|
| 3.5–4.5% | 0% | 100% | |
| 4.5–5.5% | 2% | 100% | |
| 5.5–6.5% | 83% | 98% | Median |
| 6.5–7.5% | 100% | 15% | |
| 7.5–8.5% | 100% | 0% | |
| 8.5–9.5% | 100% | 0% | |
| 9.5–10.5% | 68% | 0% | Last Result |
| 10.5–11.5% | 5% | 0% |
MR
For a full overview of the results for this party, see the MR page.
| Voting Intentions | Probability | Accumulated | Special Marks |
|---|---|---|---|
| 3.5–4.5% | 0% | 100% | |
| 4.5–5.5% | 0.2% | 100% | |
| 5.5–6.5% | 100% | 99.8% | Median |
| 6.5–7.5% | 100% | 0% | |
| 7.5–8.5% | 100% | 0% | |
| 8.5–9.5% | 92% | 0% | |
| 9.5–10.5% | 0.4% | 0% | Last Result |
sp.a
For a full overview of the results for this party, see the sp.a page.
| Voting Intentions | Probability | Accumulated | Special Marks |
|---|---|---|---|
| 3.5–4.5% | 0% | 100% | |
| 4.5–5.5% | 0.8% | 100% | |
| 5.5–6.5% | 21% | 99.2% | |
| 6.5–7.5% | 100% | 78% | Median |
| 7.5–8.5% | 100% | 0% | |
| 8.5–9.5% | 67% | 0% | Last Result |
| 9.5–10.5% | 4% | 0% |
Groen
For a full overview of the results for this party, see the Groen page.
| Voting Intentions | Probability | Accumulated | Special Marks |
|---|---|---|---|
| 4.5–5.5% | 0% | 100% | Last Result |
| 5.5–6.5% | 3% | 100% | |
| 6.5–7.5% | 27% | 97% | |
| 7.5–8.5% | 35% | 70% | Median |
| 8.5–9.5% | 32% | 35% | |
| 9.5–10.5% | 13% | 2% | |
| 10.5–11.5% | 1.1% | 0% |
cdH
For a full overview of the results for this party, see the cdH page.
| Voting Intentions | Probability | Accumulated | Special Marks |
|---|---|---|---|
| 0.5–1.5% | 0% | 100% | |
| 1.5–2.5% | 0.8% | 100% | |
| 2.5–3.5% | 100% | 99.2% | Median |
| 3.5–4.5% | 100% | 0% | |
| 4.5–5.5% | 0.4% | 0% | Last Result |
Vlaams Belang
For a full overview of the results for this party, see the Vlaams Belang page.
| Voting Intentions | Probability | Accumulated | Special Marks |
|---|---|---|---|
| 2.5–3.5% | 0% | 100% | |
| 3.5–4.5% | 2% | 100% | Last Result |
| 4.5–5.5% | 96% | 98% | Median |
| 5.5–6.5% | 100% | 2% | |
| 6.5–7.5% | 48% | 0% | |
| 7.5–8.5% | 45% | 0% | |
| 8.5–9.5% | 100% | 0% | |
| 9.5–10.5% | 100% | 0% | |
| 10.5–11.5% | 17% | 0% | |
| 11.5–12.5% | 0.5% | 0% |
Ecolo
For a full overview of the results for this party, see the Ecolo page.
| Voting Intentions | Probability | Accumulated | Special Marks |
|---|---|---|---|
| 2.5–3.5% | 0% | 100% | Last Result |
| 3.5–4.5% | 0% | 100% | |
| 4.5–5.5% | 0% | 100% | |
| 5.5–6.5% | 3% | 100% | |
| 6.5–7.5% | 100% | 97% | Median |
| 7.5–8.5% | 100% | 0% | |
| 8.5–9.5% | 100% | 0% | |
| 9.5–10.5% | 7% | 0% |
PTB
For a full overview of the results for this party, see the PTB page.
| Voting Intentions | Probability | Accumulated | Special Marks |
|---|---|---|---|
| 0.5–1.5% | 0% | 100% | |
| 1.5–2.5% | 0.3% | 100% | Last Result |
| 2.5–3.5% | 100% | 99.7% | Median |
| 3.5–4.5% | 100% | 0% | |
| 4.5–5.5% | 100% | 0% | |
| 5.5–6.5% | 100% | 0% | |
| 6.5–7.5% | 1.1% | 0% |
DéFI
For a full overview of the results for this party, see the DéFI page.
| Voting Intentions | Probability | Accumulated | Special Marks |
|---|---|---|---|
| 0.0–0.5% | 0% | 100% | |
| 0.5–1.5% | 38% | 100% | |
| 1.5–2.5% | 100% | 62% | Last Result, Median |
| 2.5–3.5% | 49% | 0% |
PVDA
For a full overview of the results for this party, see the PVDA page.
| Voting Intentions | Probability | Accumulated | Special Marks |
|---|---|---|---|
| 0.5–1.5% | 0% | 100% | |
| 1.5–2.5% | 10% | 100% | Last Result |
| 2.5–3.5% | 63% | 90% | Median |
| 3.5–4.5% | 36% | 27% | |
| 4.5–5.5% | 2% | 0% |
Parti Populaire
For a full overview of the results for this party, see the Parti Populaire page.
| Voting Intentions | Probability | Accumulated | Special Marks |
|---|---|---|---|
| 0.0–0.5% | 0.1% | 100% | |
| 0.5–1.5% | 100% | 99.9% | Median |
| 1.5–2.5% | 43% | 0% | Last Result |
La Droite
For a full overview of the results for this party, see the La Droite page.
| Voting Intentions | Probability | Accumulated | Special Marks |
|---|---|---|---|
| 0.0–0.5% | 100% | 100% | Last Result, Median |
| 0.5–1.5% | 38% | 0% |
Seats
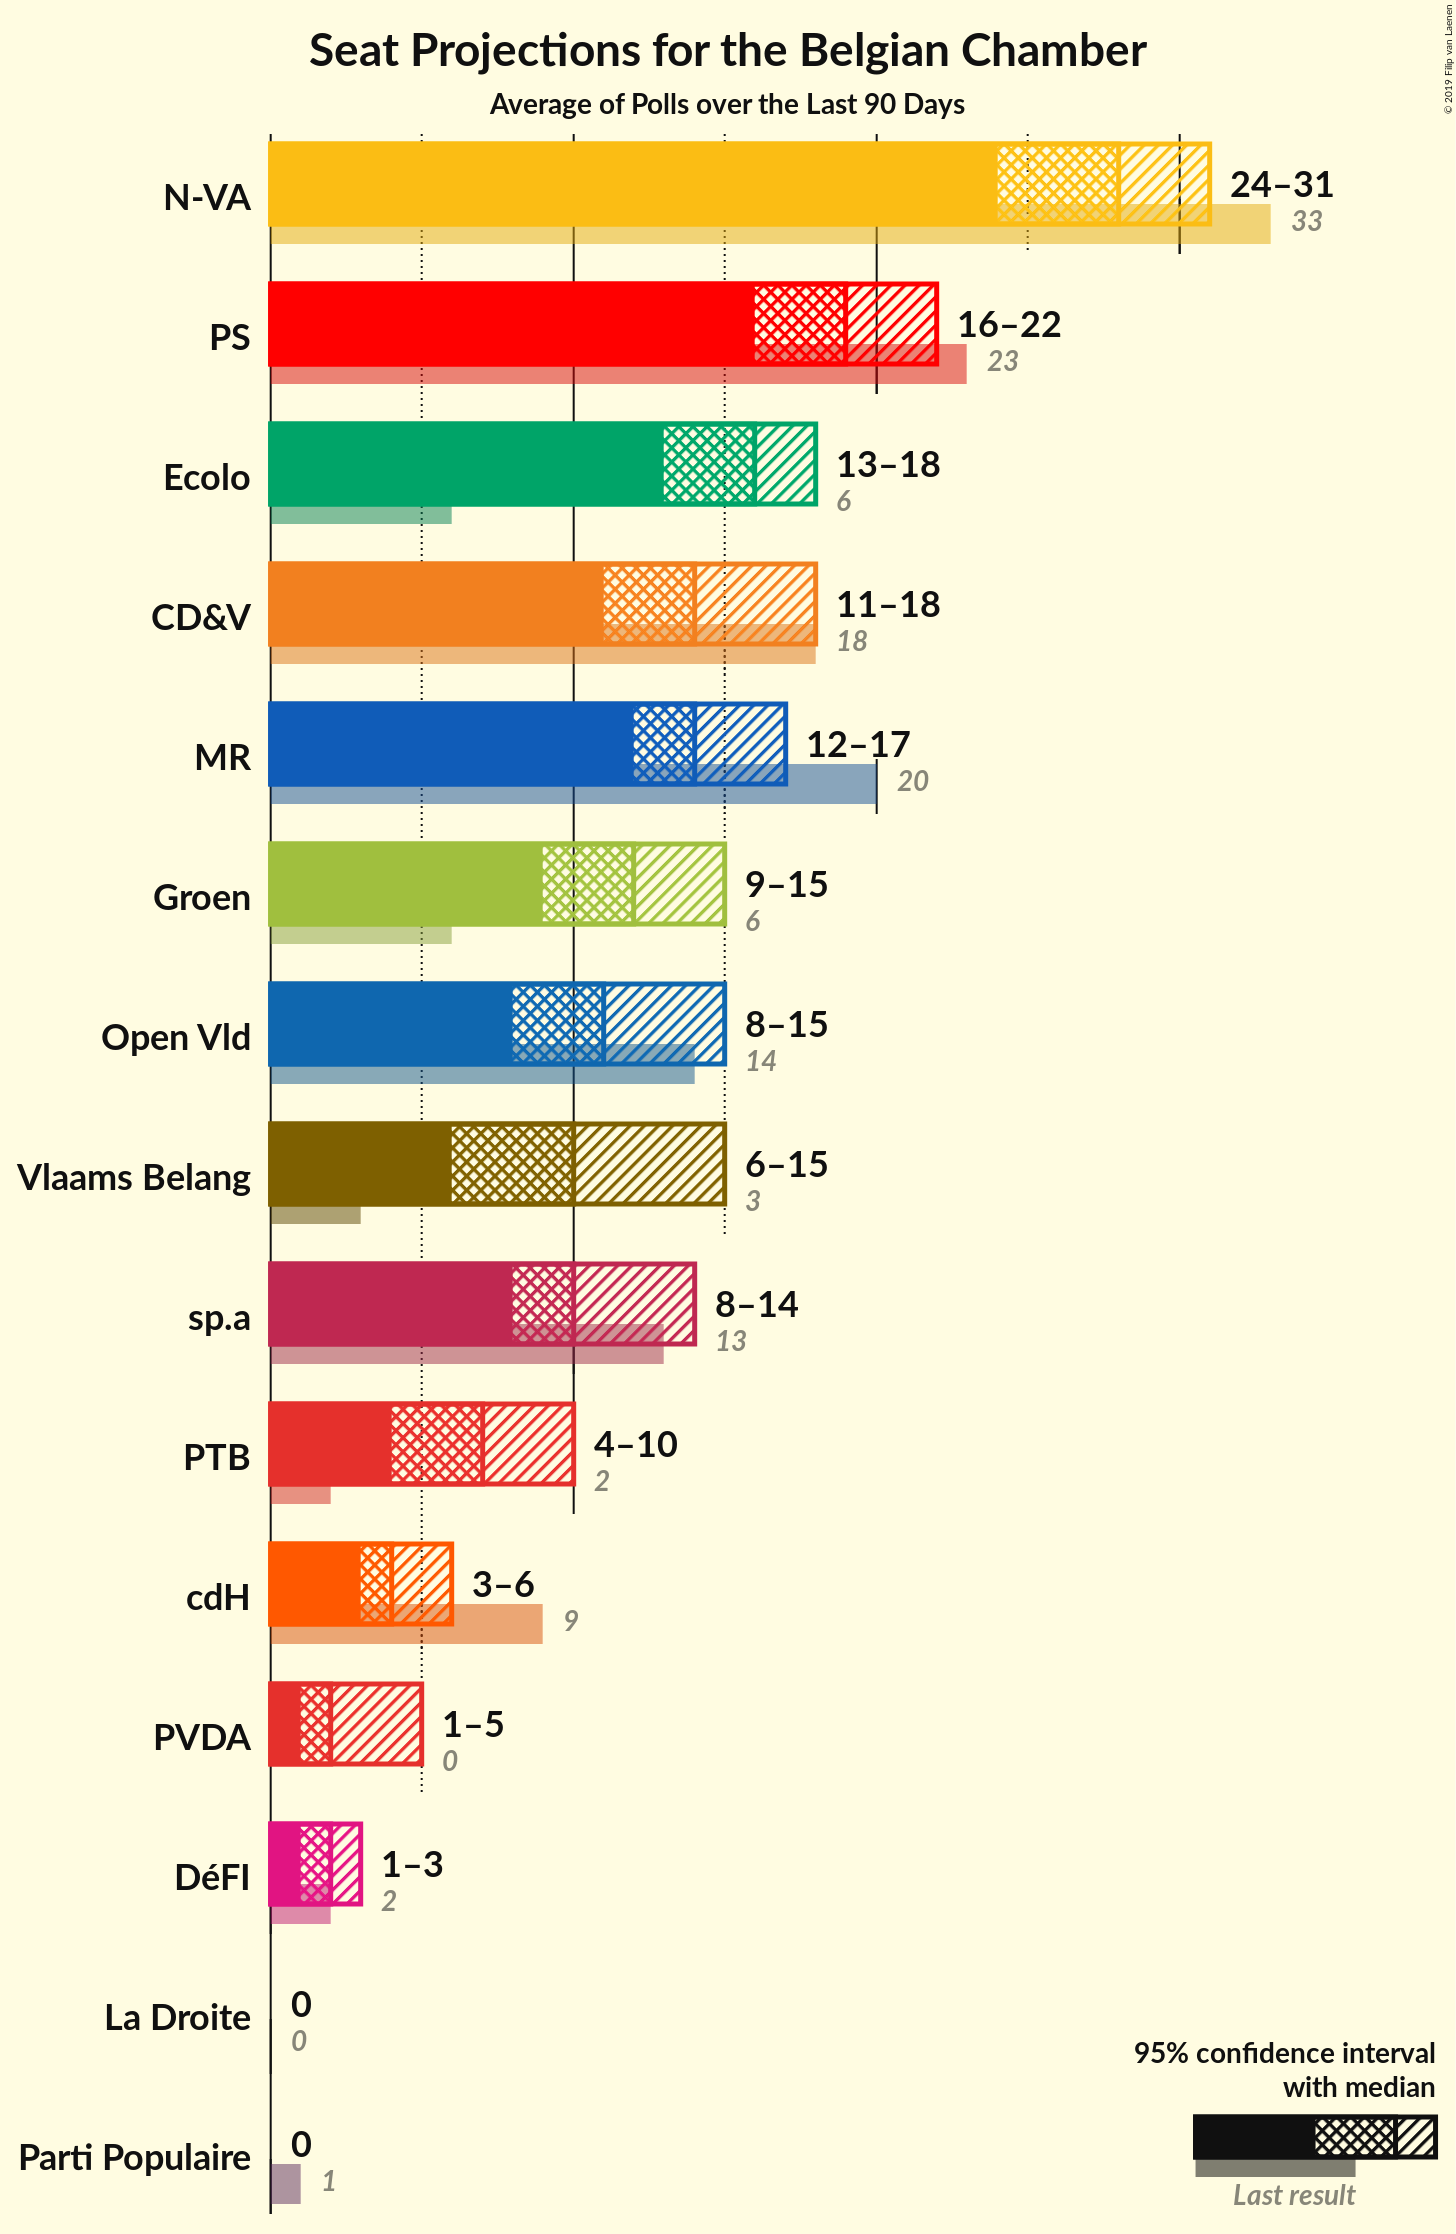
Confidence Intervals
| Party | Last Result | Median | 80% Confidence Interval | 90% Confidence Interval | 95% Confidence Interval | 99% Confidence Interval |
|---|---|---|---|---|---|---|
| N-VA | 33 | 28 | 25–30 | 25–30 | 24–31 | 23–32 |
| PS | 23 | 19 | 17–21 | 16–21 | 16–22 | 16–22 |
| CD&V | 18 | 14 | 13–18 | 12–18 | 11–18 | 11–18 |
| Open Vld | 14 | 11 | 8–14 | 8–14 | 8–15 | 7–17 |
| MR | 20 | 14 | 12–16 | 12–17 | 12–17 | 11–18 |
| sp.a | 13 | 10 | 8–12 | 8–13 | 8–14 | 6–15 |
| Groen | 6 | 12 | 10–13 | 10–15 | 9–15 | 7–17 |
| cdH | 9 | 4 | 4–5 | 4–6 | 3–6 | 3–7 |
| Vlaams Belang | 3 | 10 | 7–14 | 7–15 | 6–15 | 6–16 |
| Ecolo | 6 | 16 | 14–18 | 13–18 | 13–18 | 12–19 |
| PTB | 2 | 7 | 4–10 | 4–10 | 4–10 | 3–11 |
| DéFI | 2 | 2 | 1–3 | 1–3 | 1–3 | 1–3 |
| PVDA | 0 | 2 | 1–3 | 1–4 | 1–5 | 1–5 |
| Parti Populaire | 1 | 0 | 0 | 0 | 0 | 0–2 |
| Debout les Belges | 0 | N/A | N/A | N/A | N/A | N/A |
| Lijst Dedecker | 0 | N/A | N/A | N/A | N/A | N/A |
| La Droite | 0 | 0 | 0 | 0 | 0 | 0 |
| Piratenpartij | 0 | N/A | N/A | N/A | N/A | N/A |
| ISLAM | 0 | N/A | N/A | N/A | N/A | N/A |
| Wallonie d’Abord | 0 | N/A | N/A | N/A | N/A | N/A |
| PIRATE | 0 | N/A | N/A | N/A | N/A | N/A |
| R.W.F. | 0 | N/A | N/A | N/A | N/A | N/A |
| FW | 0 | N/A | N/A | N/A | N/A | N/A |
N-VA
For a full overview of the results for this party, see the N-VA page.
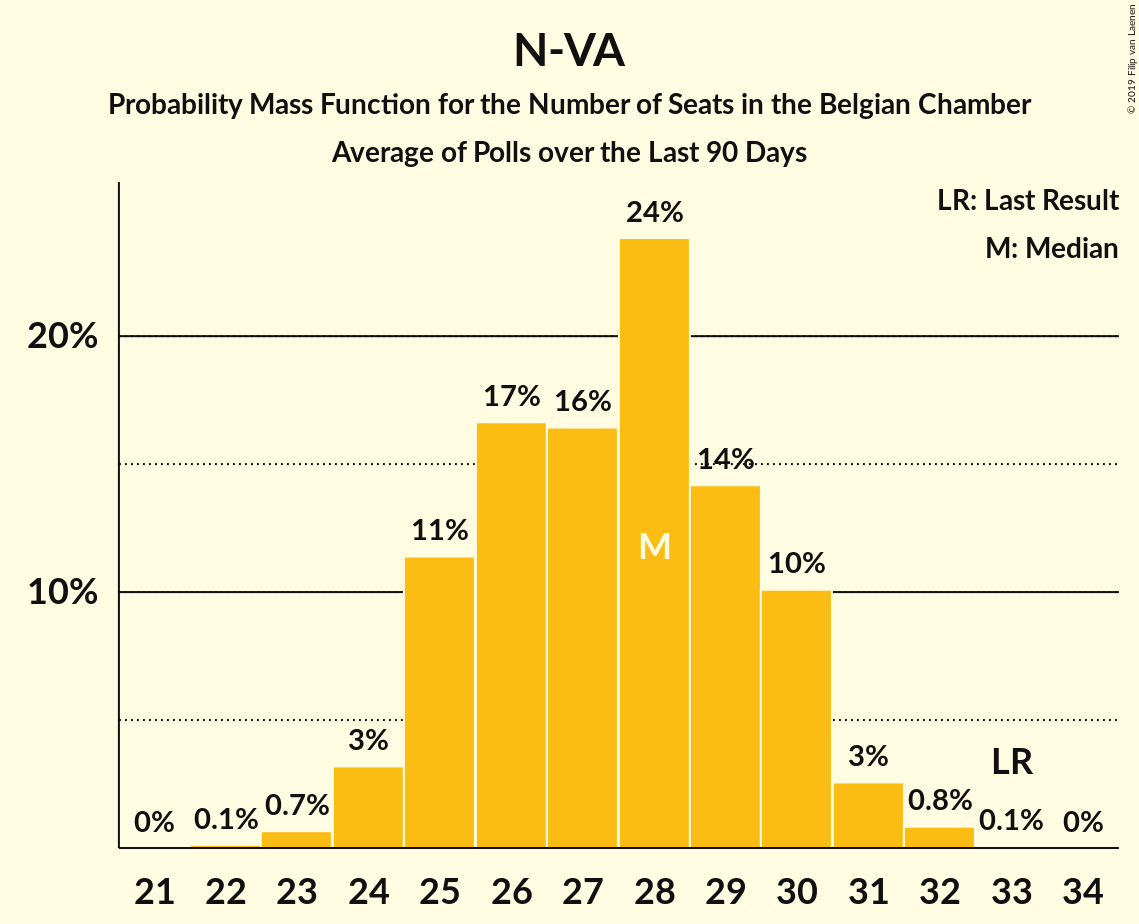
| Number of Seats | Probability | Accumulated | Special Marks |
|---|---|---|---|
| 22 | 0.1% | 100% | |
| 23 | 0.7% | 99.9% | |
| 24 | 3% | 99.2% | |
| 25 | 11% | 96% | |
| 26 | 17% | 85% | |
| 27 | 16% | 68% | |
| 28 | 24% | 52% | Median |
| 29 | 14% | 28% | |
| 30 | 10% | 14% | |
| 31 | 3% | 3% | |
| 32 | 0.8% | 0.9% | |
| 33 | 0.1% | 0.1% | Last Result |
| 34 | 0% | 0% |
PS
For a full overview of the results for this party, see the PS page.
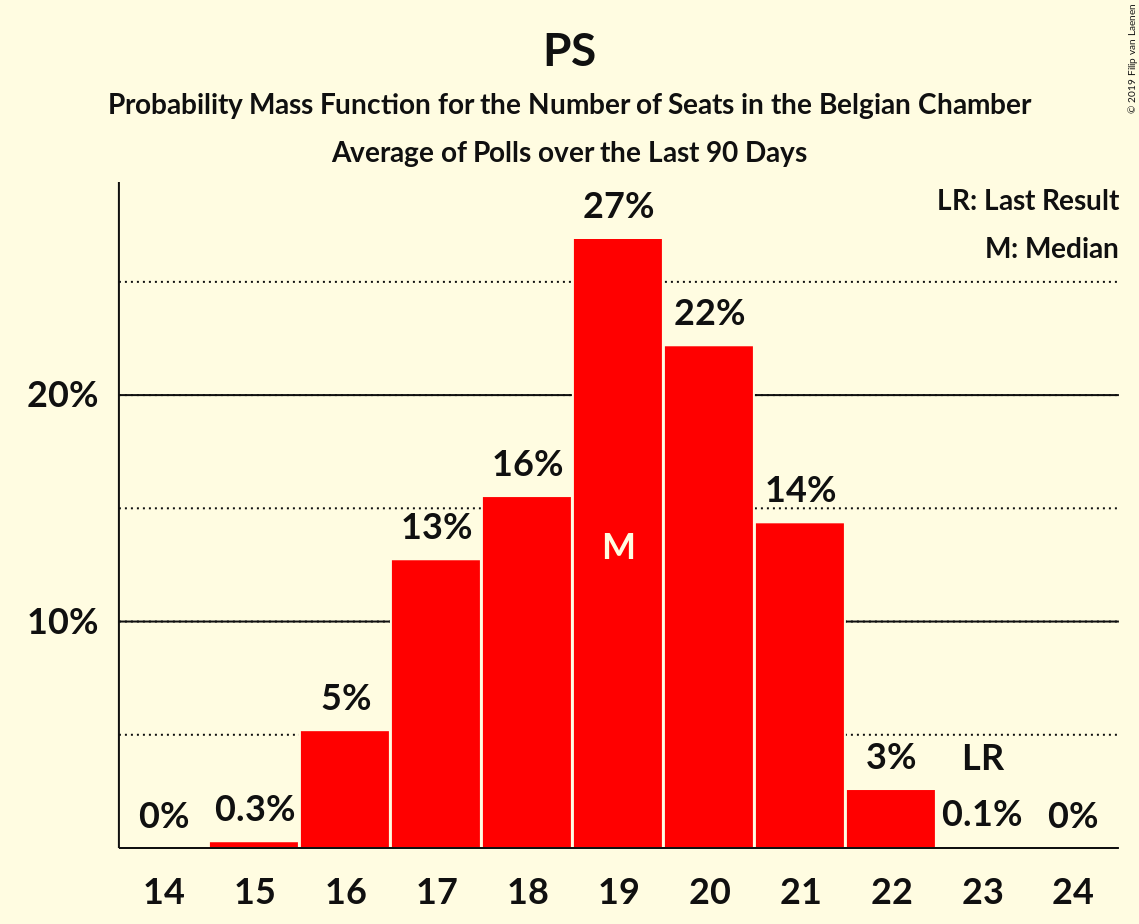
| Number of Seats | Probability | Accumulated | Special Marks |
|---|---|---|---|
| 15 | 0.3% | 100% | |
| 16 | 5% | 99.7% | |
| 17 | 13% | 94% | |
| 18 | 16% | 82% | |
| 19 | 27% | 66% | Median |
| 20 | 22% | 39% | |
| 21 | 14% | 17% | |
| 22 | 3% | 3% | |
| 23 | 0.1% | 0.1% | Last Result |
| 24 | 0% | 0% |
CD&V
For a full overview of the results for this party, see the CD&V page.
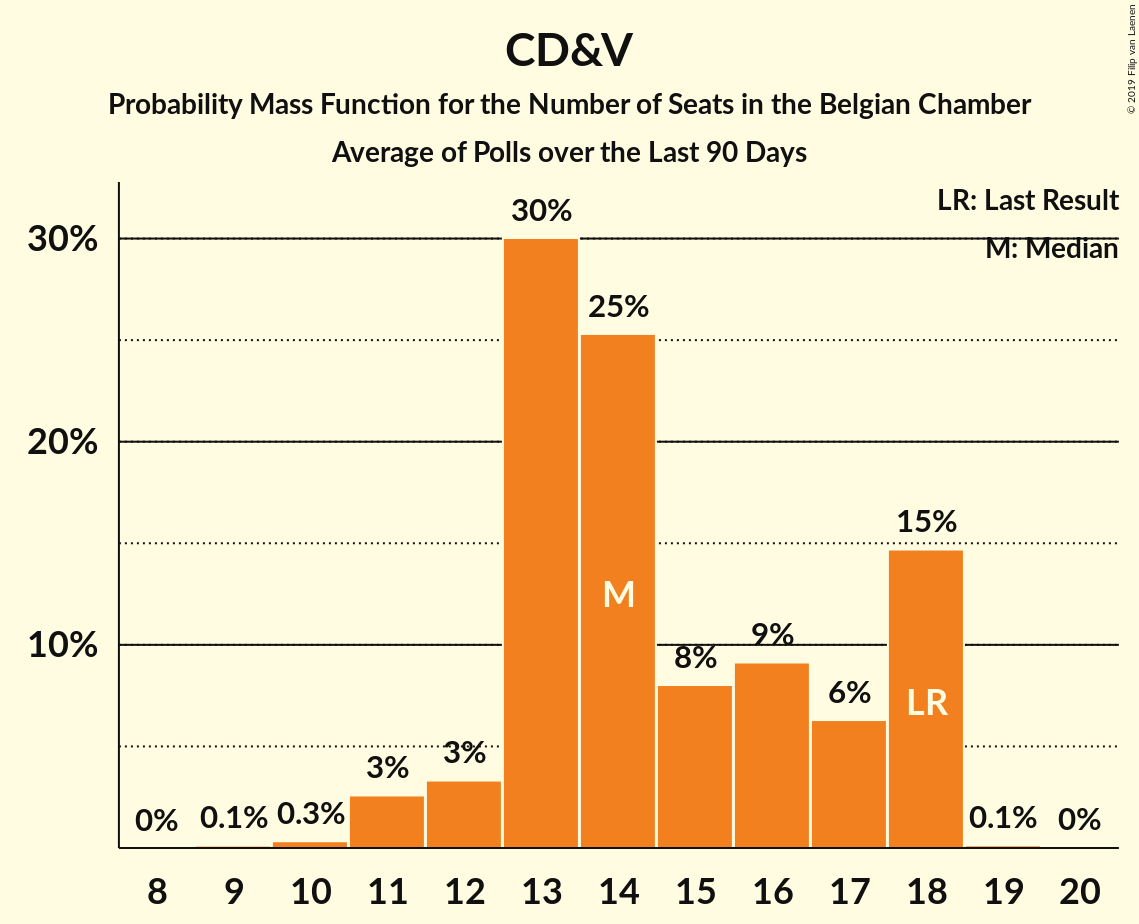
| Number of Seats | Probability | Accumulated | Special Marks |
|---|---|---|---|
| 9 | 0.1% | 100% | |
| 10 | 0.3% | 99.9% | |
| 11 | 3% | 99.6% | |
| 12 | 3% | 97% | |
| 13 | 30% | 94% | |
| 14 | 25% | 64% | Median |
| 15 | 8% | 38% | |
| 16 | 9% | 30% | |
| 17 | 6% | 21% | |
| 18 | 15% | 15% | Last Result |
| 19 | 0.1% | 0.2% | |
| 20 | 0% | 0% |
Open Vld
For a full overview of the results for this party, see the Open Vld page.
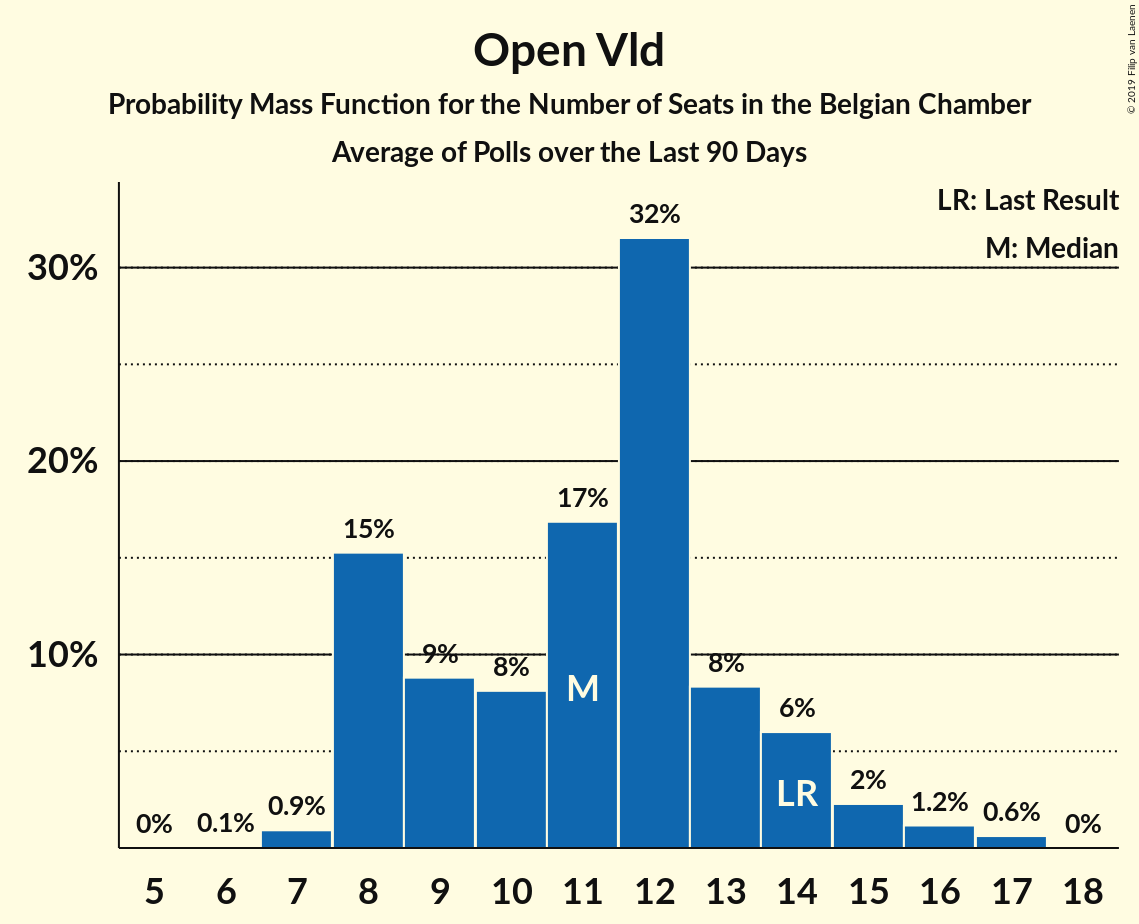
| Number of Seats | Probability | Accumulated | Special Marks |
|---|---|---|---|
| 6 | 0.1% | 100% | |
| 7 | 0.9% | 99.9% | |
| 8 | 15% | 99.0% | |
| 9 | 9% | 84% | |
| 10 | 8% | 75% | |
| 11 | 17% | 67% | Median |
| 12 | 32% | 50% | |
| 13 | 8% | 18% | |
| 14 | 6% | 10% | Last Result |
| 15 | 2% | 4% | |
| 16 | 1.2% | 2% | |
| 17 | 0.6% | 0.6% | |
| 18 | 0% | 0% |
MR
For a full overview of the results for this party, see the MR page.
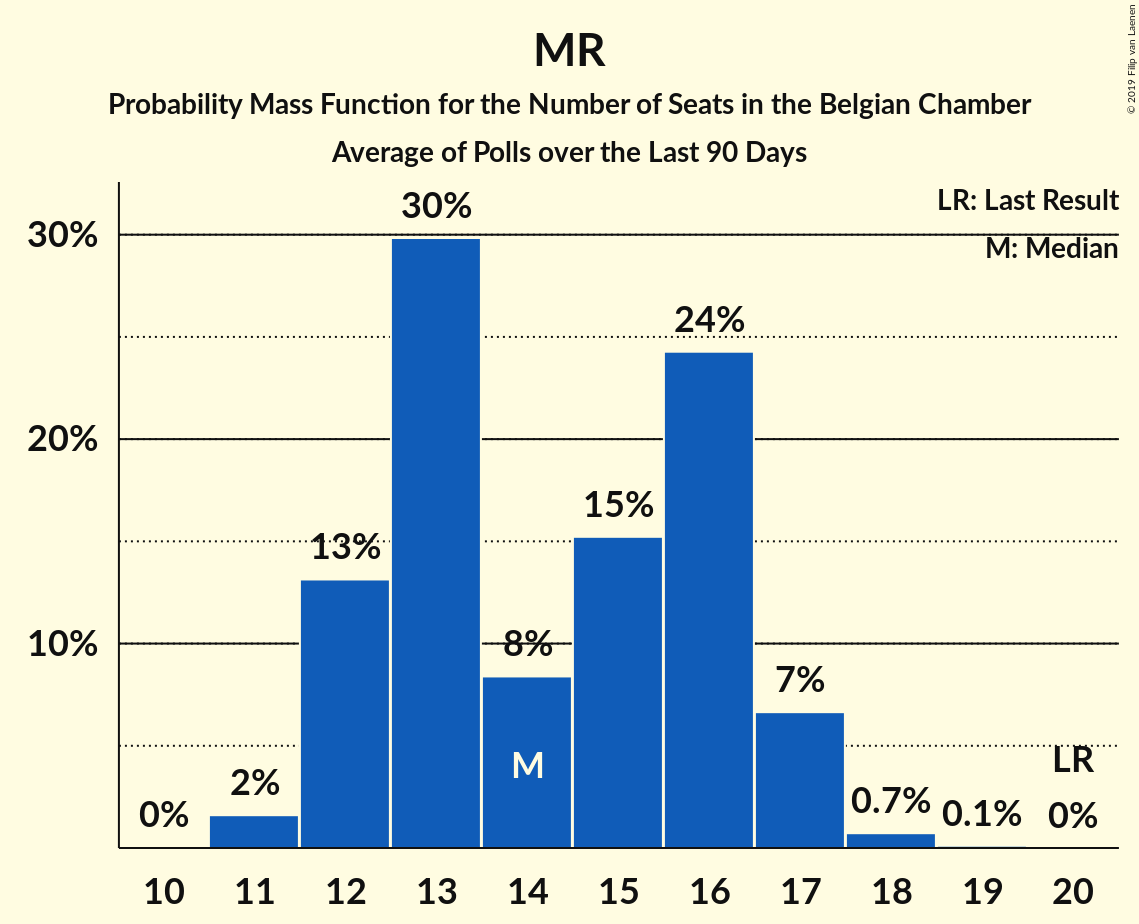
| Number of Seats | Probability | Accumulated | Special Marks |
|---|---|---|---|
| 11 | 2% | 100% | |
| 12 | 13% | 98% | |
| 13 | 30% | 85% | |
| 14 | 8% | 55% | Median |
| 15 | 15% | 47% | |
| 16 | 24% | 32% | |
| 17 | 7% | 7% | |
| 18 | 0.7% | 0.8% | |
| 19 | 0.1% | 0.1% | |
| 20 | 0% | 0% | Last Result |
sp.a
For a full overview of the results for this party, see the sp.a page.
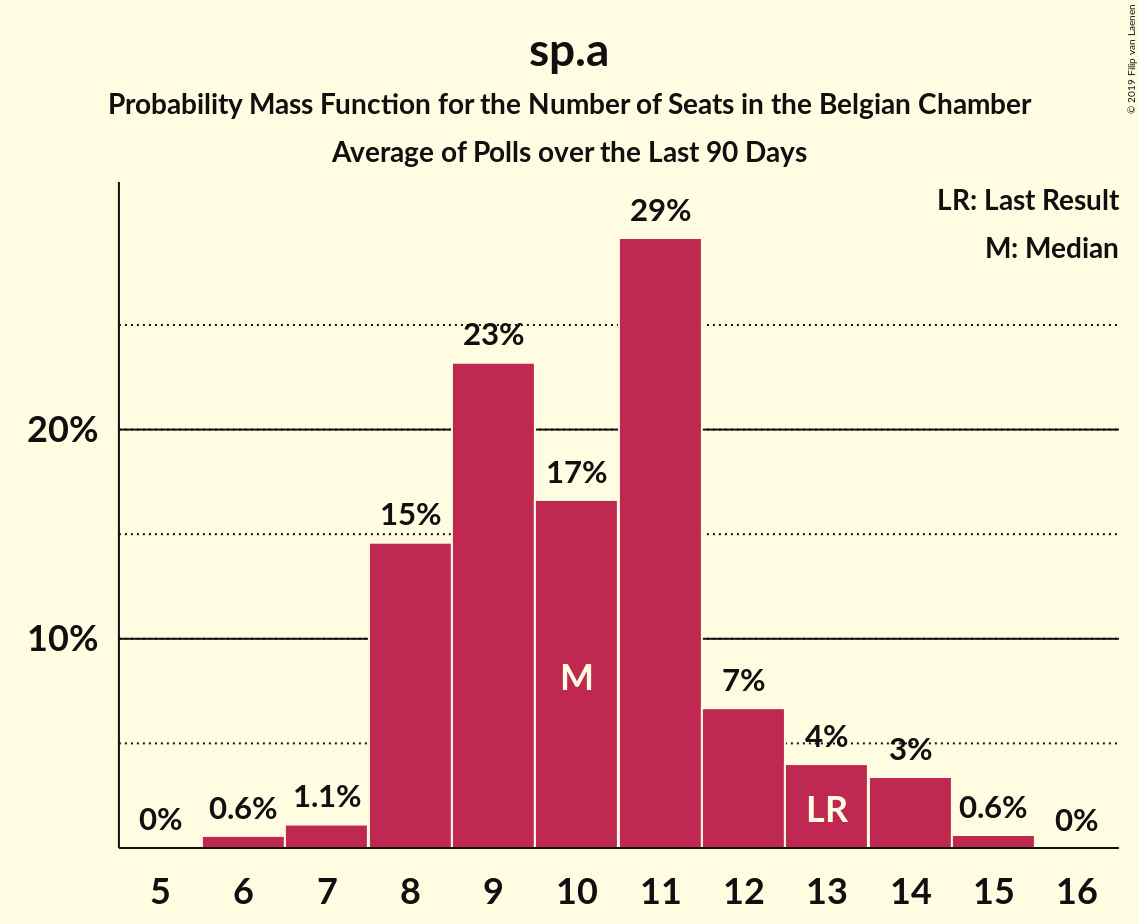
| Number of Seats | Probability | Accumulated | Special Marks |
|---|---|---|---|
| 6 | 0.6% | 100% | |
| 7 | 1.1% | 99.4% | |
| 8 | 15% | 98% | |
| 9 | 23% | 84% | |
| 10 | 17% | 61% | Median |
| 11 | 29% | 44% | |
| 12 | 7% | 15% | |
| 13 | 4% | 8% | Last Result |
| 14 | 3% | 4% | |
| 15 | 0.6% | 0.6% | |
| 16 | 0% | 0% |
Groen
For a full overview of the results for this party, see the Groen page.
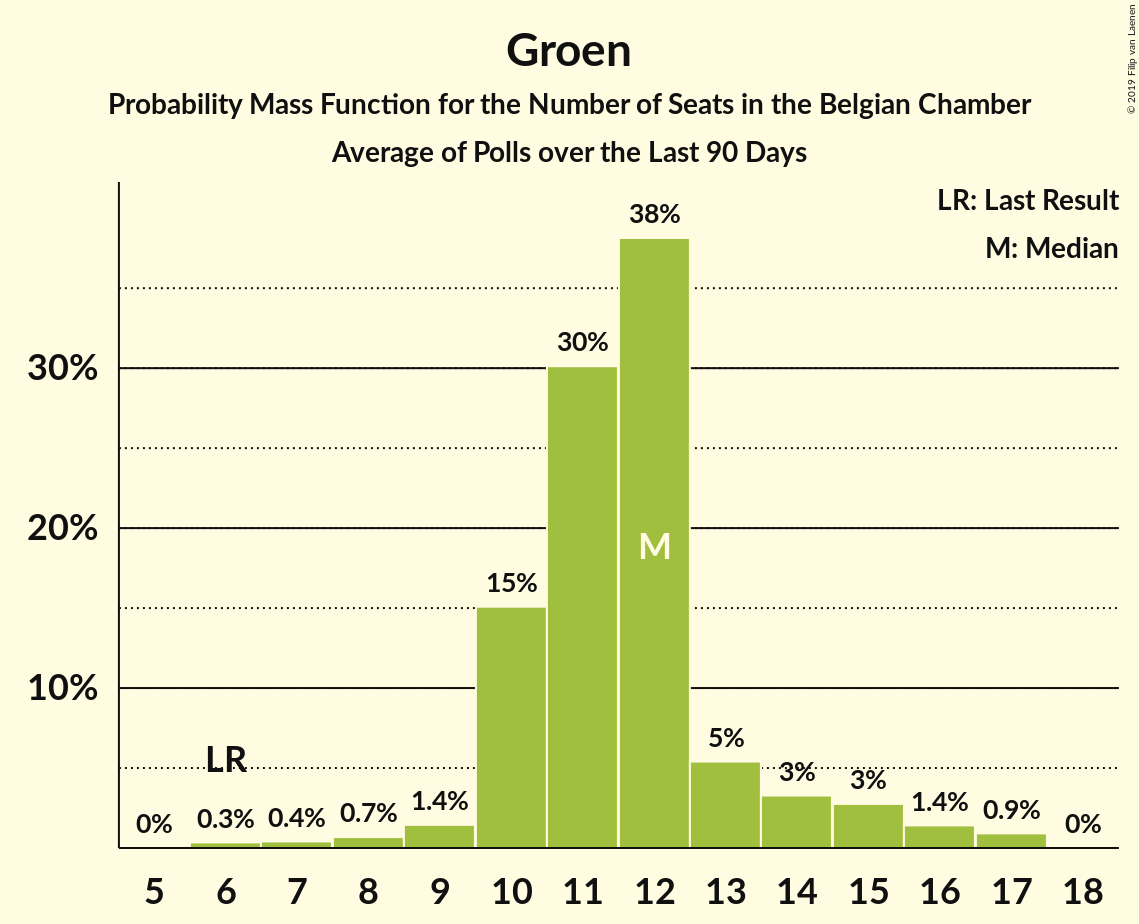
| Number of Seats | Probability | Accumulated | Special Marks |
|---|---|---|---|
| 6 | 0.3% | 100% | Last Result |
| 7 | 0.4% | 99.7% | |
| 8 | 0.7% | 99.2% | |
| 9 | 1.4% | 98.6% | |
| 10 | 15% | 97% | |
| 11 | 30% | 82% | |
| 12 | 38% | 52% | Median |
| 13 | 5% | 14% | |
| 14 | 3% | 8% | |
| 15 | 3% | 5% | |
| 16 | 1.4% | 2% | |
| 17 | 0.9% | 0.9% | |
| 18 | 0% | 0% |
cdH
For a full overview of the results for this party, see the cdH page.
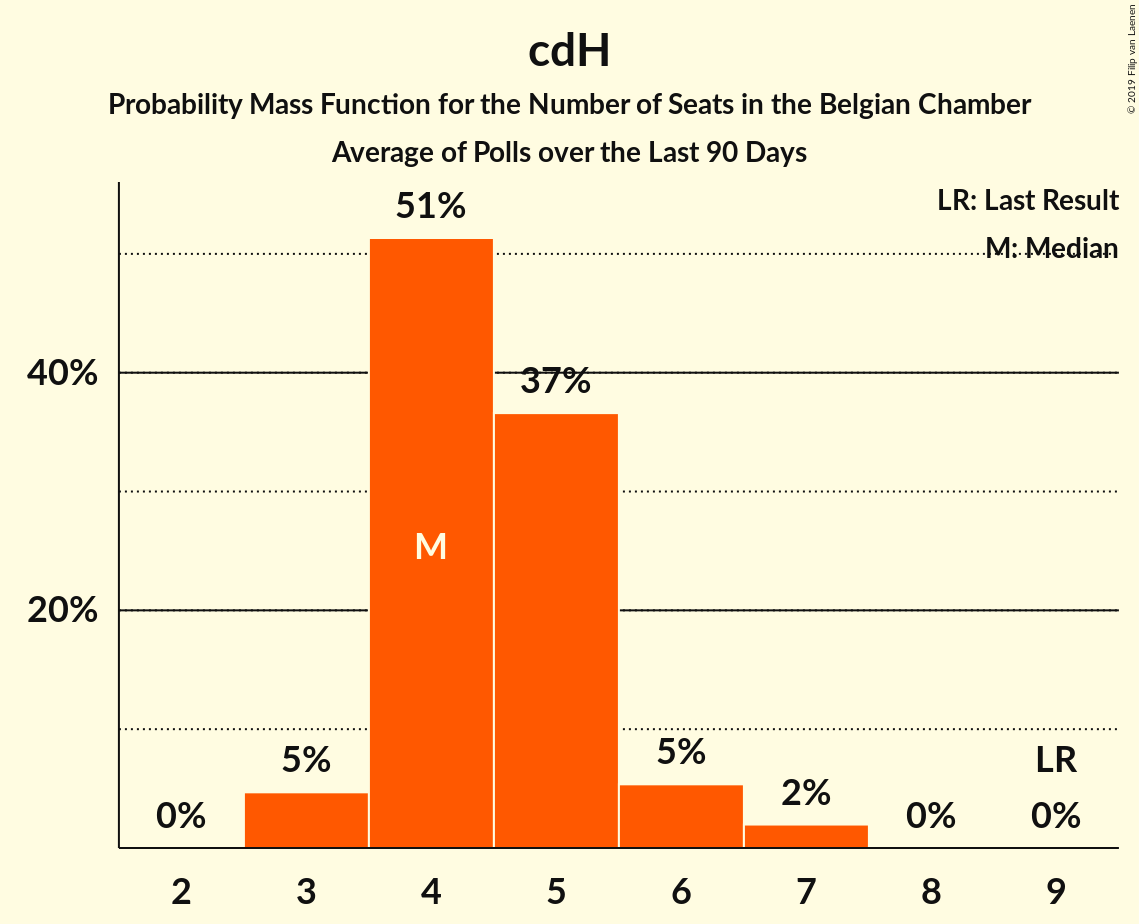
| Number of Seats | Probability | Accumulated | Special Marks |
|---|---|---|---|
| 3 | 5% | 100% | |
| 4 | 51% | 95% | Median |
| 5 | 37% | 44% | |
| 6 | 5% | 7% | |
| 7 | 2% | 2% | |
| 8 | 0% | 0% | |
| 9 | 0% | 0% | Last Result |
Vlaams Belang
For a full overview of the results for this party, see the Vlaams Belang page.
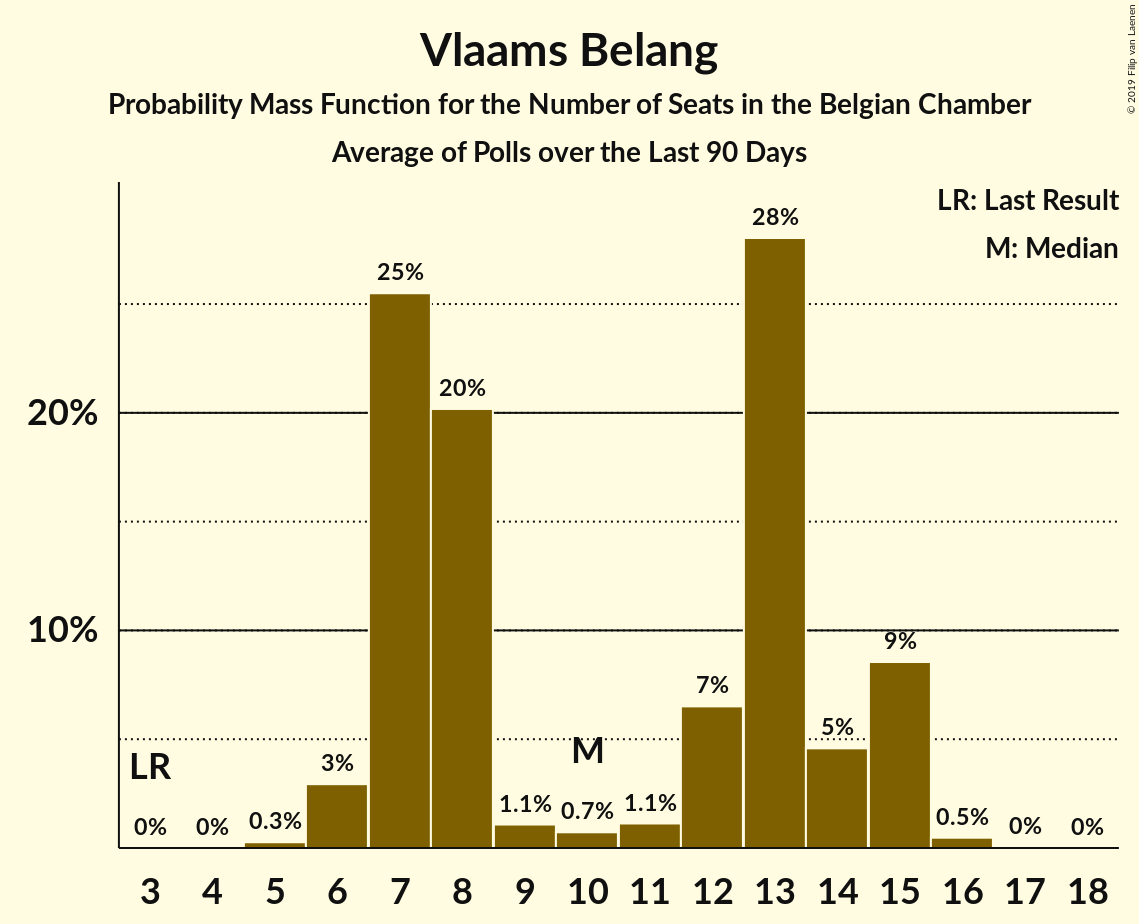
| Number of Seats | Probability | Accumulated | Special Marks |
|---|---|---|---|
| 3 | 0% | 100% | Last Result |
| 4 | 0% | 100% | |
| 5 | 0.3% | 100% | |
| 6 | 3% | 99.7% | |
| 7 | 25% | 97% | |
| 8 | 20% | 71% | |
| 9 | 1.1% | 51% | |
| 10 | 0.7% | 50% | Median |
| 11 | 1.1% | 49% | |
| 12 | 7% | 48% | |
| 13 | 28% | 42% | |
| 14 | 5% | 14% | |
| 15 | 9% | 9% | |
| 16 | 0.5% | 0.5% | |
| 17 | 0% | 0.1% | |
| 18 | 0% | 0% |
Ecolo
For a full overview of the results for this party, see the Ecolo page.
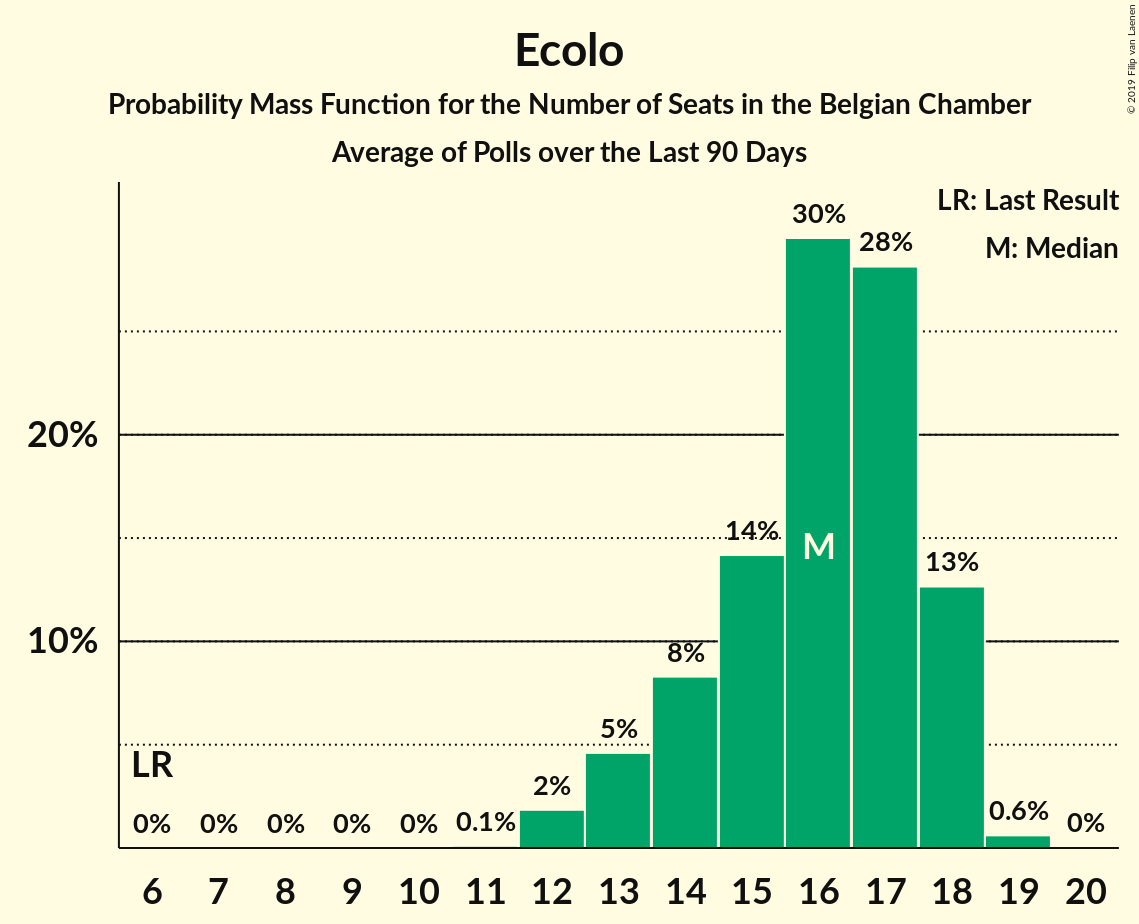
| Number of Seats | Probability | Accumulated | Special Marks |
|---|---|---|---|
| 6 | 0% | 100% | Last Result |
| 7 | 0% | 100% | |
| 8 | 0% | 100% | |
| 9 | 0% | 100% | |
| 10 | 0% | 100% | |
| 11 | 0.1% | 100% | |
| 12 | 2% | 99.9% | |
| 13 | 5% | 98% | |
| 14 | 8% | 93% | |
| 15 | 14% | 85% | |
| 16 | 30% | 71% | Median |
| 17 | 28% | 41% | |
| 18 | 13% | 13% | |
| 19 | 0.6% | 0.7% | |
| 20 | 0% | 0% |
PTB
For a full overview of the results for this party, see the PTB page.
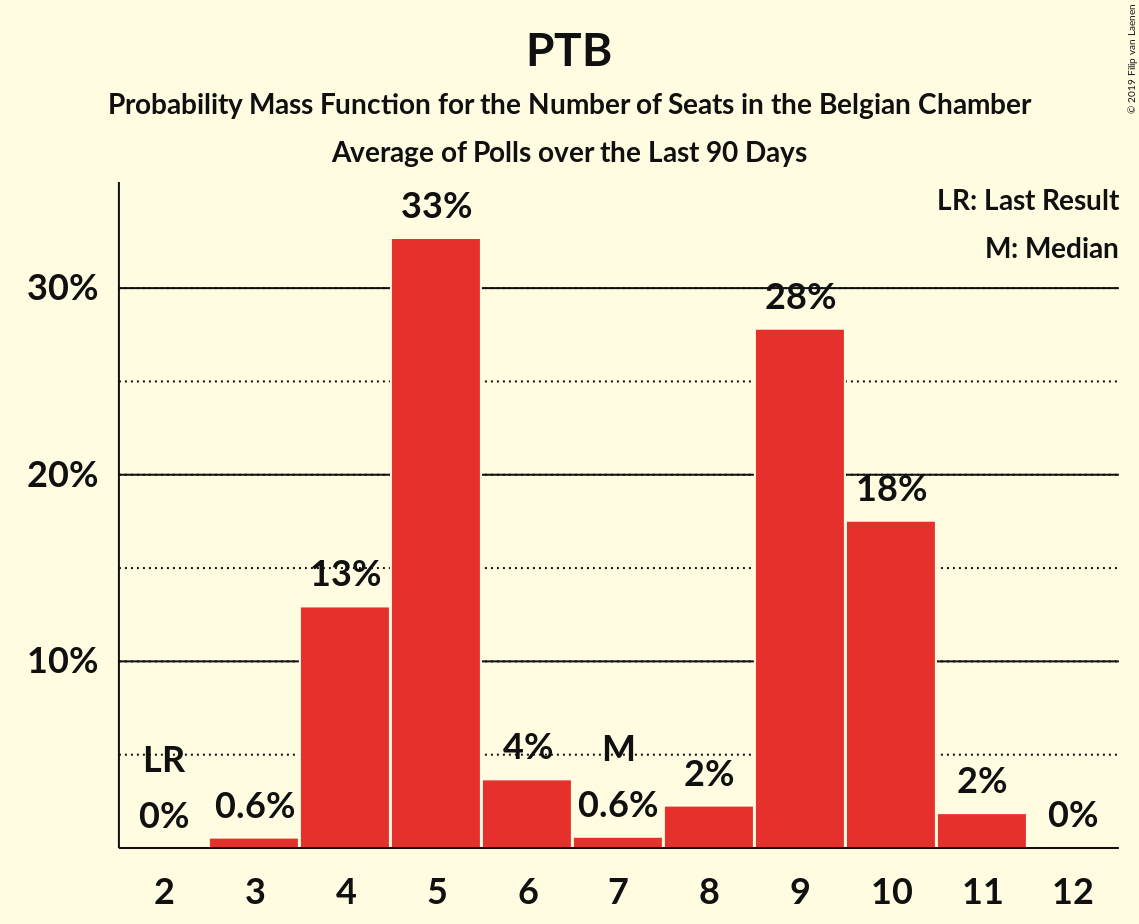
| Number of Seats | Probability | Accumulated | Special Marks |
|---|---|---|---|
| 2 | 0% | 100% | Last Result |
| 3 | 0.6% | 100% | |
| 4 | 13% | 99.4% | |
| 5 | 33% | 86% | |
| 6 | 4% | 54% | |
| 7 | 0.6% | 50% | Median |
| 8 | 2% | 50% | |
| 9 | 28% | 47% | |
| 10 | 18% | 19% | |
| 11 | 2% | 2% | |
| 12 | 0% | 0% |
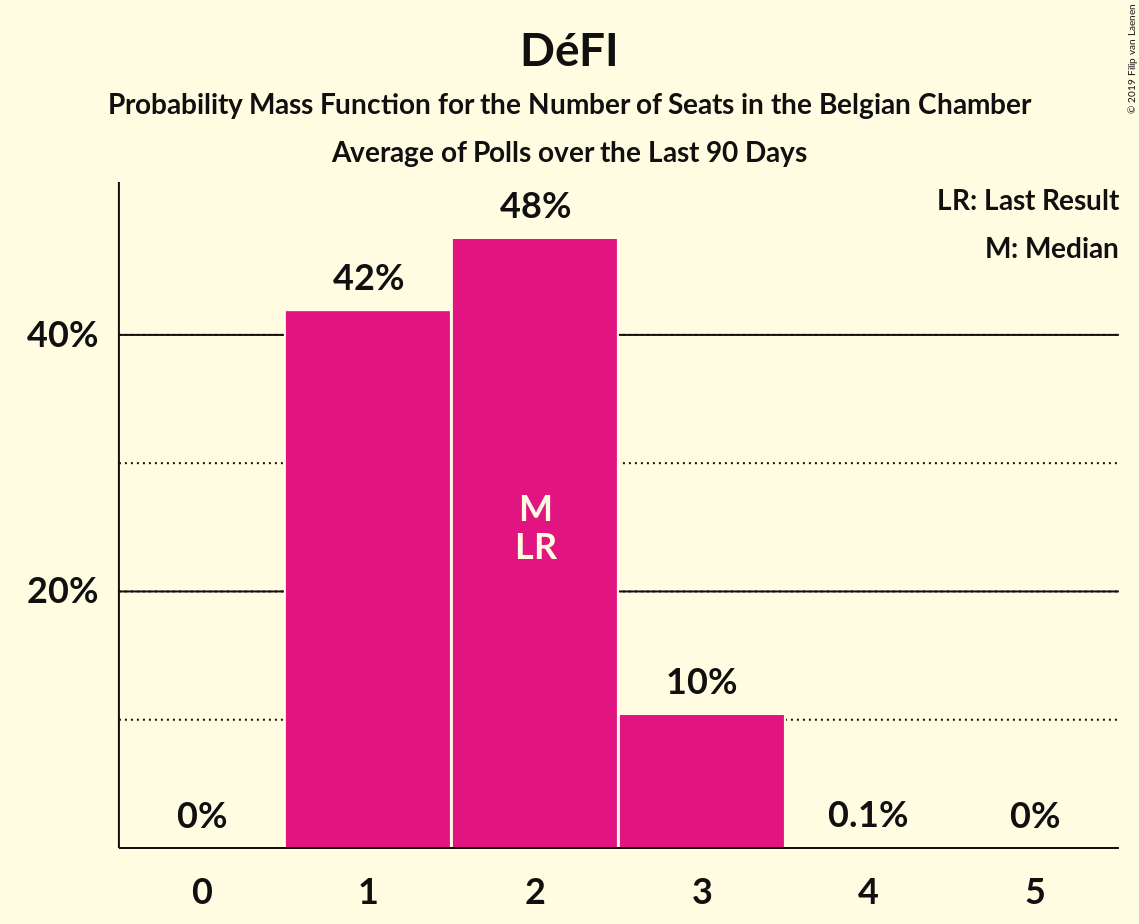
DéFI
For a full overview of the results for this party, see the DéFI page.
| Number of Seats | Probability | Accumulated | Special Marks |
|---|---|---|---|
| 1 | 42% | 100% | |
| 2 | 48% | 58% | Last Result, Median |
| 3 | 10% | 11% | |
| 4 | 0.1% | 0.1% | |
| 5 | 0% | 0% |
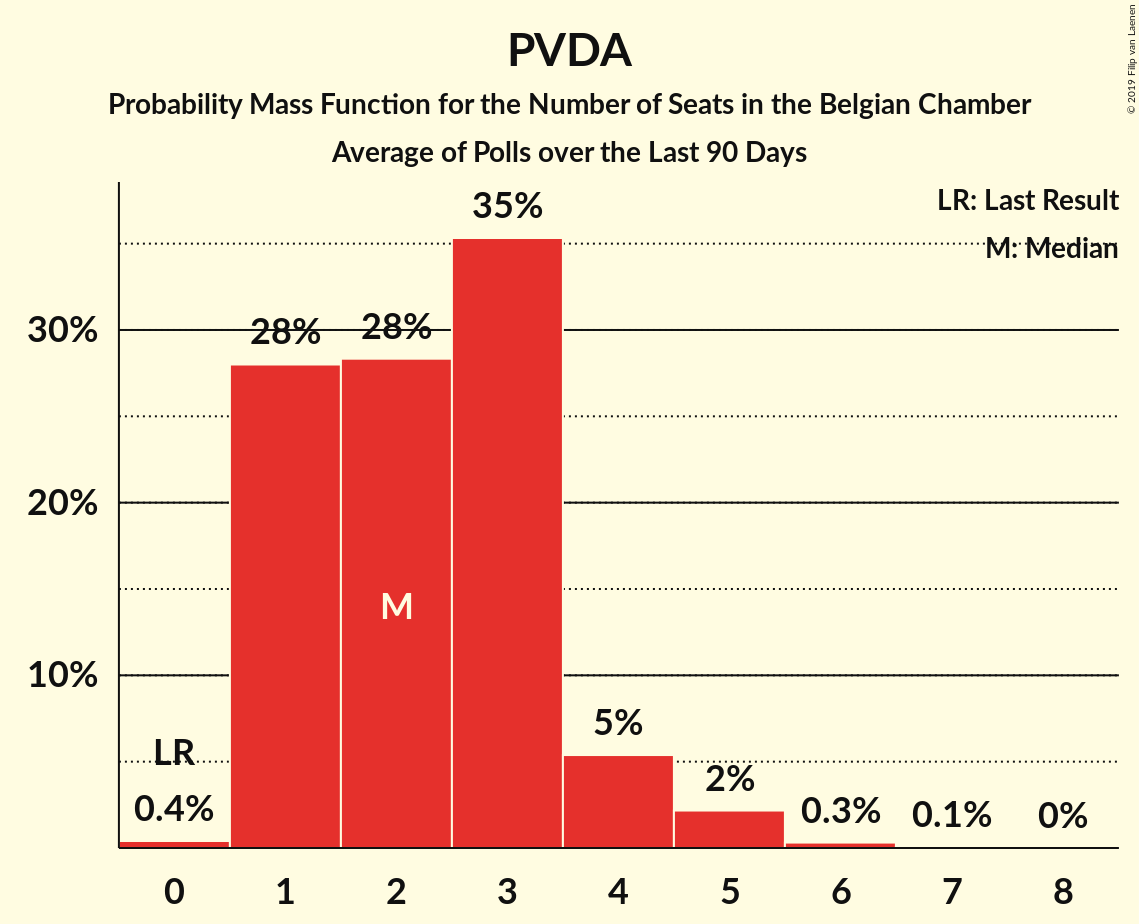
PVDA
For a full overview of the results for this party, see the PVDA page.
| Number of Seats | Probability | Accumulated | Special Marks |
|---|---|---|---|
| 0 | 0.4% | 100% | Last Result |
| 1 | 28% | 99.6% | |
| 2 | 28% | 72% | Median |
| 3 | 35% | 43% | |
| 4 | 5% | 8% | |
| 5 | 2% | 3% | |
| 6 | 0.3% | 0.4% | |
| 7 | 0.1% | 0.1% | |
| 8 | 0% | 0% |
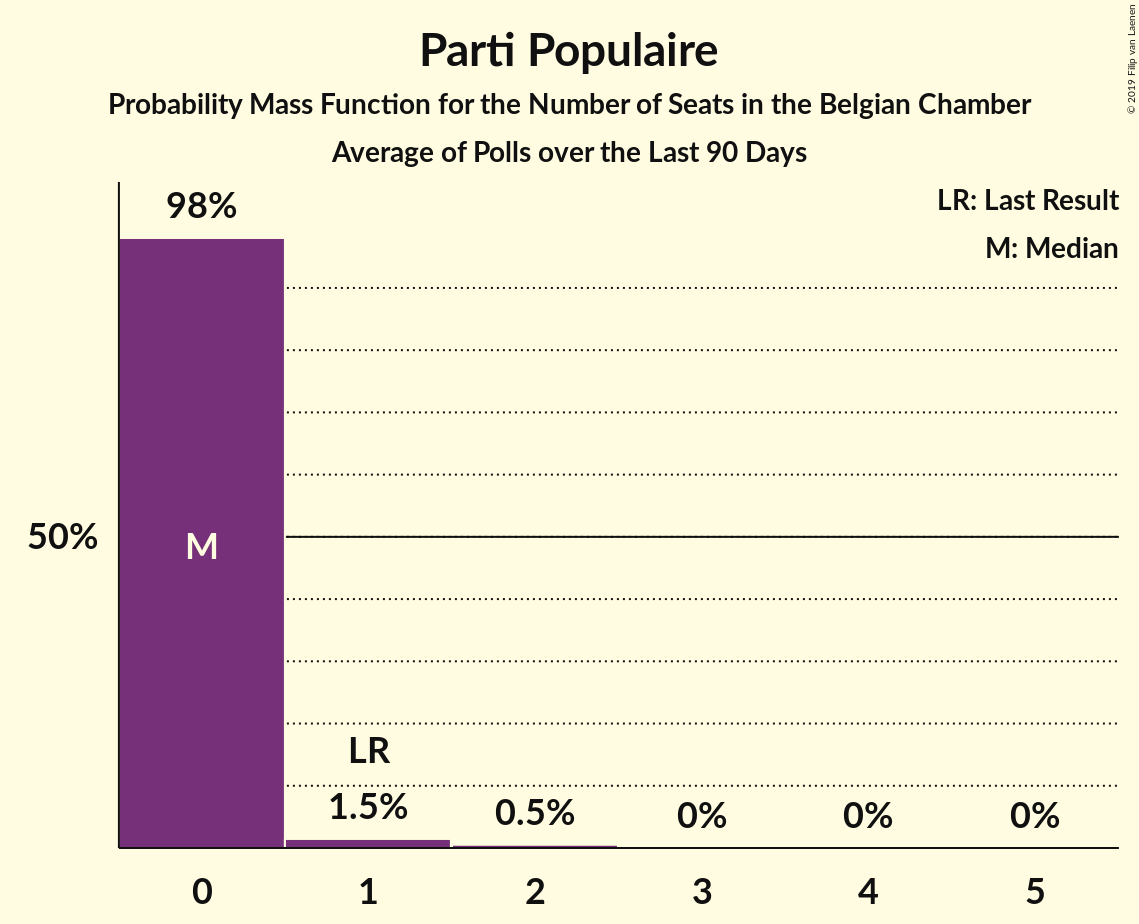
Parti Populaire
For a full overview of the results for this party, see the Parti Populaire page.
| Number of Seats | Probability | Accumulated | Special Marks |
|---|---|---|---|
| 0 | 98% | 100% | Median |
| 1 | 1.5% | 2% | Last Result |
| 2 | 0.5% | 0.5% | |
| 3 | 0% | 0% |
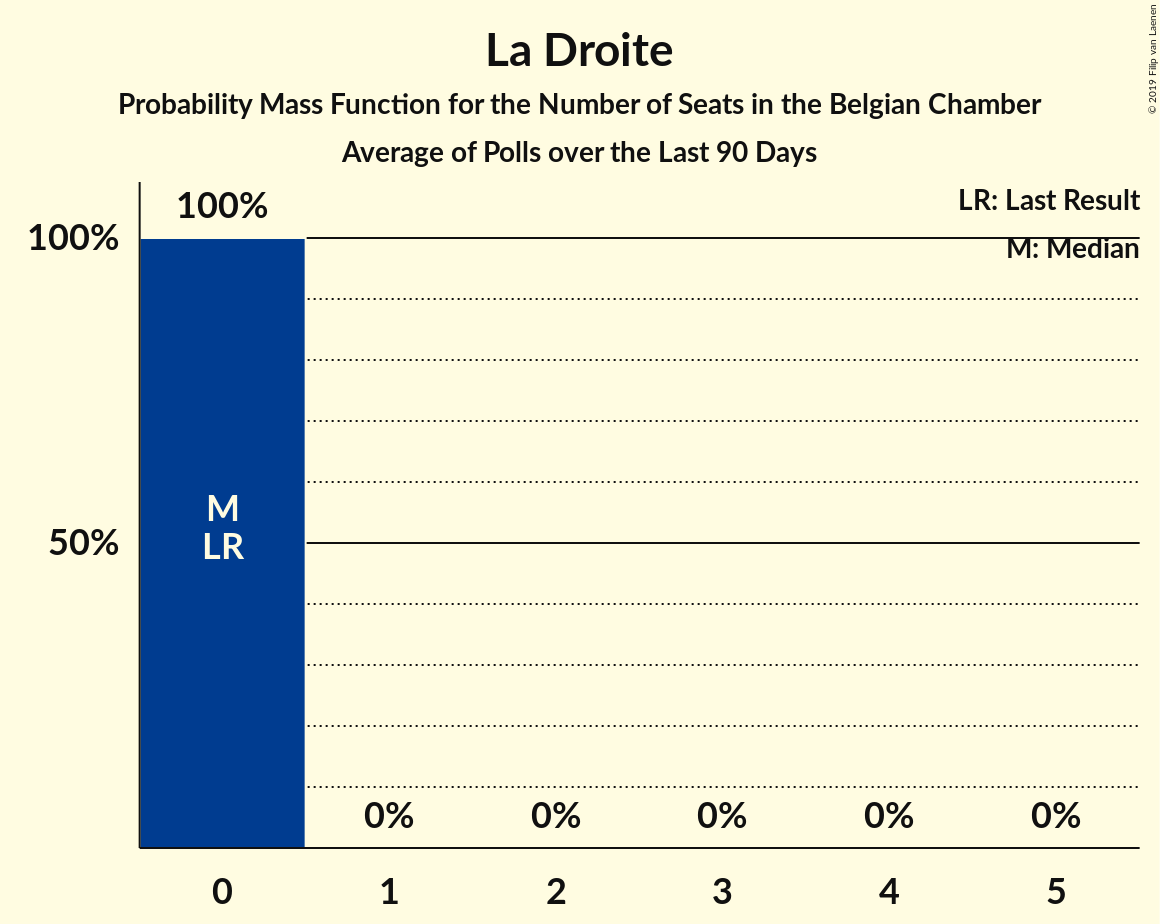
La Droite
For a full overview of the results for this party, see the La Droite page.
| Number of Seats | Probability | Accumulated | Special Marks |
|---|---|---|---|
| 0 | 100% | 100% | Last Result, Median |
Coalitions
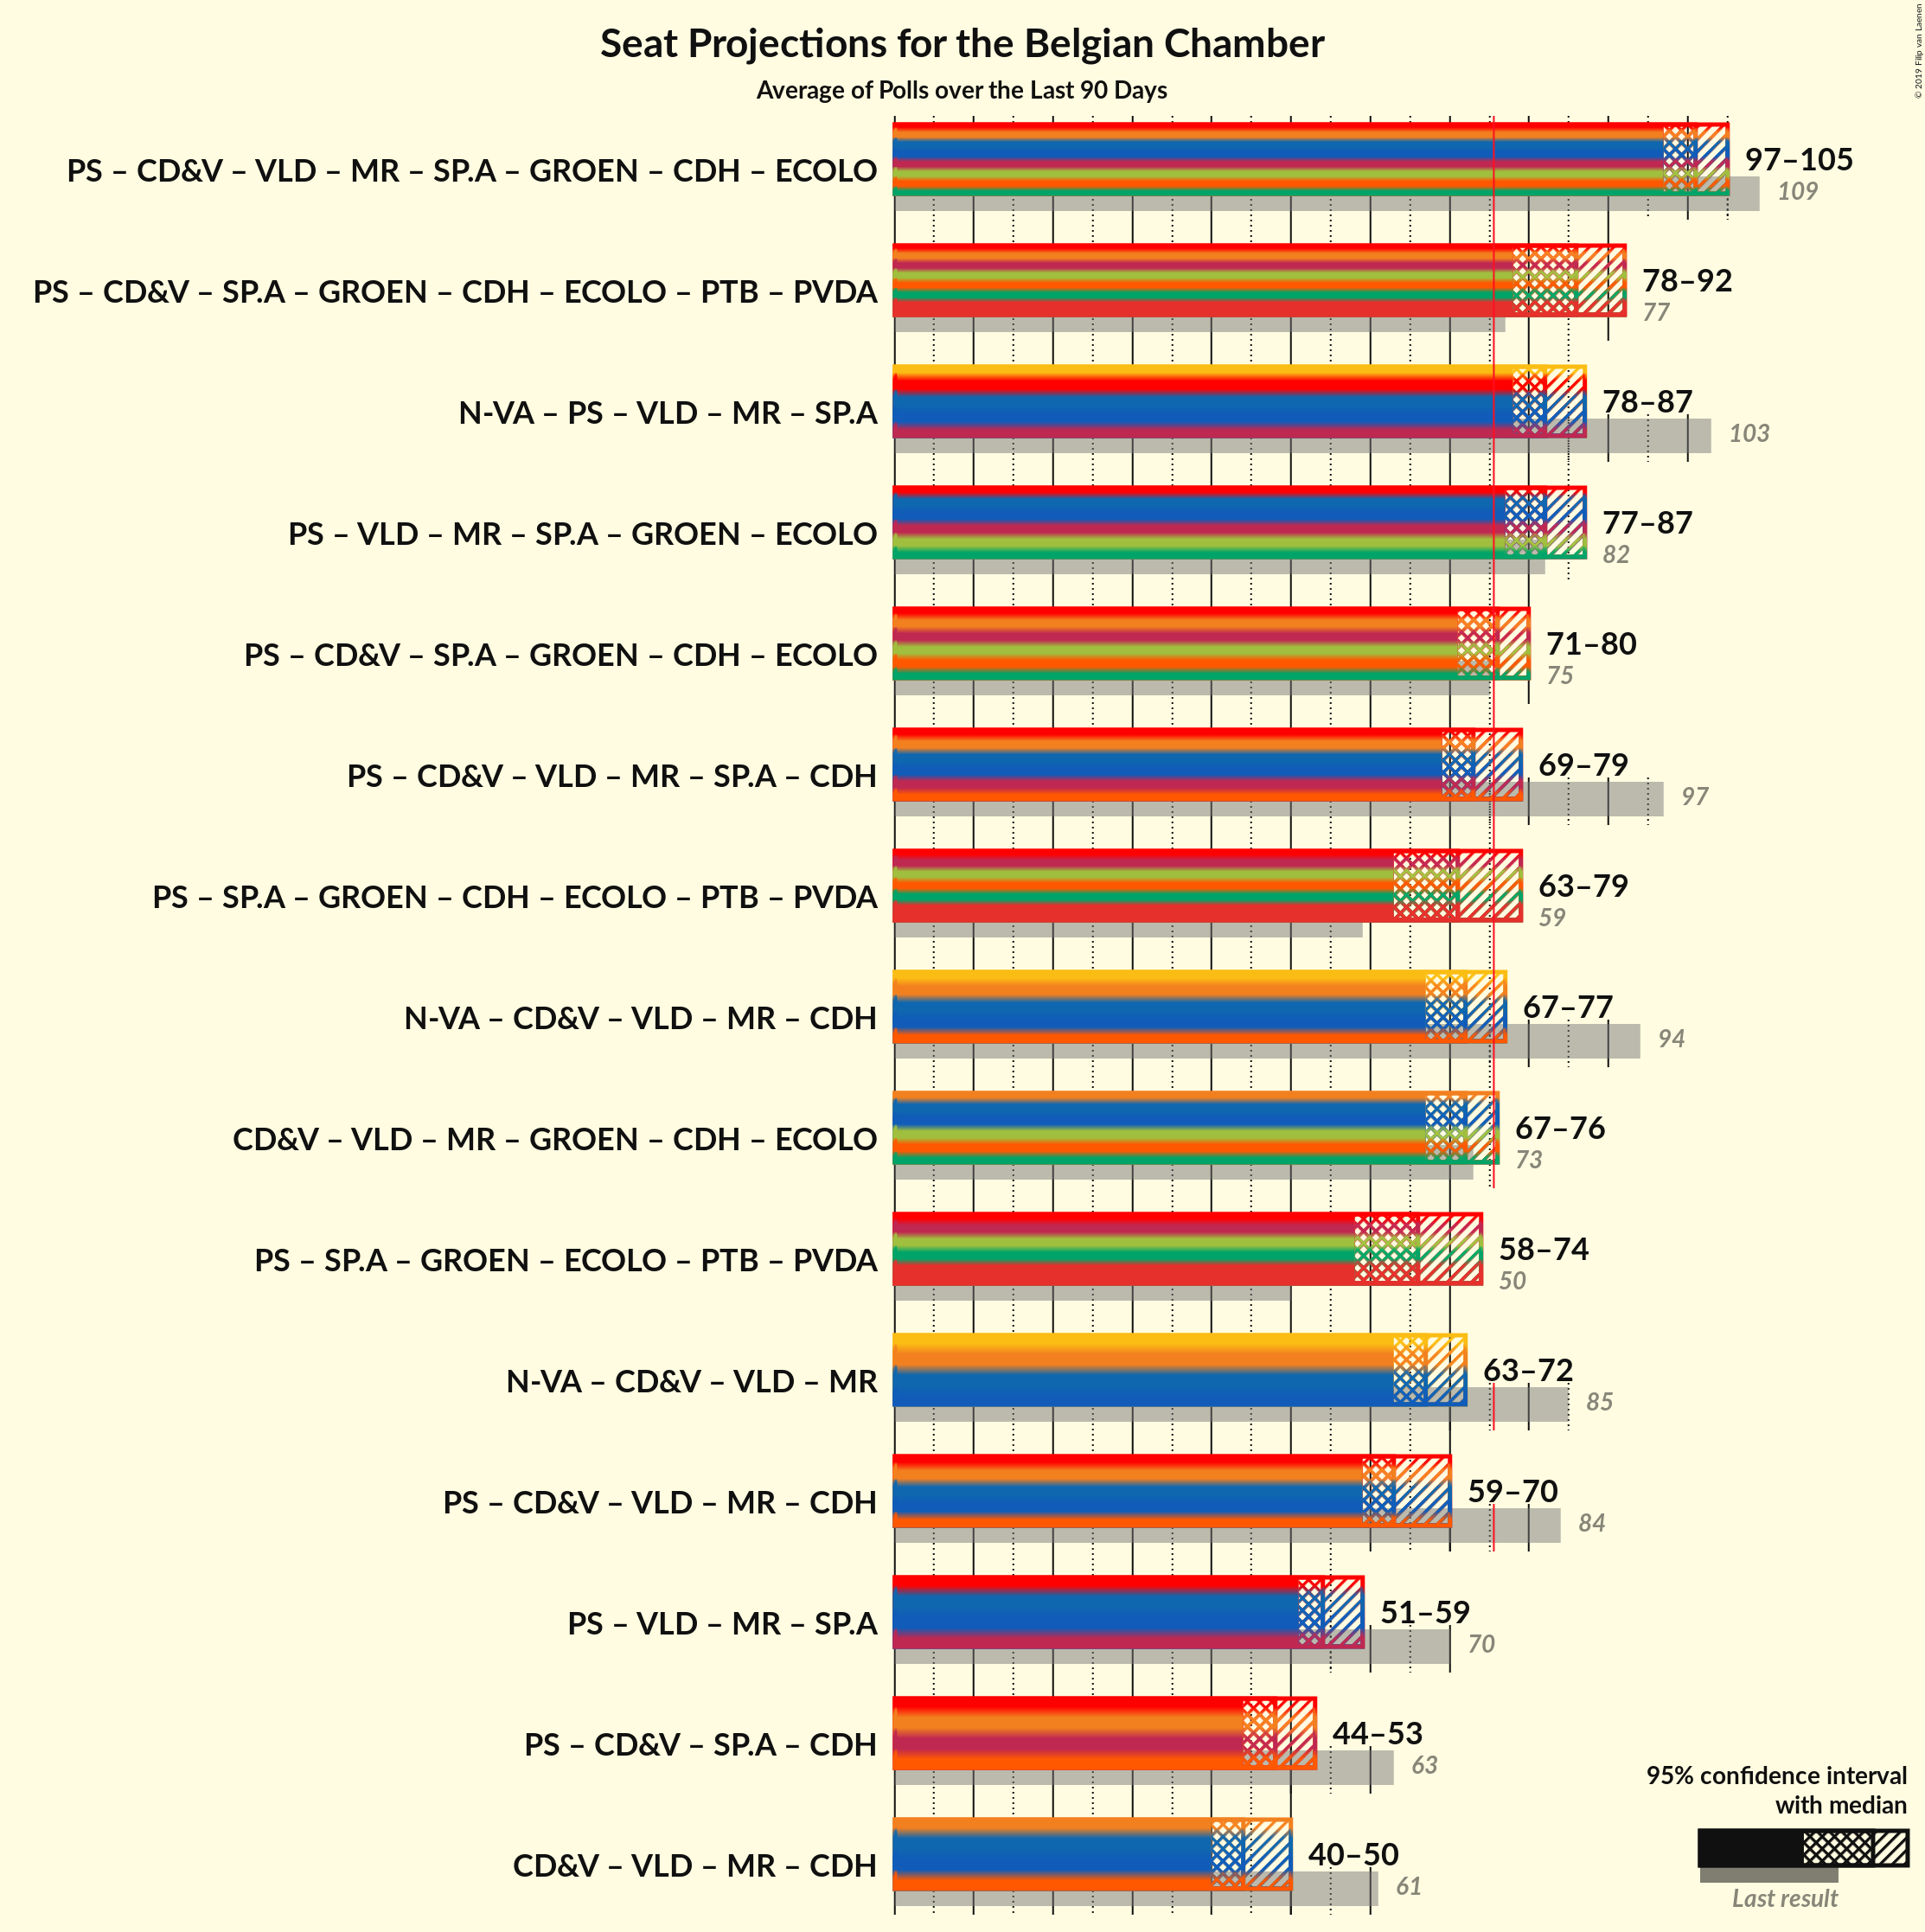
Confidence Intervals
| Coalition | Last Result | Median | Majority? | 80% Confidence Interval | 90% Confidence Interval | 95% Confidence Interval | 99% Confidence Interval |
|---|---|---|---|---|---|---|---|
| PS – CD&V – Open Vld – MR – sp.a – Groen – cdH – Ecolo | 109 | 101 | 100% | 98–104 | 98–104 | 97–105 | 96–106 |
| PS – CD&V – sp.a – Groen – cdH – Ecolo – PTB – PVDA | 77 | 86 | 99.9% | 79–90 | 78–91 | 78–92 | 76–93 |
| N-VA – PS – Open Vld – MR – sp.a | 103 | 82 | 99.8% | 79–85 | 78–86 | 78–87 | 76–88 |
| PS – Open Vld – MR – sp.a – Groen – Ecolo | 82 | 82 | 99.3% | 78–86 | 77–87 | 77–87 | 75–89 |
| PS – CD&V – sp.a – Groen – cdH – Ecolo | 75 | 76 | 57% | 73–79 | 72–80 | 71–80 | 70–81 |
| PS – CD&V – Open Vld – MR – sp.a – cdH | 97 | 73 | 21% | 71–77 | 70–78 | 69–79 | 68–80 |
| PS – sp.a – Groen – cdH – Ecolo – PTB – PVDA | 59 | 71 | 21% | 64–77 | 63–78 | 63–79 | 61–80 |
| N-VA – CD&V – Open Vld – MR – cdH | 94 | 72 | 8% | 69–75 | 68–76 | 67–77 | 66–79 |
| CD&V – Open Vld – MR – Groen – cdH – Ecolo | 73 | 72 | 6% | 69–75 | 68–76 | 67–76 | 66–78 |
| PS – sp.a – Groen – Ecolo – PTB – PVDA | 50 | 66 | 0.8% | 60–72 | 59–74 | 58–74 | 56–76 |
| N-VA – CD&V – Open Vld – MR | 85 | 67 | 0% | 64–71 | 63–72 | 63–72 | 61–74 |
| PS – CD&V – Open Vld – MR – cdH | 84 | 63 | 0% | 60–68 | 59–69 | 59–70 | 57–71 |
| PS – Open Vld – MR – sp.a | 70 | 54 | 0% | 52–57 | 51–58 | 51–59 | 49–60 |
| PS – CD&V – sp.a – cdH | 63 | 48 | 0% | 45–51 | 45–52 | 44–53 | 43–55 |
| CD&V – Open Vld – MR – cdH | 61 | 44 | 0% | 42–48 | 41–49 | 40–50 | 39–51 |
PS – CD&V – Open Vld – MR – sp.a – Groen – cdH – Ecolo
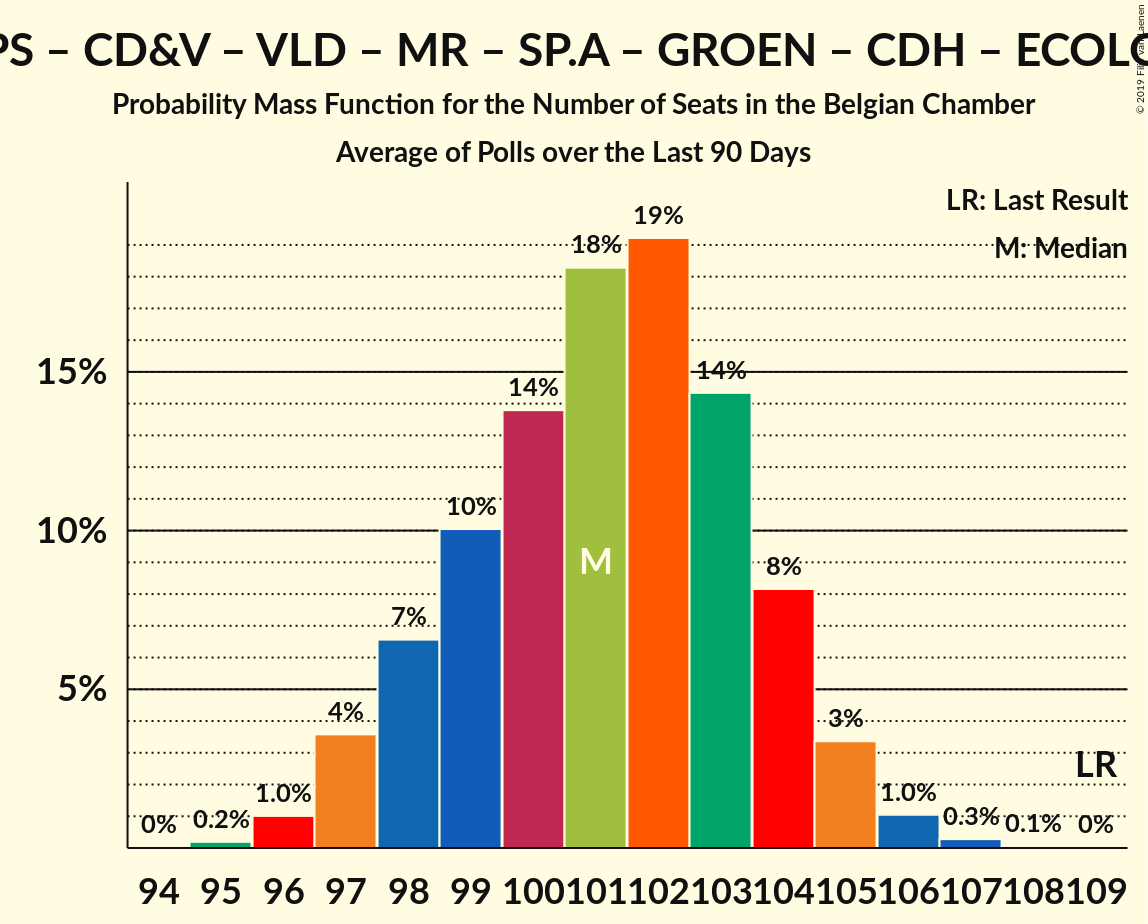
| Number of Seats | Probability | Accumulated | Special Marks |
|---|---|---|---|
| 95 | 0.2% | 100% | |
| 96 | 1.0% | 99.8% | |
| 97 | 4% | 98.8% | |
| 98 | 7% | 95% | |
| 99 | 10% | 89% | |
| 100 | 14% | 79% | Median |
| 101 | 18% | 65% | |
| 102 | 19% | 46% | |
| 103 | 14% | 27% | |
| 104 | 8% | 13% | |
| 105 | 3% | 5% | |
| 106 | 1.0% | 1.4% | |
| 107 | 0.3% | 0.4% | |
| 108 | 0.1% | 0.1% | |
| 109 | 0% | 0% | Last Result |
PS – CD&V – sp.a – Groen – cdH – Ecolo – PTB – PVDA
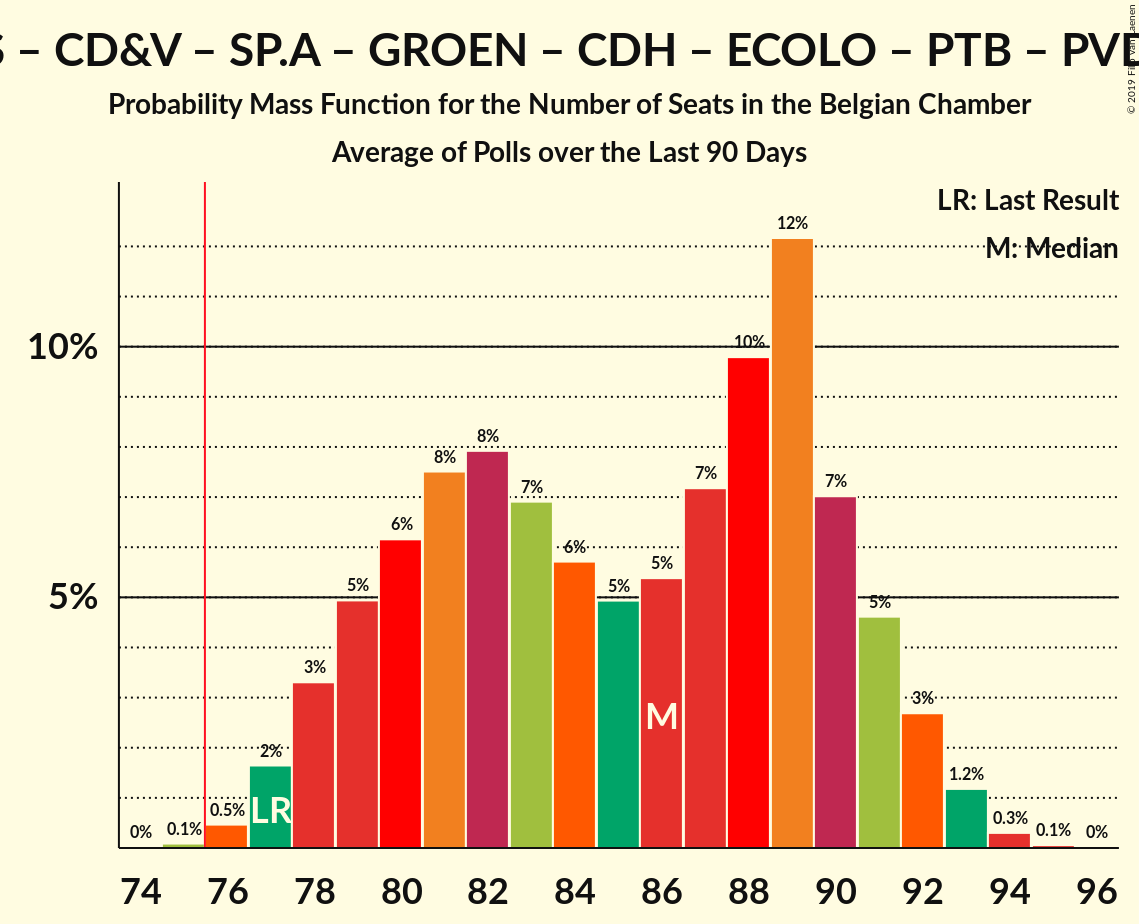
| Number of Seats | Probability | Accumulated | Special Marks |
|---|---|---|---|
| 75 | 0.1% | 100% | |
| 76 | 0.5% | 99.9% | Majority |
| 77 | 2% | 99.4% | Last Result |
| 78 | 3% | 98% | |
| 79 | 5% | 94% | |
| 80 | 6% | 90% | |
| 81 | 8% | 83% | |
| 82 | 8% | 76% | |
| 83 | 7% | 68% | |
| 84 | 6% | 61% | Median |
| 85 | 5% | 55% | |
| 86 | 5% | 50% | |
| 87 | 7% | 45% | |
| 88 | 10% | 38% | |
| 89 | 12% | 28% | |
| 90 | 7% | 16% | |
| 91 | 5% | 9% | |
| 92 | 3% | 4% | |
| 93 | 1.2% | 2% | |
| 94 | 0.3% | 0.4% | |
| 95 | 0.1% | 0.1% | |
| 96 | 0% | 0% |
N-VA – PS – Open Vld – MR – sp.a
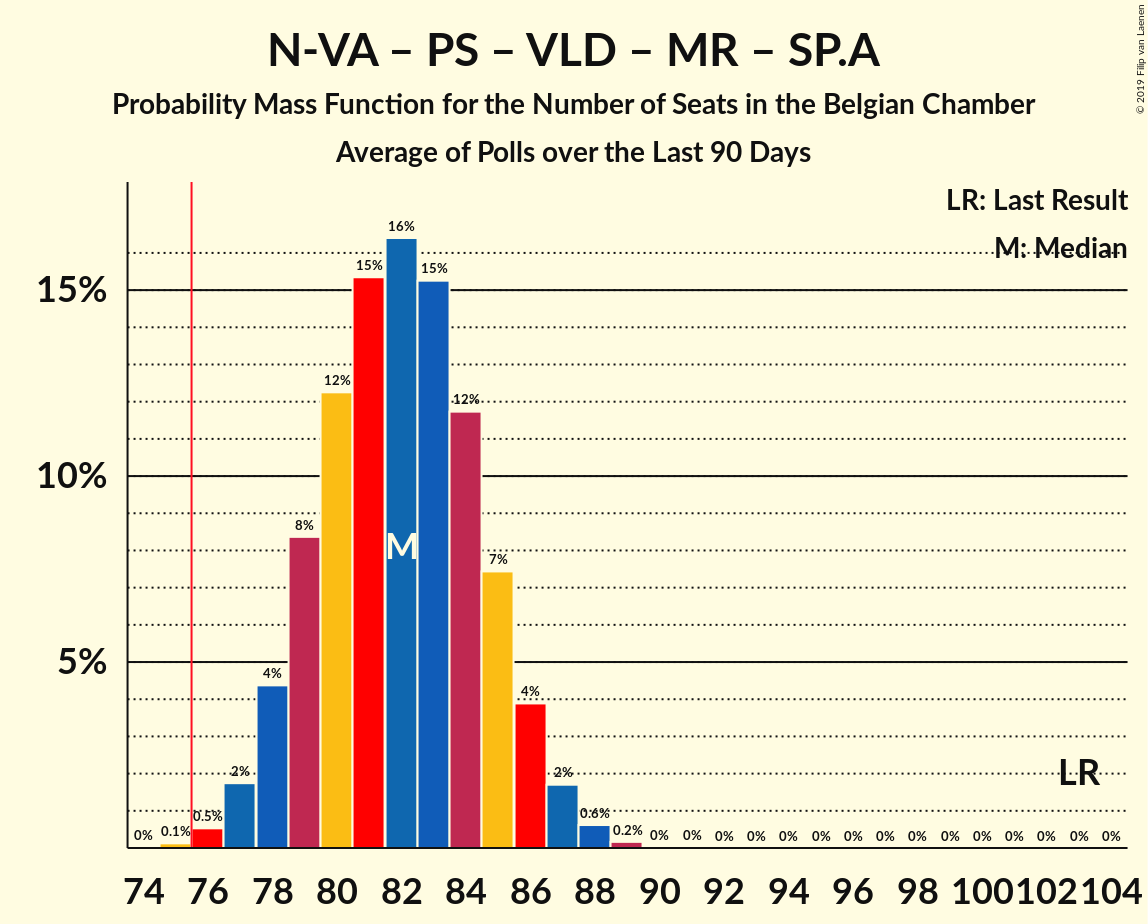
| Number of Seats | Probability | Accumulated | Special Marks |
|---|---|---|---|
| 75 | 0.1% | 100% | |
| 76 | 0.5% | 99.8% | Majority |
| 77 | 2% | 99.3% | |
| 78 | 4% | 98% | |
| 79 | 8% | 93% | |
| 80 | 12% | 85% | |
| 81 | 15% | 73% | |
| 82 | 16% | 57% | Median |
| 83 | 15% | 41% | |
| 84 | 12% | 26% | |
| 85 | 7% | 14% | |
| 86 | 4% | 6% | |
| 87 | 2% | 3% | |
| 88 | 0.6% | 0.8% | |
| 89 | 0.2% | 0.2% | |
| 90 | 0% | 0% | |
| 91 | 0% | 0% | |
| 92 | 0% | 0% | |
| 93 | 0% | 0% | |
| 94 | 0% | 0% | |
| 95 | 0% | 0% | |
| 96 | 0% | 0% | |
| 97 | 0% | 0% | |
| 98 | 0% | 0% | |
| 99 | 0% | 0% | |
| 100 | 0% | 0% | |
| 101 | 0% | 0% | |
| 102 | 0% | 0% | |
| 103 | 0% | 0% | Last Result |
PS – Open Vld – MR – sp.a – Groen – Ecolo
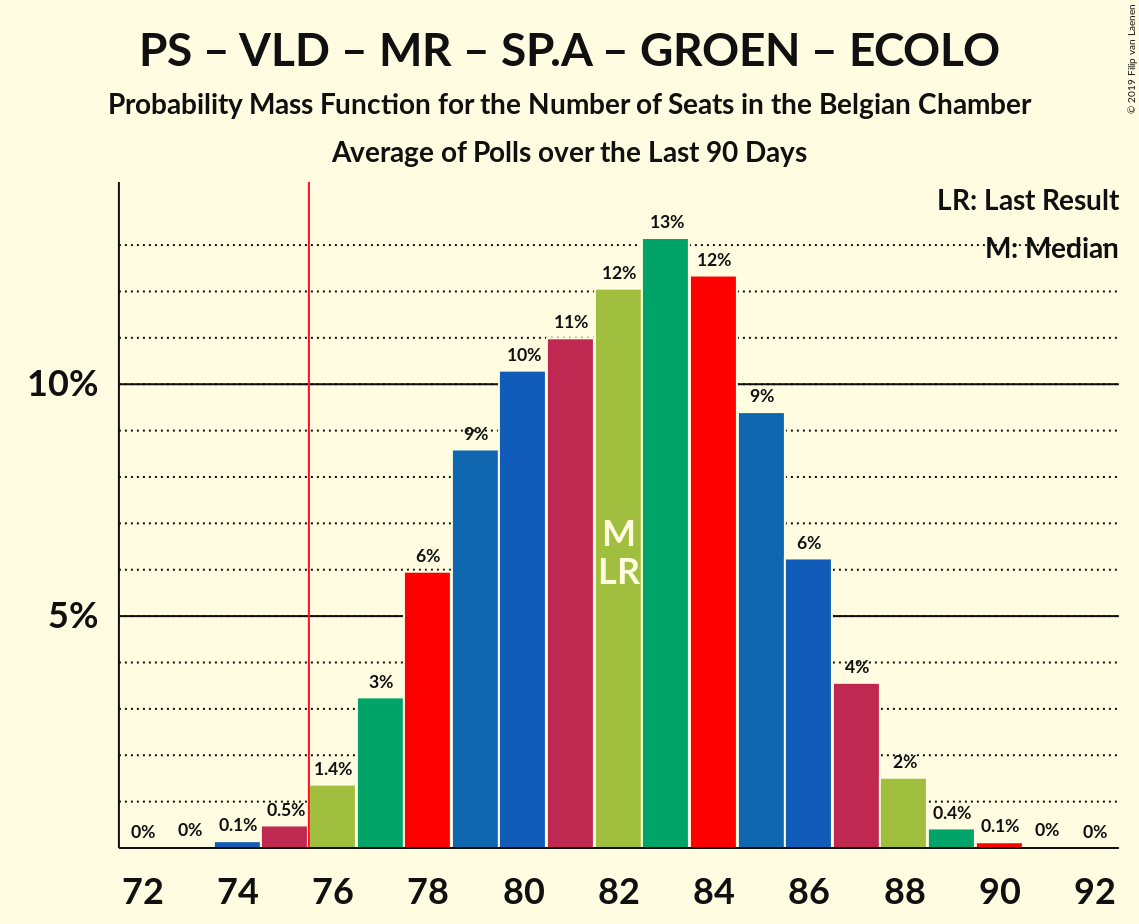
| Number of Seats | Probability | Accumulated | Special Marks |
|---|---|---|---|
| 74 | 0.1% | 100% | |
| 75 | 0.5% | 99.8% | |
| 76 | 1.4% | 99.3% | Majority |
| 77 | 3% | 98% | |
| 78 | 6% | 95% | |
| 79 | 9% | 89% | |
| 80 | 10% | 80% | |
| 81 | 11% | 70% | |
| 82 | 12% | 59% | Last Result, Median |
| 83 | 13% | 47% | |
| 84 | 12% | 34% | |
| 85 | 9% | 21% | |
| 86 | 6% | 12% | |
| 87 | 4% | 6% | |
| 88 | 2% | 2% | |
| 89 | 0.4% | 0.6% | |
| 90 | 0.1% | 0.2% | |
| 91 | 0% | 0% |
PS – CD&V – sp.a – Groen – cdH – Ecolo
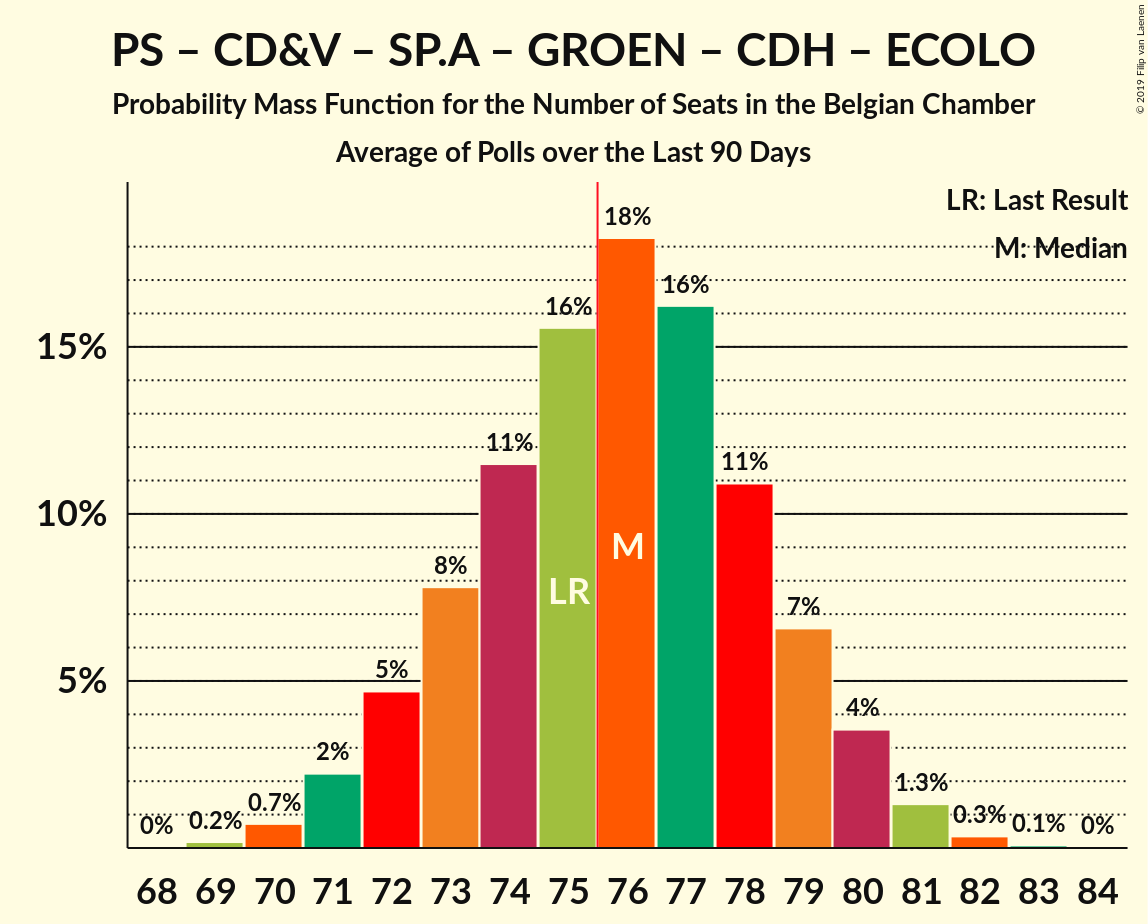
| Number of Seats | Probability | Accumulated | Special Marks |
|---|---|---|---|
| 69 | 0.2% | 100% | |
| 70 | 0.7% | 99.8% | |
| 71 | 2% | 99.1% | |
| 72 | 5% | 97% | |
| 73 | 8% | 92% | |
| 74 | 11% | 84% | |
| 75 | 16% | 73% | Last Result, Median |
| 76 | 18% | 57% | Majority |
| 77 | 16% | 39% | |
| 78 | 11% | 23% | |
| 79 | 7% | 12% | |
| 80 | 4% | 5% | |
| 81 | 1.3% | 2% | |
| 82 | 0.3% | 0.4% | |
| 83 | 0.1% | 0.1% | |
| 84 | 0% | 0% |
PS – CD&V – Open Vld – MR – sp.a – cdH
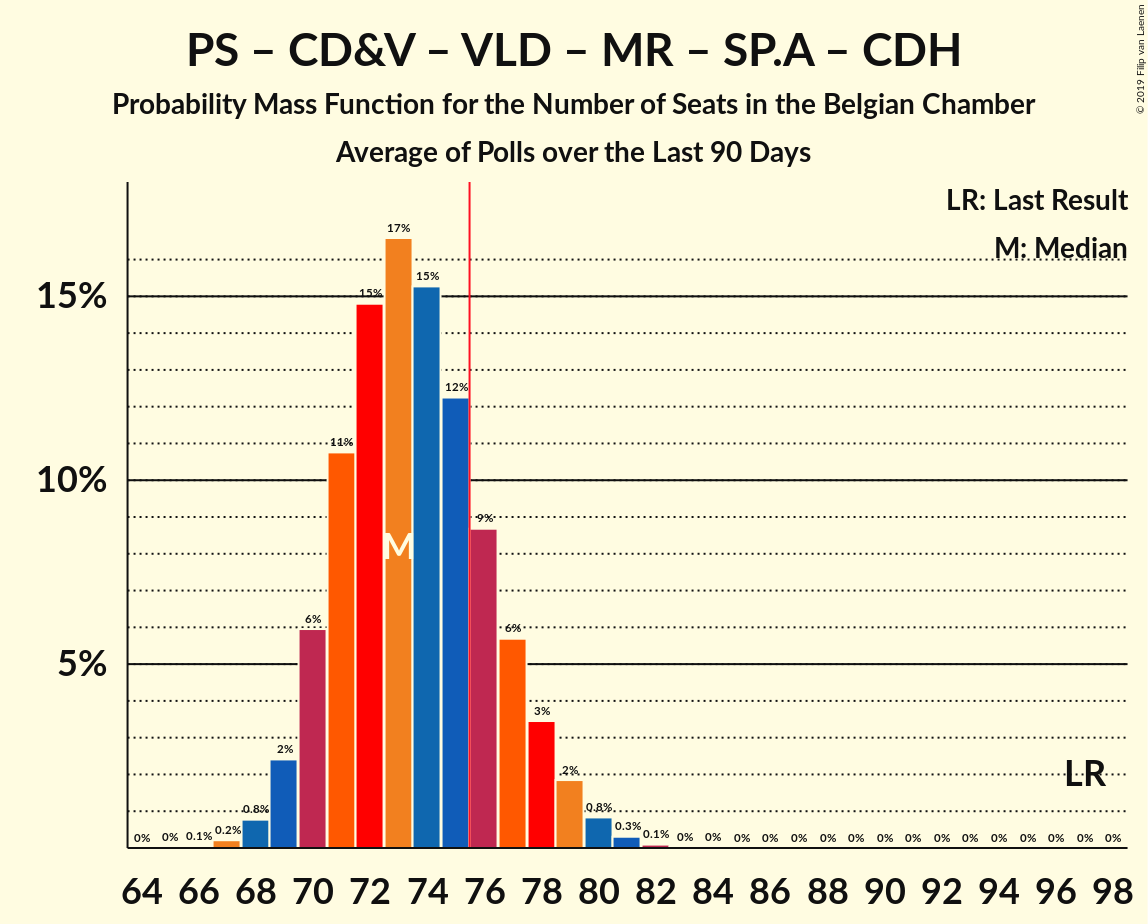
| Number of Seats | Probability | Accumulated | Special Marks |
|---|---|---|---|
| 66 | 0.1% | 100% | |
| 67 | 0.2% | 99.9% | |
| 68 | 0.8% | 99.7% | |
| 69 | 2% | 99.0% | |
| 70 | 6% | 97% | |
| 71 | 11% | 91% | |
| 72 | 15% | 80% | Median |
| 73 | 17% | 65% | |
| 74 | 15% | 48% | |
| 75 | 12% | 33% | |
| 76 | 9% | 21% | Majority |
| 77 | 6% | 12% | |
| 78 | 3% | 7% | |
| 79 | 2% | 3% | |
| 80 | 0.8% | 1.3% | |
| 81 | 0.3% | 0.4% | |
| 82 | 0.1% | 0.1% | |
| 83 | 0% | 0% | |
| 84 | 0% | 0% | |
| 85 | 0% | 0% | |
| 86 | 0% | 0% | |
| 87 | 0% | 0% | |
| 88 | 0% | 0% | |
| 89 | 0% | 0% | |
| 90 | 0% | 0% | |
| 91 | 0% | 0% | |
| 92 | 0% | 0% | |
| 93 | 0% | 0% | |
| 94 | 0% | 0% | |
| 95 | 0% | 0% | |
| 96 | 0% | 0% | |
| 97 | 0% | 0% | Last Result |
PS – sp.a – Groen – cdH – Ecolo – PTB – PVDA
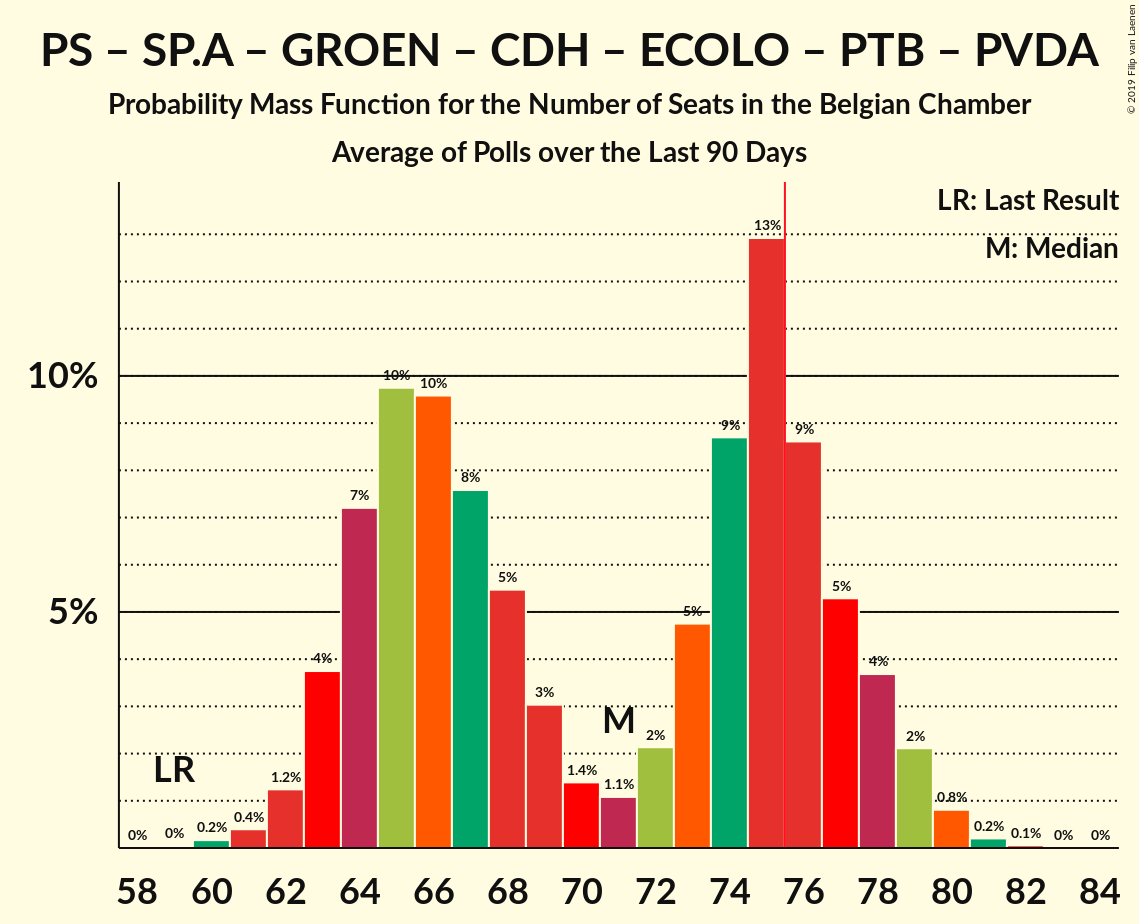
| Number of Seats | Probability | Accumulated | Special Marks |
|---|---|---|---|
| 59 | 0% | 100% | Last Result |
| 60 | 0.2% | 99.9% | |
| 61 | 0.4% | 99.8% | |
| 62 | 1.2% | 99.4% | |
| 63 | 4% | 98% | |
| 64 | 7% | 94% | |
| 65 | 10% | 87% | |
| 66 | 10% | 77% | |
| 67 | 8% | 68% | |
| 68 | 5% | 60% | |
| 69 | 3% | 55% | |
| 70 | 1.4% | 52% | Median |
| 71 | 1.1% | 50% | |
| 72 | 2% | 49% | |
| 73 | 5% | 47% | |
| 74 | 9% | 42% | |
| 75 | 13% | 34% | |
| 76 | 9% | 21% | Majority |
| 77 | 5% | 12% | |
| 78 | 4% | 7% | |
| 79 | 2% | 3% | |
| 80 | 0.8% | 1.1% | |
| 81 | 0.2% | 0.3% | |
| 82 | 0.1% | 0.1% | |
| 83 | 0% | 0% |
N-VA – CD&V – Open Vld – MR – cdH
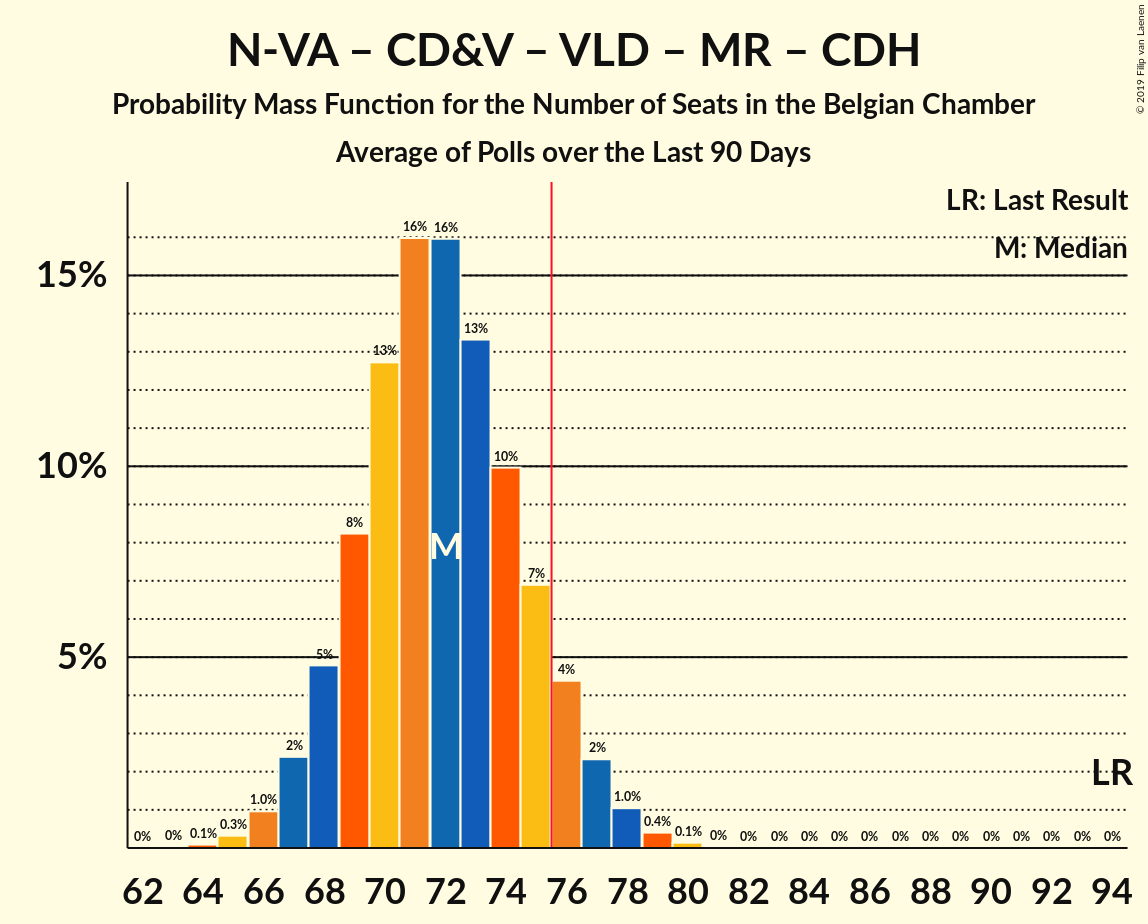
| Number of Seats | Probability | Accumulated | Special Marks |
|---|---|---|---|
| 64 | 0.1% | 100% | |
| 65 | 0.3% | 99.9% | |
| 66 | 1.0% | 99.6% | |
| 67 | 2% | 98.6% | |
| 68 | 5% | 96% | |
| 69 | 8% | 91% | |
| 70 | 13% | 83% | |
| 71 | 16% | 70% | Median |
| 72 | 16% | 54% | |
| 73 | 13% | 39% | |
| 74 | 10% | 25% | |
| 75 | 7% | 15% | |
| 76 | 4% | 8% | Majority |
| 77 | 2% | 4% | |
| 78 | 1.0% | 2% | |
| 79 | 0.4% | 0.6% | |
| 80 | 0.1% | 0.2% | |
| 81 | 0% | 0.1% | |
| 82 | 0% | 0% | |
| 83 | 0% | 0% | |
| 84 | 0% | 0% | |
| 85 | 0% | 0% | |
| 86 | 0% | 0% | |
| 87 | 0% | 0% | |
| 88 | 0% | 0% | |
| 89 | 0% | 0% | |
| 90 | 0% | 0% | |
| 91 | 0% | 0% | |
| 92 | 0% | 0% | |
| 93 | 0% | 0% | |
| 94 | 0% | 0% | Last Result |
CD&V – Open Vld – MR – Groen – cdH – Ecolo
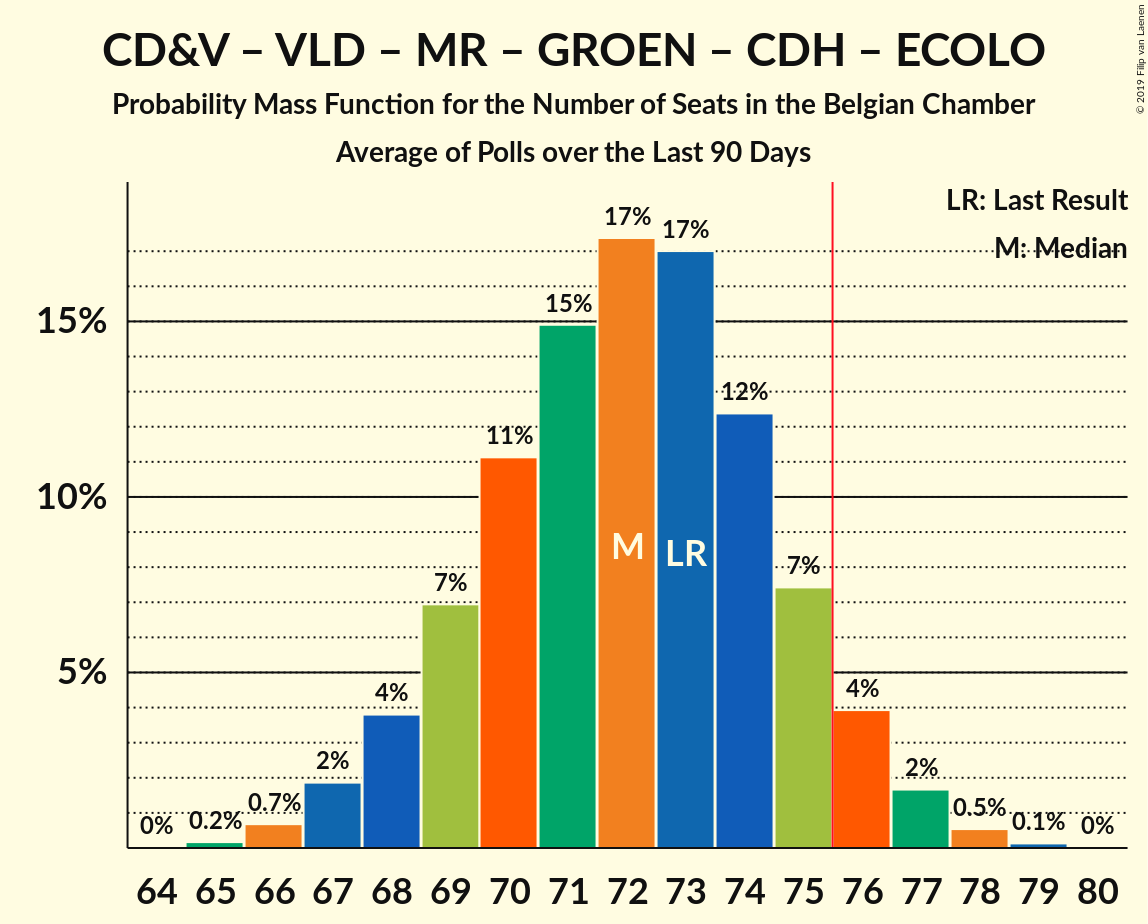
| Number of Seats | Probability | Accumulated | Special Marks |
|---|---|---|---|
| 65 | 0.2% | 100% | |
| 66 | 0.7% | 99.8% | |
| 67 | 2% | 99.1% | |
| 68 | 4% | 97% | |
| 69 | 7% | 93% | |
| 70 | 11% | 87% | |
| 71 | 15% | 75% | Median |
| 72 | 17% | 60% | |
| 73 | 17% | 43% | Last Result |
| 74 | 12% | 26% | |
| 75 | 7% | 14% | |
| 76 | 4% | 6% | Majority |
| 77 | 2% | 2% | |
| 78 | 0.5% | 0.7% | |
| 79 | 0.1% | 0.2% | |
| 80 | 0% | 0% |
PS – sp.a – Groen – Ecolo – PTB – PVDA
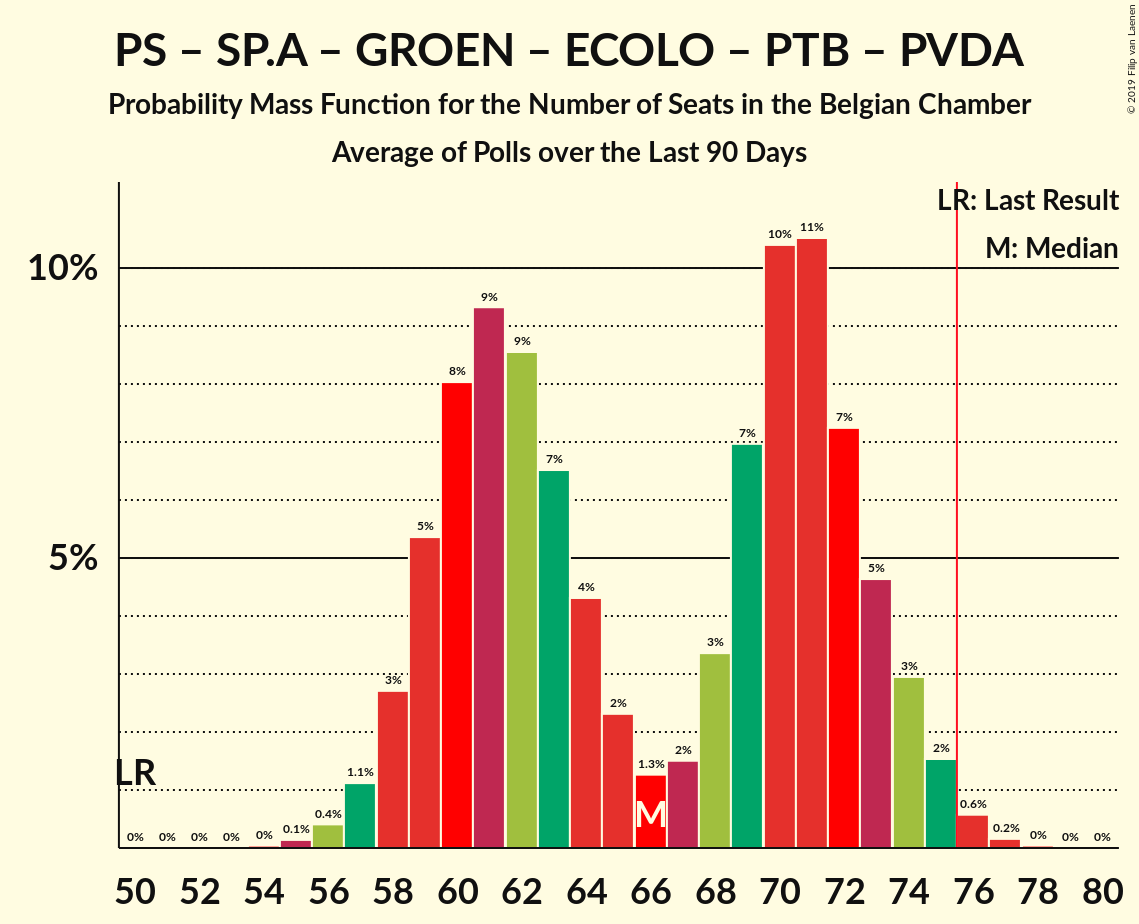
| Number of Seats | Probability | Accumulated | Special Marks |
|---|---|---|---|
| 50 | 0% | 100% | Last Result |
| 51 | 0% | 100% | |
| 52 | 0% | 100% | |
| 53 | 0% | 100% | |
| 54 | 0% | 100% | |
| 55 | 0.1% | 99.9% | |
| 56 | 0.4% | 99.8% | |
| 57 | 1.1% | 99.4% | |
| 58 | 3% | 98% | |
| 59 | 5% | 96% | |
| 60 | 8% | 90% | |
| 61 | 9% | 82% | |
| 62 | 9% | 73% | |
| 63 | 7% | 64% | |
| 64 | 4% | 58% | |
| 65 | 2% | 53% | |
| 66 | 1.3% | 51% | Median |
| 67 | 2% | 50% | |
| 68 | 3% | 48% | |
| 69 | 7% | 45% | |
| 70 | 10% | 38% | |
| 71 | 11% | 28% | |
| 72 | 7% | 17% | |
| 73 | 5% | 10% | |
| 74 | 3% | 5% | |
| 75 | 2% | 2% | |
| 76 | 0.6% | 0.8% | Majority |
| 77 | 0.2% | 0.2% | |
| 78 | 0% | 0.1% | |
| 79 | 0% | 0% |
N-VA – CD&V – Open Vld – MR
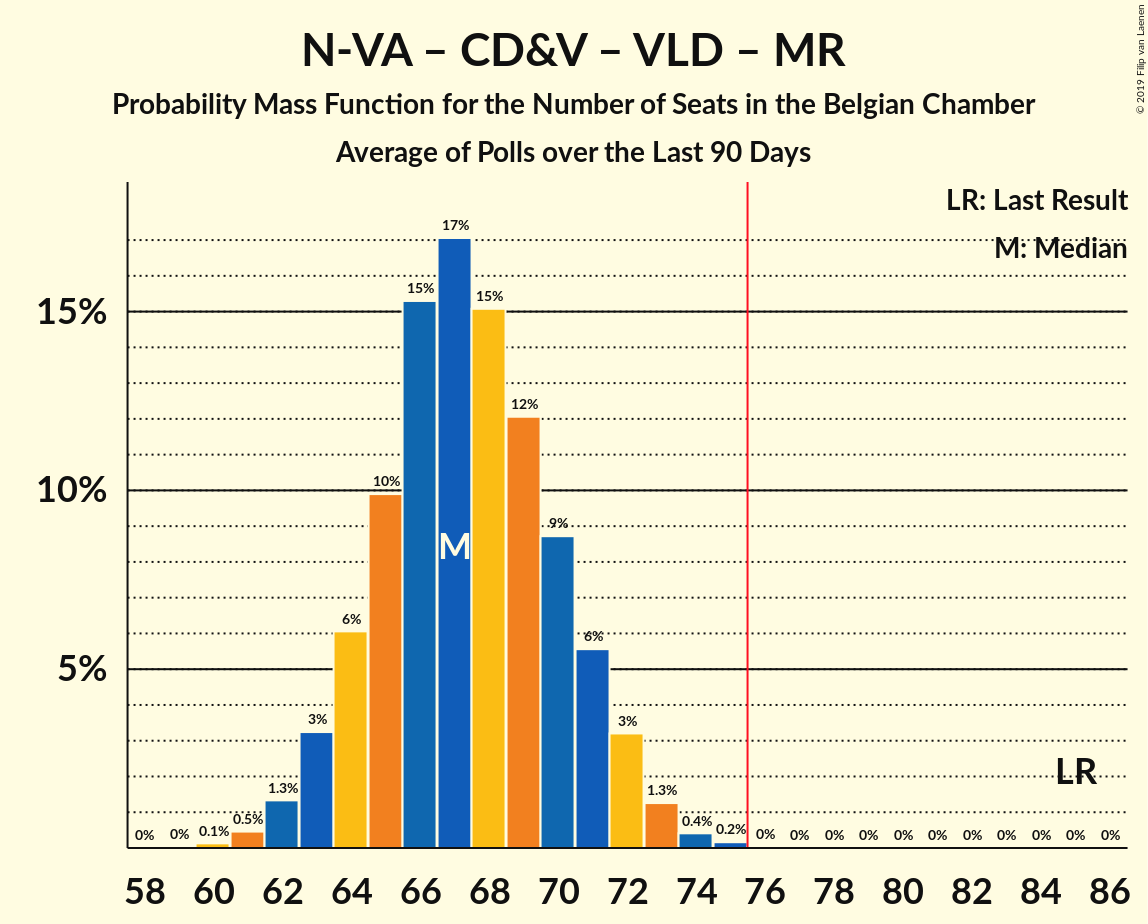
| Number of Seats | Probability | Accumulated | Special Marks |
|---|---|---|---|
| 60 | 0.1% | 100% | |
| 61 | 0.5% | 99.8% | |
| 62 | 1.3% | 99.4% | |
| 63 | 3% | 98% | |
| 64 | 6% | 95% | |
| 65 | 10% | 89% | |
| 66 | 15% | 79% | |
| 67 | 17% | 64% | Median |
| 68 | 15% | 46% | |
| 69 | 12% | 31% | |
| 70 | 9% | 19% | |
| 71 | 6% | 11% | |
| 72 | 3% | 5% | |
| 73 | 1.3% | 2% | |
| 74 | 0.4% | 0.6% | |
| 75 | 0.2% | 0.2% | |
| 76 | 0% | 0% | Majority |
| 77 | 0% | 0% | |
| 78 | 0% | 0% | |
| 79 | 0% | 0% | |
| 80 | 0% | 0% | |
| 81 | 0% | 0% | |
| 82 | 0% | 0% | |
| 83 | 0% | 0% | |
| 84 | 0% | 0% | |
| 85 | 0% | 0% | Last Result |
PS – CD&V – Open Vld – MR – cdH
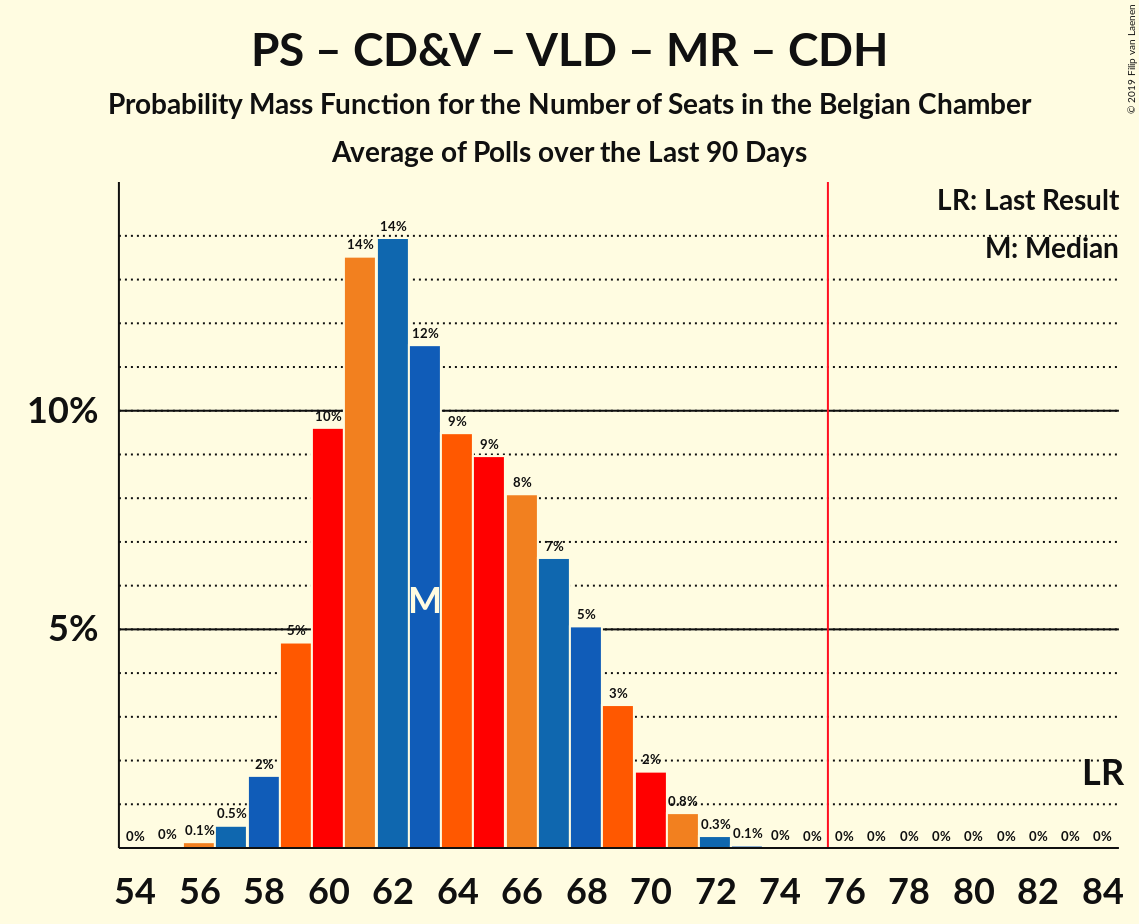
| Number of Seats | Probability | Accumulated | Special Marks |
|---|---|---|---|
| 56 | 0.1% | 100% | |
| 57 | 0.5% | 99.8% | |
| 58 | 2% | 99.3% | |
| 59 | 5% | 98% | |
| 60 | 10% | 93% | |
| 61 | 14% | 83% | |
| 62 | 14% | 70% | Median |
| 63 | 12% | 56% | |
| 64 | 9% | 44% | |
| 65 | 9% | 35% | |
| 66 | 8% | 26% | |
| 67 | 7% | 18% | |
| 68 | 5% | 11% | |
| 69 | 3% | 6% | |
| 70 | 2% | 3% | |
| 71 | 0.8% | 1.1% | |
| 72 | 0.3% | 0.3% | |
| 73 | 0.1% | 0.1% | |
| 74 | 0% | 0% | |
| 75 | 0% | 0% | |
| 76 | 0% | 0% | Majority |
| 77 | 0% | 0% | |
| 78 | 0% | 0% | |
| 79 | 0% | 0% | |
| 80 | 0% | 0% | |
| 81 | 0% | 0% | |
| 82 | 0% | 0% | |
| 83 | 0% | 0% | |
| 84 | 0% | 0% | Last Result |
PS – Open Vld – MR – sp.a
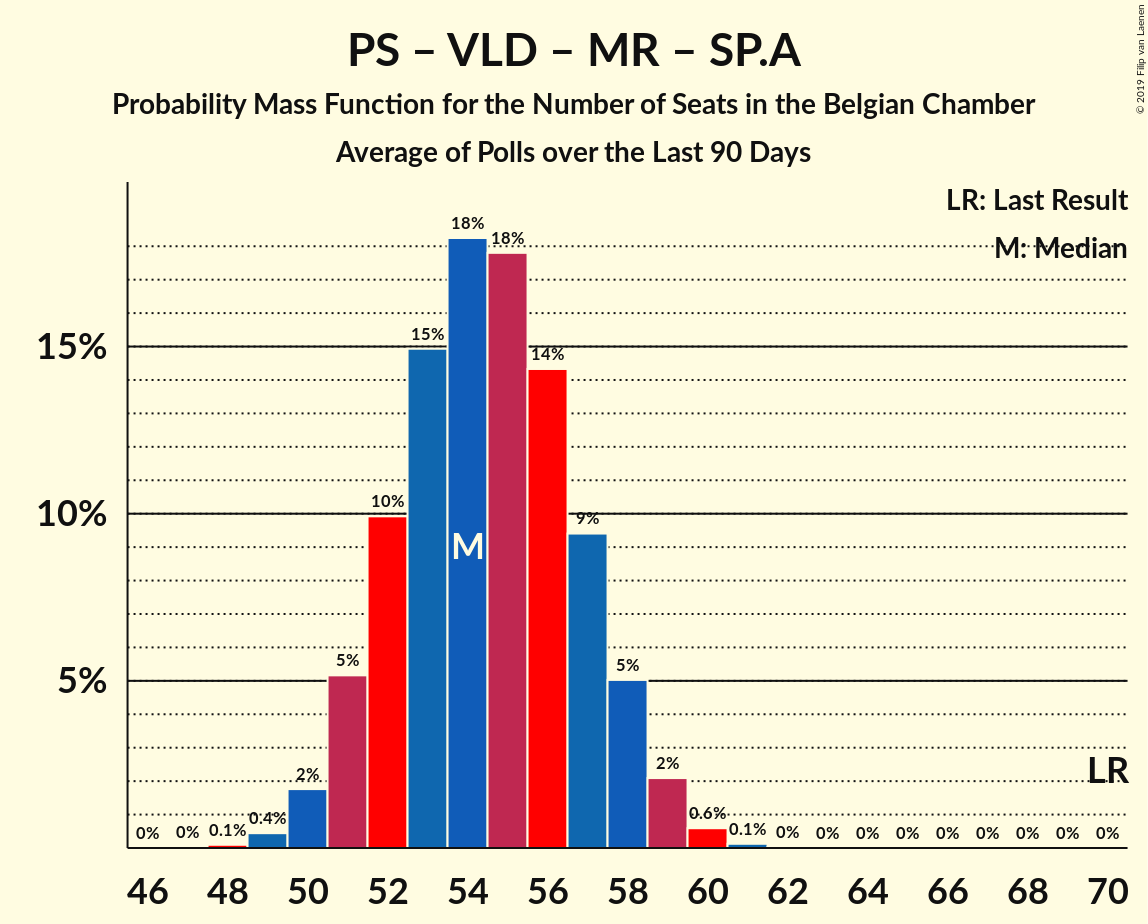
| Number of Seats | Probability | Accumulated | Special Marks |
|---|---|---|---|
| 48 | 0.1% | 100% | |
| 49 | 0.4% | 99.9% | |
| 50 | 2% | 99.4% | |
| 51 | 5% | 98% | |
| 52 | 10% | 93% | |
| 53 | 15% | 83% | |
| 54 | 18% | 68% | Median |
| 55 | 18% | 49% | |
| 56 | 14% | 32% | |
| 57 | 9% | 17% | |
| 58 | 5% | 8% | |
| 59 | 2% | 3% | |
| 60 | 0.6% | 0.8% | |
| 61 | 0.1% | 0.2% | |
| 62 | 0% | 0% | |
| 63 | 0% | 0% | |
| 64 | 0% | 0% | |
| 65 | 0% | 0% | |
| 66 | 0% | 0% | |
| 67 | 0% | 0% | |
| 68 | 0% | 0% | |
| 69 | 0% | 0% | |
| 70 | 0% | 0% | Last Result |
PS – CD&V – sp.a – cdH
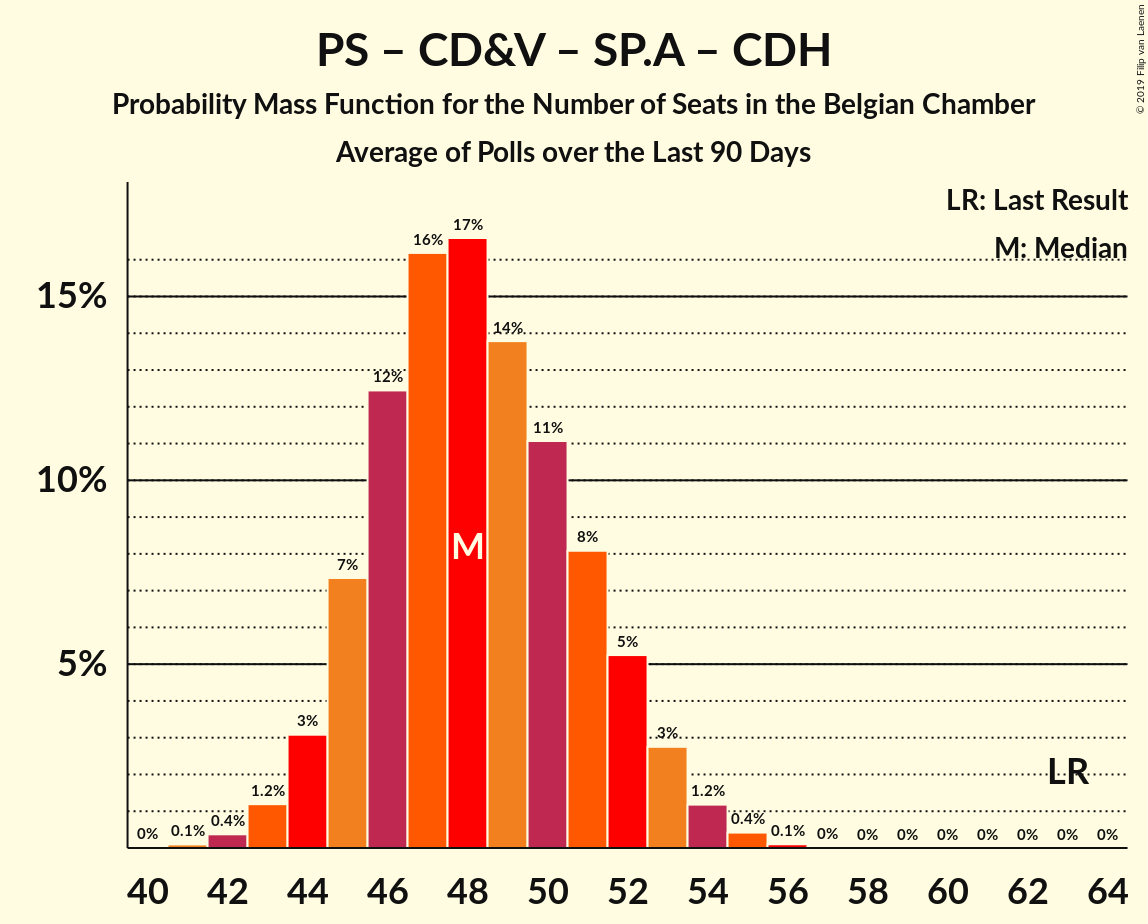
| Number of Seats | Probability | Accumulated | Special Marks |
|---|---|---|---|
| 41 | 0.1% | 100% | |
| 42 | 0.4% | 99.9% | |
| 43 | 1.2% | 99.5% | |
| 44 | 3% | 98% | |
| 45 | 7% | 95% | |
| 46 | 12% | 88% | |
| 47 | 16% | 75% | Median |
| 48 | 17% | 59% | |
| 49 | 14% | 43% | |
| 50 | 11% | 29% | |
| 51 | 8% | 18% | |
| 52 | 5% | 10% | |
| 53 | 3% | 4% | |
| 54 | 1.2% | 2% | |
| 55 | 0.4% | 0.6% | |
| 56 | 0.1% | 0.1% | |
| 57 | 0% | 0% | |
| 58 | 0% | 0% | |
| 59 | 0% | 0% | |
| 60 | 0% | 0% | |
| 61 | 0% | 0% | |
| 62 | 0% | 0% | |
| 63 | 0% | 0% | Last Result |
CD&V – Open Vld – MR – cdH
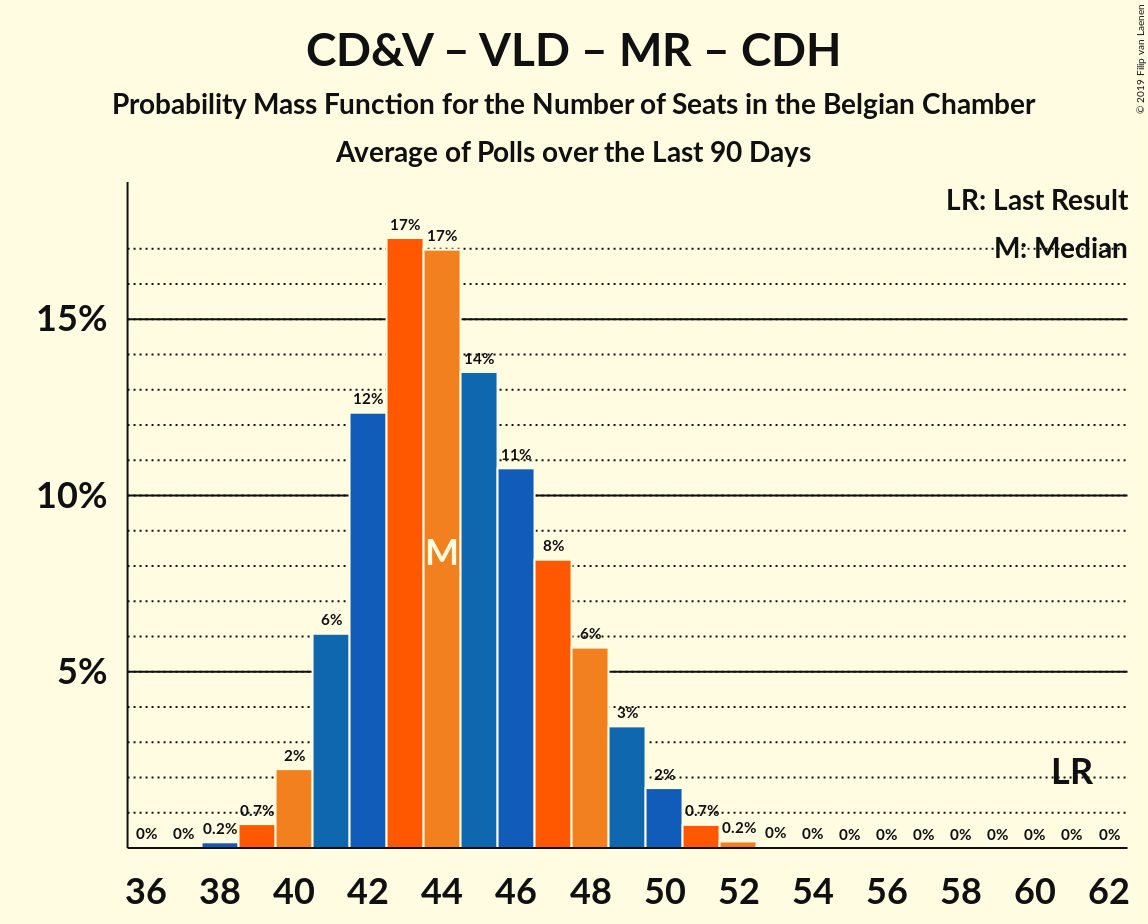
| Number of Seats | Probability | Accumulated | Special Marks |
|---|---|---|---|
| 38 | 0.2% | 100% | |
| 39 | 0.7% | 99.8% | |
| 40 | 2% | 99.1% | |
| 41 | 6% | 97% | |
| 42 | 12% | 91% | |
| 43 | 17% | 78% | Median |
| 44 | 17% | 61% | |
| 45 | 14% | 44% | |
| 46 | 11% | 31% | |
| 47 | 8% | 20% | |
| 48 | 6% | 12% | |
| 49 | 3% | 6% | |
| 50 | 2% | 3% | |
| 51 | 0.7% | 0.9% | |
| 52 | 0.2% | 0.2% | |
| 53 | 0% | 0% | |
| 54 | 0% | 0% | |
| 55 | 0% | 0% | |
| 56 | 0% | 0% | |
| 57 | 0% | 0% | |
| 58 | 0% | 0% | |
| 59 | 0% | 0% | |
| 60 | 0% | 0% | |
| 61 | 0% | 0% | Last Result |
Technical Information
- Number of polls included in this average: 2
- Lowest number of simulations done in a poll included in this average: 1,048,576
- Total number of simulations done in the polls included in this average: 2,097,152
- Error estimate: 0.87%