Opinion Poll by Norstat, 10–14 September 2018
Voting Intentions | Seats | Coalitions | Technical Information
Voting Intentions
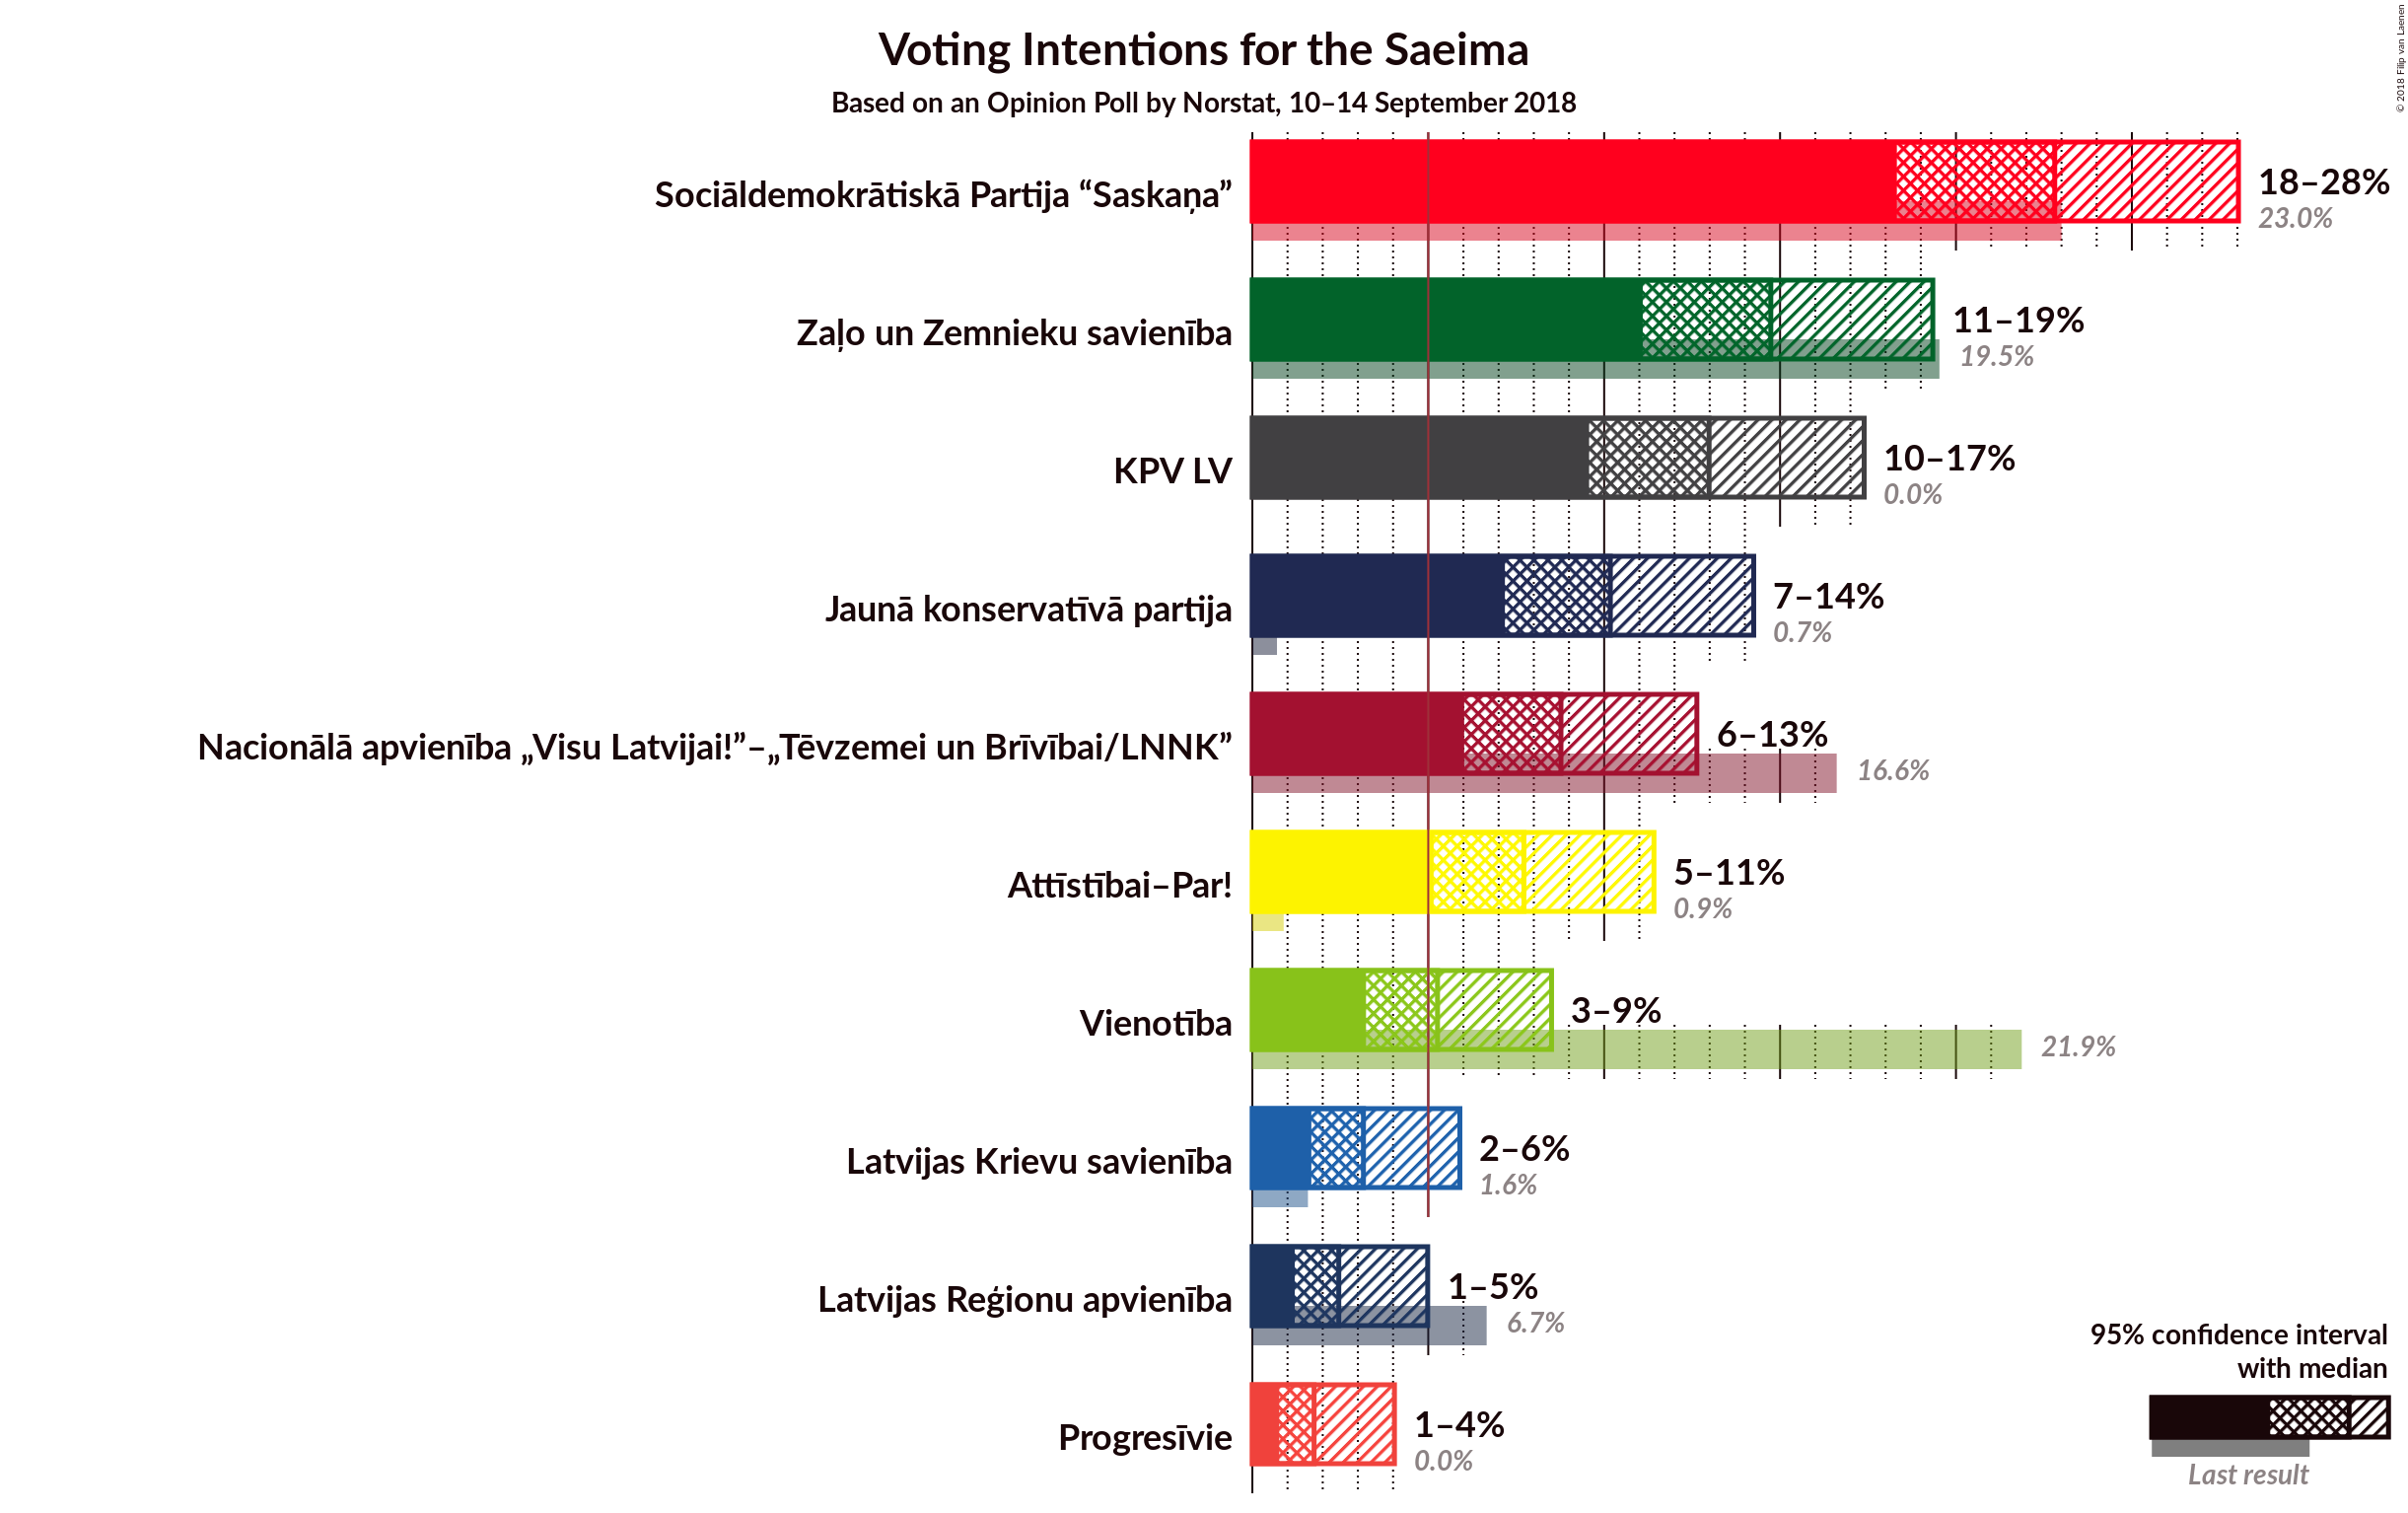
Confidence Intervals
| Party | Last Result | Poll Result | 80% Confidence Interval | 90% Confidence Interval | 95% Confidence Interval | 99% Confidence Interval |
|---|---|---|---|---|---|---|
| Sociāldemokrātiskā Partija “Saskaņa” | 23.0% | 22.8% | 19.8–26.2% | 19.0–27.2% | 18.3–28.0% | 17.0–29.7% |
| Zaļo un Zemnieku savienība | 19.5% | 14.7% | 12.3–17.7% | 11.7–18.6% | 11.1–19.3% | 10.0–20.9% |
| KPV LV | 0.0% | 13.0% | 10.7–15.9% | 10.1–16.7% | 9.6–17.4% | 8.6–18.9% |
| Jaunā konservatīvā partija | 0.7% | 10.2% | 8.2–12.8% | 7.7–13.6% | 7.2–14.3% | 6.3–15.6% |
| Nacionālā apvienība „Visu Latvijai!”–„Tēvzemei un Brīvībai/LNNK” | 16.6% | 8.8% | 7.0–11.3% | 6.4–12.0% | 6.0–12.6% | 5.2–13.9% |
| Attīstībai–Par! | 0.9% | 7.7% | 6.0–10.1% | 5.5–10.8% | 5.2–11.4% | 4.5–12.7% |
| Vienotība | 21.9% | 5.3% | 3.9–7.4% | 3.5–8.0% | 3.2–8.5% | 2.7–9.6% |
| Latvijas Krievu savienība | 1.6% | 3.2% | 2.2–4.9% | 1.9–5.4% | 1.7–5.9% | 1.3–6.9% |
| Latvijas Reģionu apvienība | 6.7% | 2.5% | 1.6–4.1% | 1.4–4.6% | 1.2–5.0% | 0.9–5.9% |
| Progresīvie | 0.0% | 1.8% | 1.1–3.2% | 0.9–3.6% | 0.8–4.0% | 0.5–4.9% |
Note: The poll result column reflects the actual value used in the calculations. Published results may vary slightly, and in addition be rounded to fewer digits.
Seats
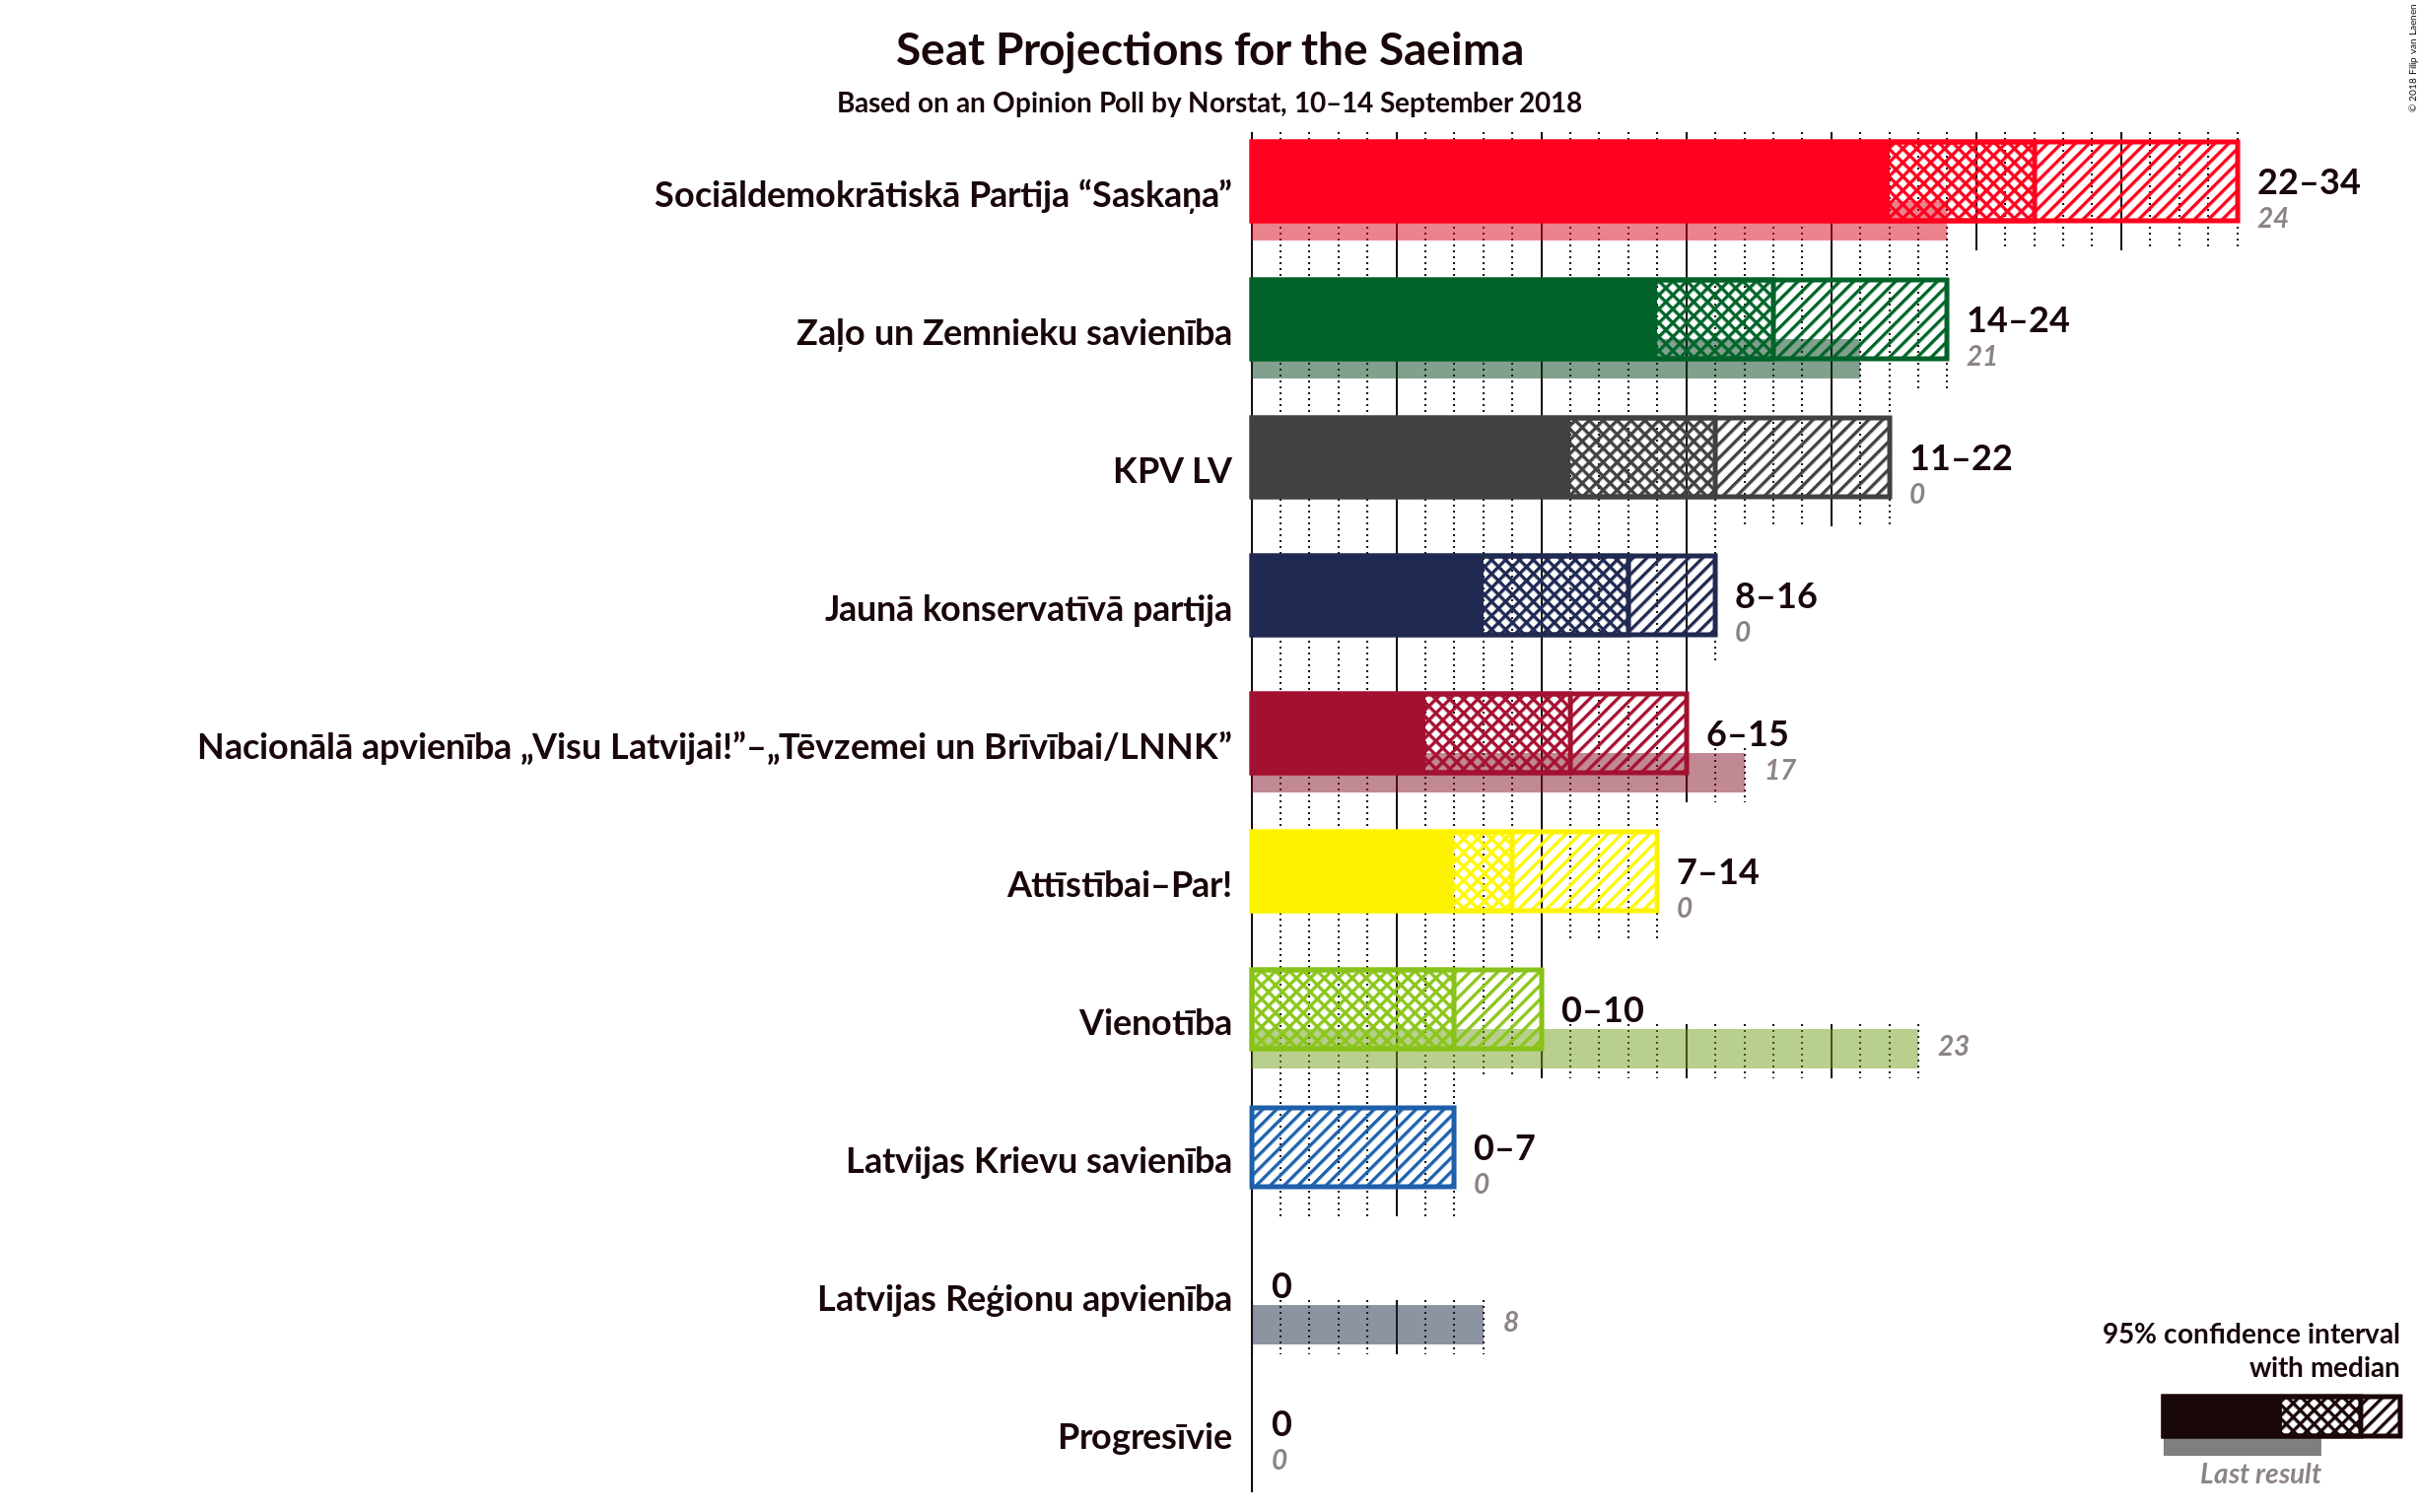
Confidence Intervals
| Party | Last Result | Median | 80% Confidence Interval | 90% Confidence Interval | 95% Confidence Interval | 99% Confidence Interval |
|---|---|---|---|---|---|---|
| Sociāldemokrātiskā Partija “Saskaņa” | 24 | 27 | 24–32 | 23–33 | 22–34 | 20–37 |
| Zaļo un Zemnieku savienība | 21 | 18 | 16–22 | 15–23 | 14–24 | 13–26 |
| KPV LV | 0 | 16 | 13–19 | 12–20 | 11–22 | 10–23 |
| Jaunā konservatīvā partija | 0 | 13 | 9–16 | 8–16 | 8–16 | 7–19 |
| Nacionālā apvienība „Visu Latvijai!”–„Tēvzemei un Brīvībai/LNNK” | 17 | 11 | 7–13 | 7–15 | 6–15 | 6–17 |
| Attīstībai–Par! | 0 | 9 | 7–13 | 7–13 | 7–14 | 0–15 |
| Vienotība | 23 | 7 | 0–8 | 0–10 | 0–10 | 0–11 |
| Latvijas Krievu savienība | 0 | 0 | 0 | 0–7 | 0–7 | 0–8 |
| Latvijas Reģionu apvienība | 8 | 0 | 0 | 0 | 0 | 0–7 |
| Progresīvie | 0 | 0 | 0 | 0 | 0 | 0 |
Sociāldemokrātiskā Partija “Saskaņa”
For a full overview of the results for this party, see the Sociāldemokrātiskā Partija “Saskaņa” page.
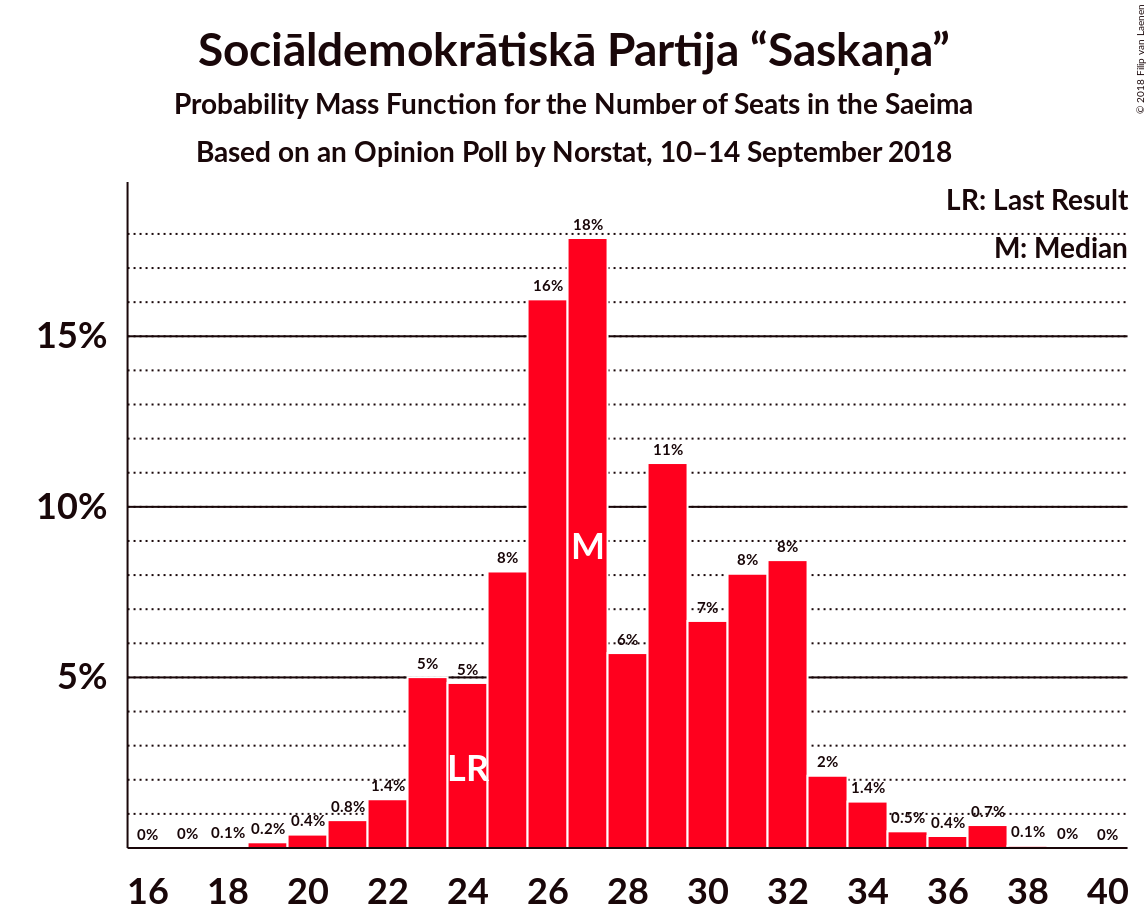
| Number of Seats | Probability | Accumulated | Special Marks |
|---|---|---|---|
| 18 | 0.1% | 100% | |
| 19 | 0.2% | 99.9% | |
| 20 | 0.4% | 99.8% | |
| 21 | 0.8% | 99.4% | |
| 22 | 1.4% | 98.6% | |
| 23 | 5% | 97% | |
| 24 | 5% | 92% | Last Result |
| 25 | 8% | 87% | |
| 26 | 16% | 79% | |
| 27 | 18% | 63% | Median |
| 28 | 6% | 45% | |
| 29 | 11% | 39% | |
| 30 | 7% | 28% | |
| 31 | 8% | 22% | |
| 32 | 8% | 14% | |
| 33 | 2% | 5% | |
| 34 | 1.4% | 3% | |
| 35 | 0.5% | 2% | |
| 36 | 0.4% | 1.1% | |
| 37 | 0.7% | 0.8% | |
| 38 | 0.1% | 0.1% | |
| 39 | 0% | 0% |
Zaļo un Zemnieku savienība
For a full overview of the results for this party, see the Zaļo un Zemnieku savienība page.
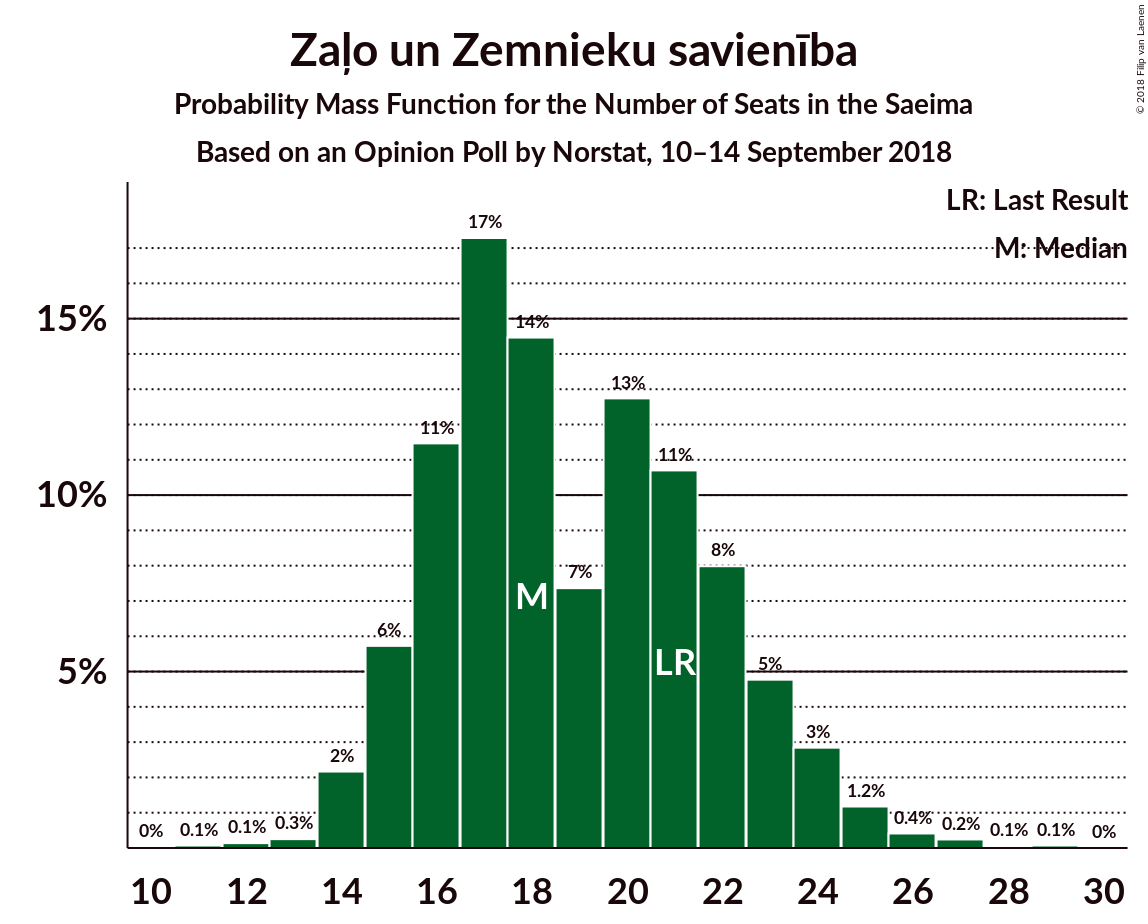
| Number of Seats | Probability | Accumulated | Special Marks |
|---|---|---|---|
| 11 | 0.1% | 100% | |
| 12 | 0.1% | 99.9% | |
| 13 | 0.3% | 99.7% | |
| 14 | 2% | 99.5% | |
| 15 | 6% | 97% | |
| 16 | 11% | 92% | |
| 17 | 17% | 80% | |
| 18 | 14% | 63% | Median |
| 19 | 7% | 48% | |
| 20 | 13% | 41% | |
| 21 | 11% | 28% | Last Result |
| 22 | 8% | 18% | |
| 23 | 5% | 10% | |
| 24 | 3% | 5% | |
| 25 | 1.2% | 2% | |
| 26 | 0.4% | 0.8% | |
| 27 | 0.2% | 0.4% | |
| 28 | 0.1% | 0.2% | |
| 29 | 0.1% | 0.1% | |
| 30 | 0% | 0% |
KPV LV
For a full overview of the results for this party, see the KPV LV page.
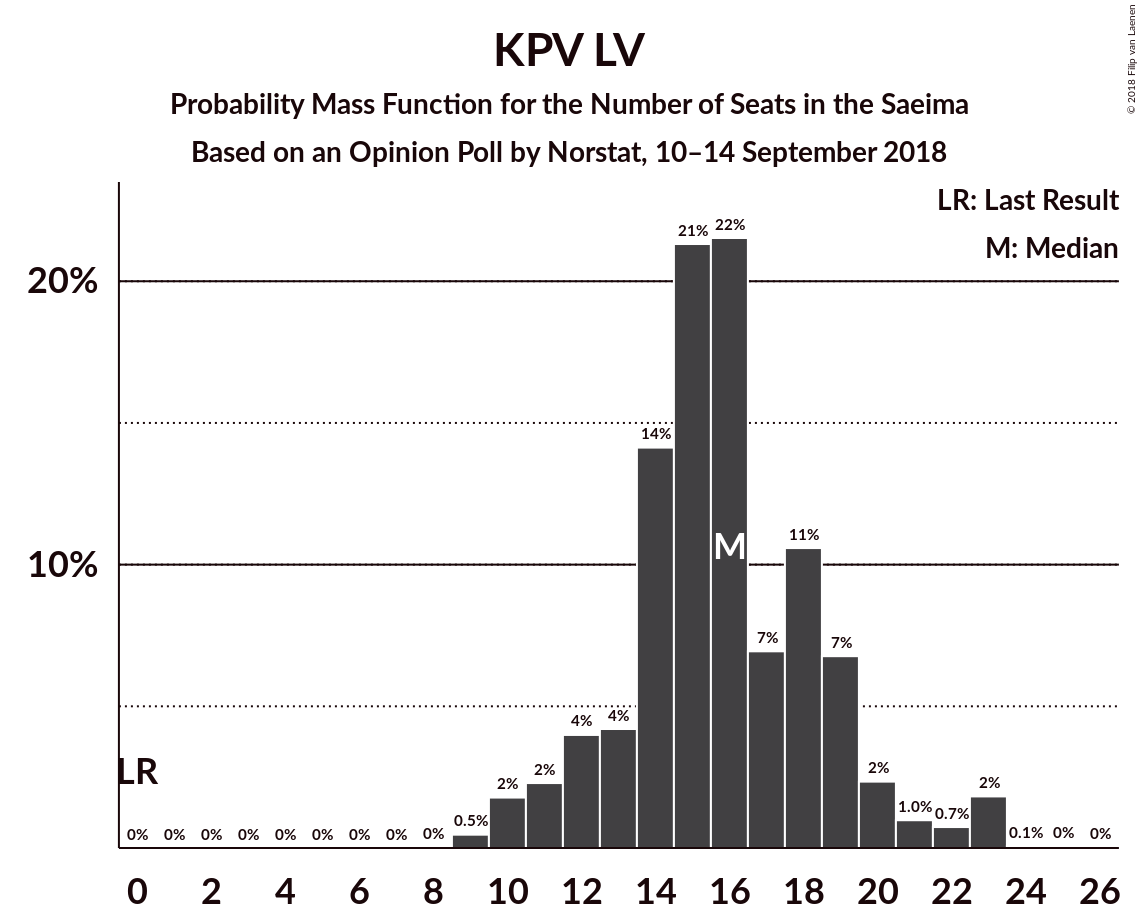
| Number of Seats | Probability | Accumulated | Special Marks |
|---|---|---|---|
| 0 | 0% | 100% | Last Result |
| 1 | 0% | 100% | |
| 2 | 0% | 100% | |
| 3 | 0% | 100% | |
| 4 | 0% | 100% | |
| 5 | 0% | 100% | |
| 6 | 0% | 100% | |
| 7 | 0% | 100% | |
| 8 | 0% | 100% | |
| 9 | 0.5% | 100% | |
| 10 | 2% | 99.5% | |
| 11 | 2% | 98% | |
| 12 | 4% | 95% | |
| 13 | 4% | 91% | |
| 14 | 14% | 87% | |
| 15 | 21% | 73% | |
| 16 | 22% | 52% | Median |
| 17 | 7% | 30% | |
| 18 | 11% | 23% | |
| 19 | 7% | 13% | |
| 20 | 2% | 6% | |
| 21 | 1.0% | 4% | |
| 22 | 0.7% | 3% | |
| 23 | 2% | 2% | |
| 24 | 0.1% | 0.1% | |
| 25 | 0% | 0% |
Jaunā konservatīvā partija
For a full overview of the results for this party, see the Jaunā konservatīvā partija page.
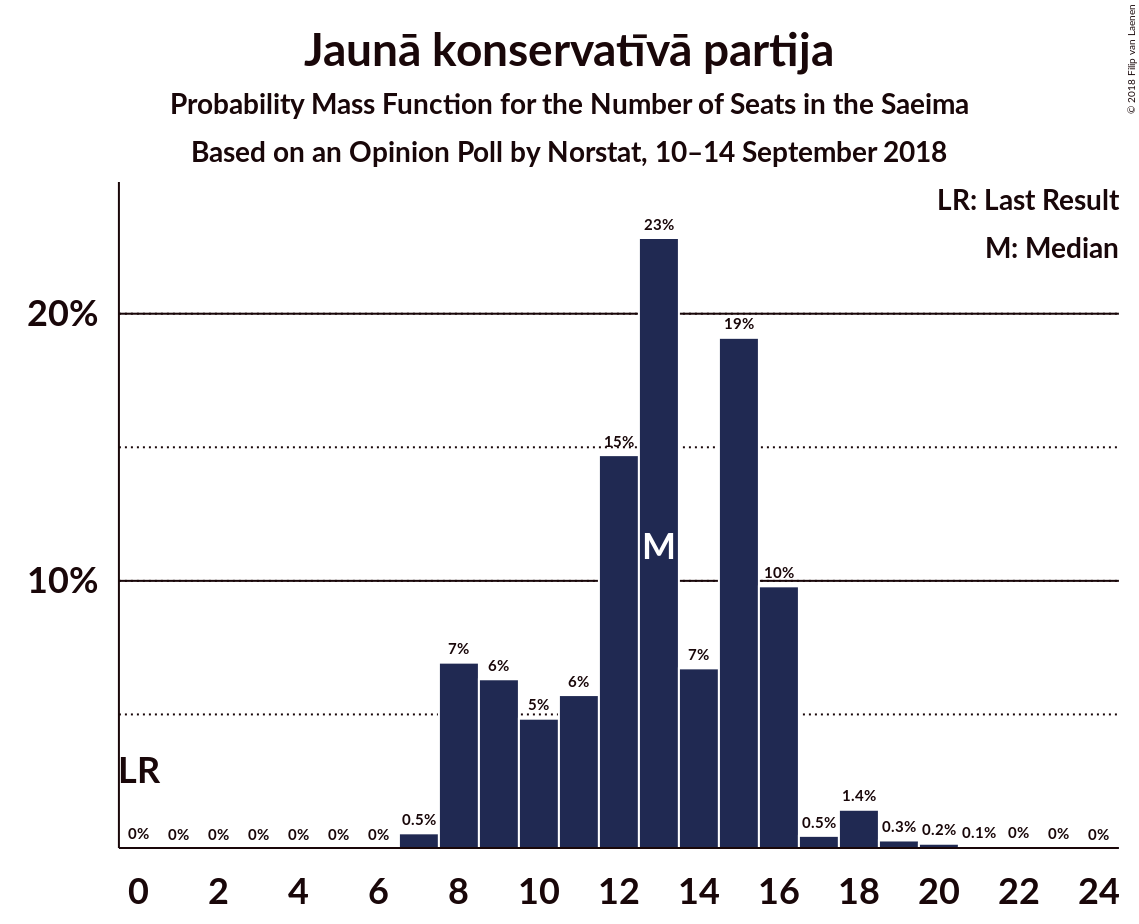
| Number of Seats | Probability | Accumulated | Special Marks |
|---|---|---|---|
| 0 | 0% | 100% | Last Result |
| 1 | 0% | 100% | |
| 2 | 0% | 100% | |
| 3 | 0% | 100% | |
| 4 | 0% | 100% | |
| 5 | 0% | 100% | |
| 6 | 0% | 100% | |
| 7 | 0.5% | 100% | |
| 8 | 7% | 99.4% | |
| 9 | 6% | 92% | |
| 10 | 5% | 86% | |
| 11 | 6% | 81% | |
| 12 | 15% | 76% | |
| 13 | 23% | 61% | Median |
| 14 | 7% | 38% | |
| 15 | 19% | 31% | |
| 16 | 10% | 12% | |
| 17 | 0.5% | 2% | |
| 18 | 1.4% | 2% | |
| 19 | 0.3% | 0.6% | |
| 20 | 0.2% | 0.3% | |
| 21 | 0.1% | 0.1% | |
| 22 | 0% | 0.1% | |
| 23 | 0% | 0% |
Nacionālā apvienība „Visu Latvijai!”–„Tēvzemei un Brīvībai/LNNK”
For a full overview of the results for this party, see the Nacionālā apvienība „Visu Latvijai!”–„Tēvzemei un Brīvībai/LNNK” page.
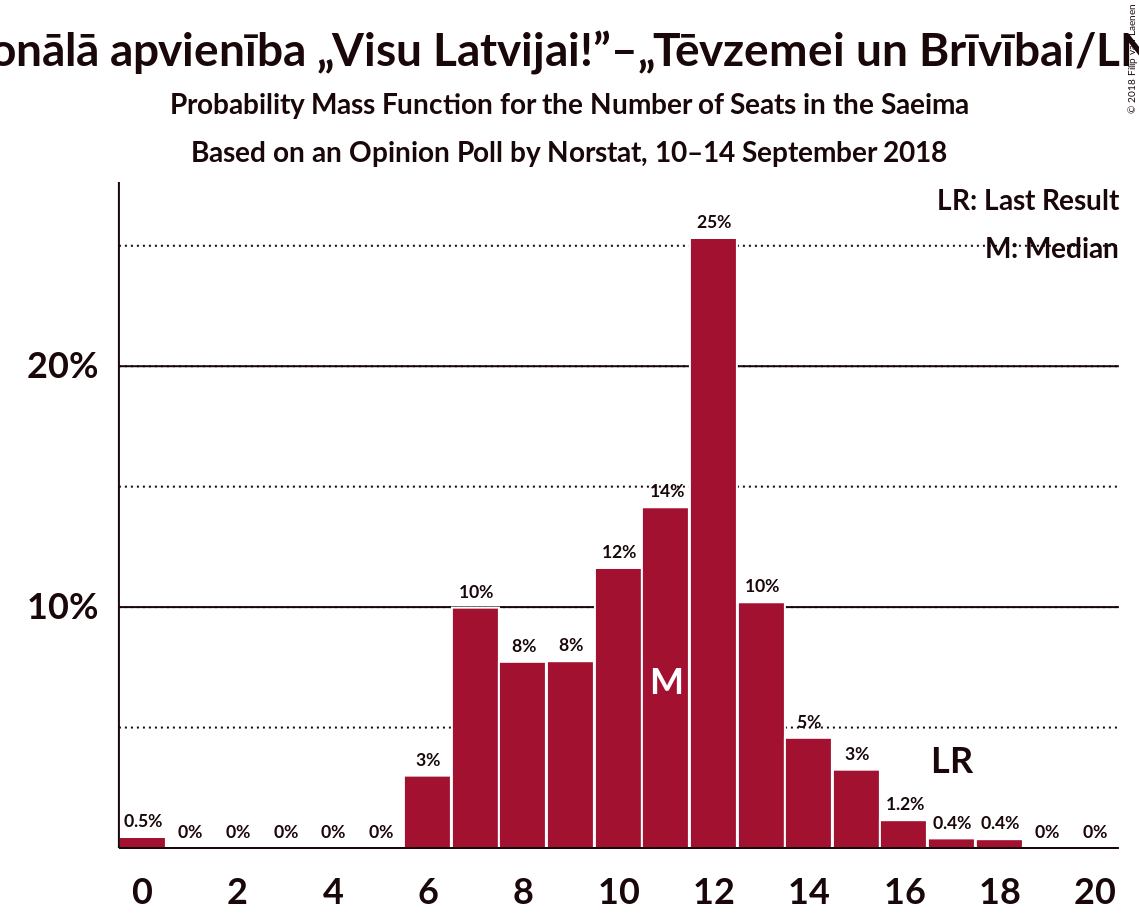
| Number of Seats | Probability | Accumulated | Special Marks |
|---|---|---|---|
| 0 | 0.5% | 100% | |
| 1 | 0% | 99.5% | |
| 2 | 0% | 99.5% | |
| 3 | 0% | 99.5% | |
| 4 | 0% | 99.5% | |
| 5 | 0% | 99.5% | |
| 6 | 3% | 99.5% | |
| 7 | 10% | 97% | |
| 8 | 8% | 87% | |
| 9 | 8% | 79% | |
| 10 | 12% | 71% | |
| 11 | 14% | 59% | Median |
| 12 | 25% | 45% | |
| 13 | 10% | 20% | |
| 14 | 5% | 10% | |
| 15 | 3% | 5% | |
| 16 | 1.2% | 2% | |
| 17 | 0.4% | 0.8% | Last Result |
| 18 | 0.4% | 0.4% | |
| 19 | 0% | 0% |
Attīstībai–Par!
For a full overview of the results for this party, see the Attīstībai–Par! page.
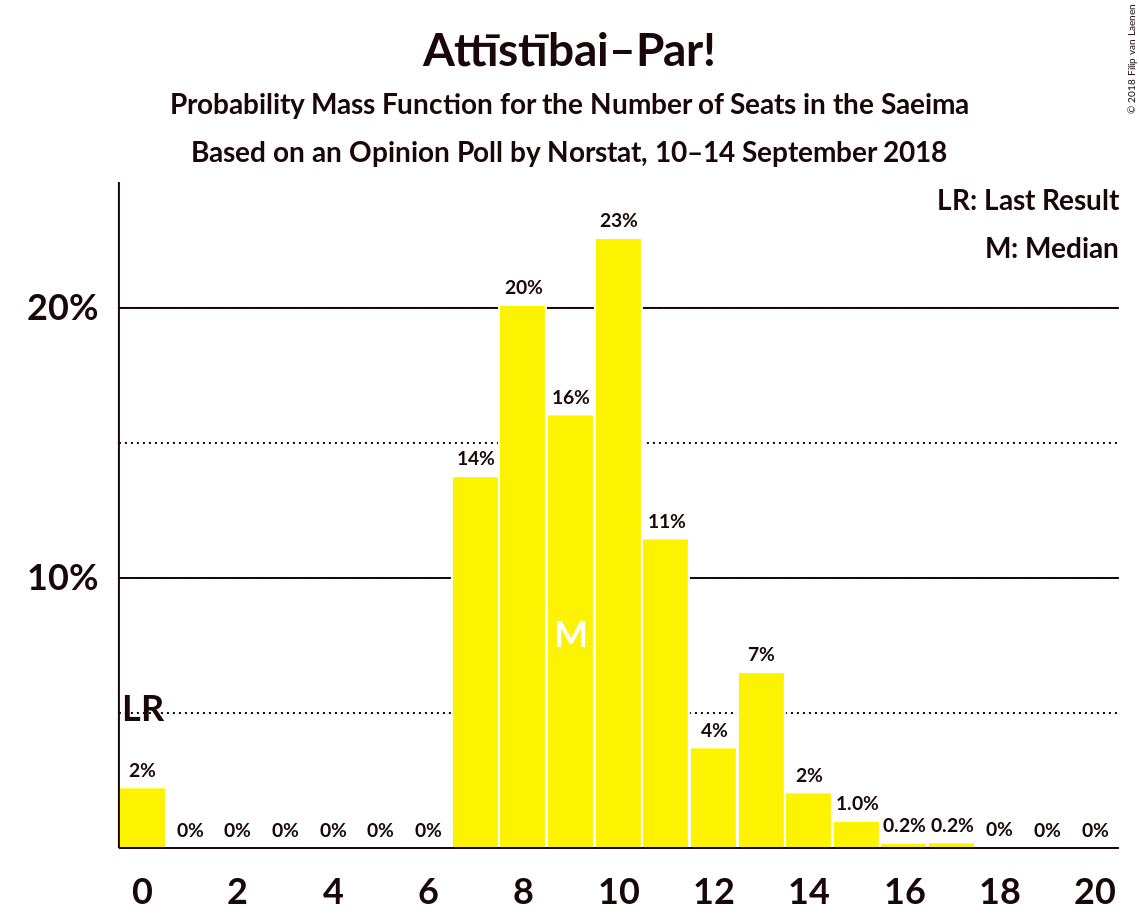
| Number of Seats | Probability | Accumulated | Special Marks |
|---|---|---|---|
| 0 | 2% | 100% | Last Result |
| 1 | 0% | 98% | |
| 2 | 0% | 98% | |
| 3 | 0% | 98% | |
| 4 | 0% | 98% | |
| 5 | 0% | 98% | |
| 6 | 0% | 98% | |
| 7 | 14% | 98% | |
| 8 | 20% | 84% | |
| 9 | 16% | 64% | Median |
| 10 | 23% | 48% | |
| 11 | 11% | 25% | |
| 12 | 4% | 14% | |
| 13 | 7% | 10% | |
| 14 | 2% | 4% | |
| 15 | 1.0% | 1.5% | |
| 16 | 0.2% | 0.5% | |
| 17 | 0.2% | 0.3% | |
| 18 | 0% | 0.1% | |
| 19 | 0% | 0% |
Vienotība
For a full overview of the results for this party, see the Vienotība page.
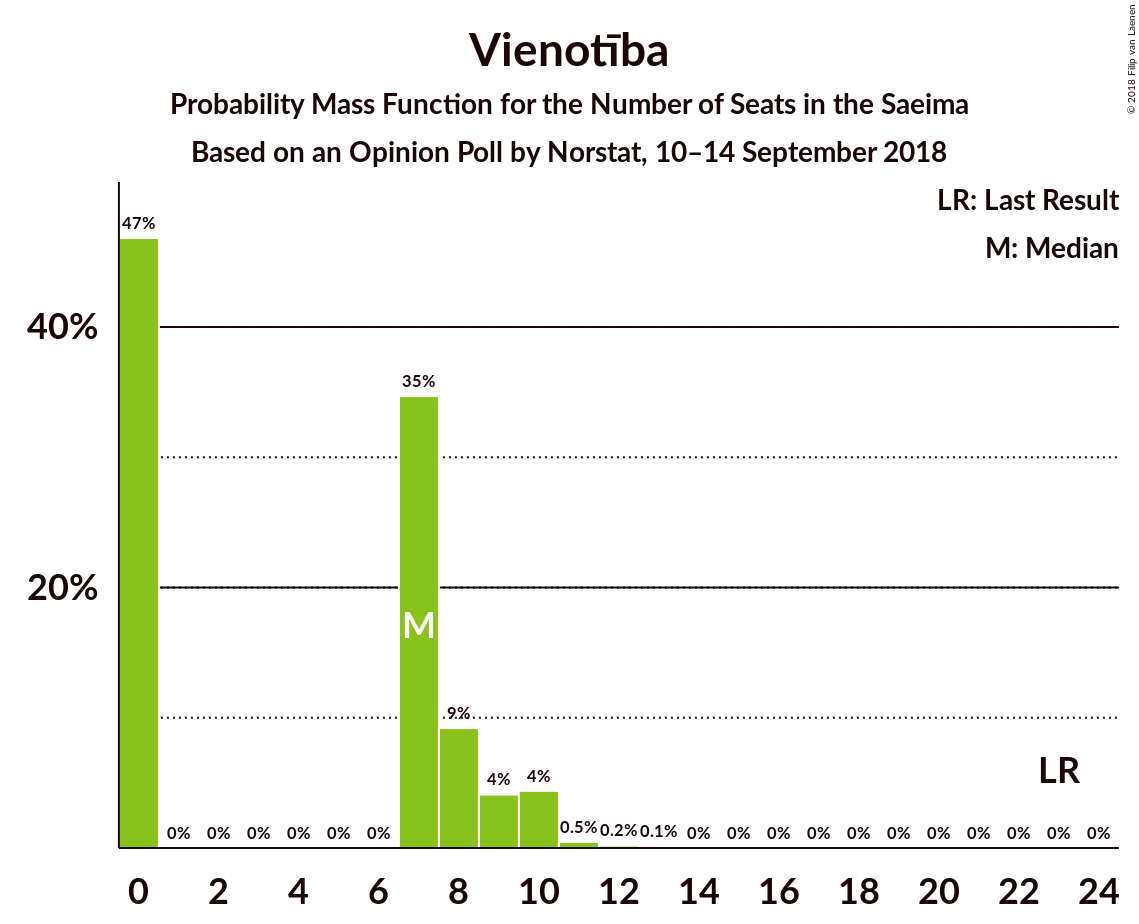
| Number of Seats | Probability | Accumulated | Special Marks |
|---|---|---|---|
| 0 | 47% | 100% | |
| 1 | 0% | 53% | |
| 2 | 0% | 53% | |
| 3 | 0% | 53% | |
| 4 | 0% | 53% | |
| 5 | 0% | 53% | |
| 6 | 0% | 53% | |
| 7 | 35% | 53% | Median |
| 8 | 9% | 18% | |
| 9 | 4% | 9% | |
| 10 | 4% | 5% | |
| 11 | 0.5% | 0.8% | |
| 12 | 0.2% | 0.3% | |
| 13 | 0.1% | 0.1% | |
| 14 | 0% | 0% | |
| 15 | 0% | 0% | |
| 16 | 0% | 0% | |
| 17 | 0% | 0% | |
| 18 | 0% | 0% | |
| 19 | 0% | 0% | |
| 20 | 0% | 0% | |
| 21 | 0% | 0% | |
| 22 | 0% | 0% | |
| 23 | 0% | 0% | Last Result |
Latvijas Krievu savienība
For a full overview of the results for this party, see the Latvijas Krievu savienība page.
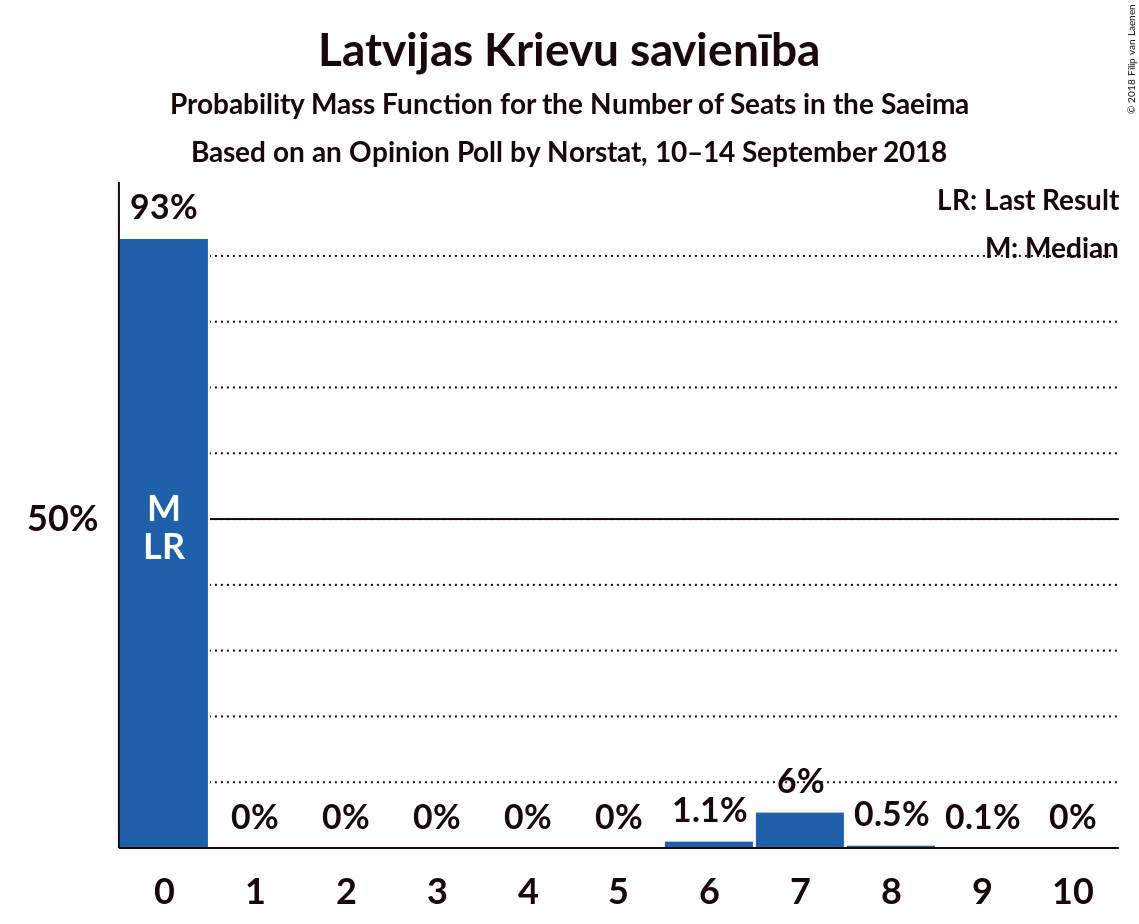
| Number of Seats | Probability | Accumulated | Special Marks |
|---|---|---|---|
| 0 | 93% | 100% | Last Result, Median |
| 1 | 0% | 7% | |
| 2 | 0% | 7% | |
| 3 | 0% | 7% | |
| 4 | 0% | 7% | |
| 5 | 0% | 7% | |
| 6 | 1.1% | 7% | |
| 7 | 6% | 6% | |
| 8 | 0.5% | 0.6% | |
| 9 | 0.1% | 0.1% | |
| 10 | 0% | 0% |
Latvijas Reģionu apvienība
For a full overview of the results for this party, see the Latvijas Reģionu apvienība page.
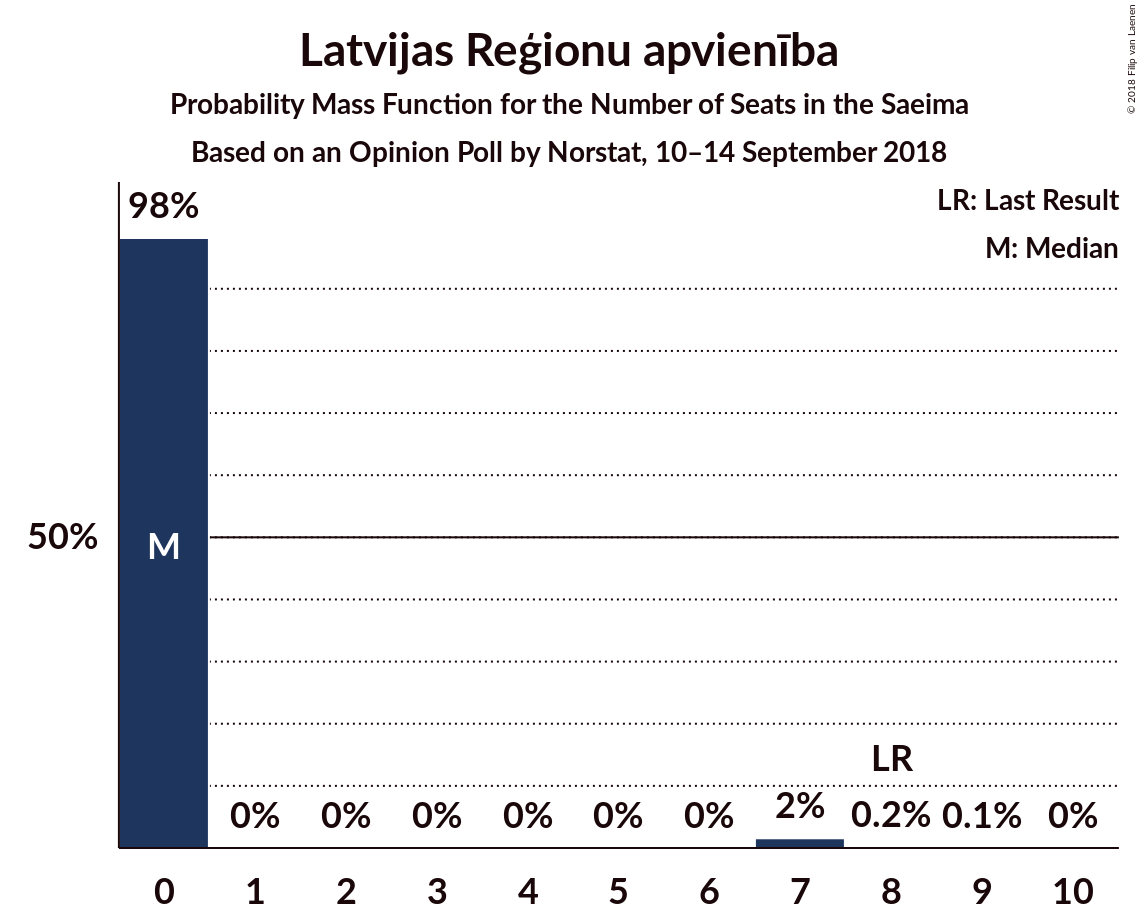
| Number of Seats | Probability | Accumulated | Special Marks |
|---|---|---|---|
| 0 | 98% | 100% | Median |
| 1 | 0% | 2% | |
| 2 | 0% | 2% | |
| 3 | 0% | 2% | |
| 4 | 0% | 2% | |
| 5 | 0% | 2% | |
| 6 | 0% | 2% | |
| 7 | 2% | 2% | |
| 8 | 0.2% | 0.2% | Last Result |
| 9 | 0.1% | 0.1% | |
| 10 | 0% | 0% |
Progresīvie
For a full overview of the results for this party, see the Progresīvie page.
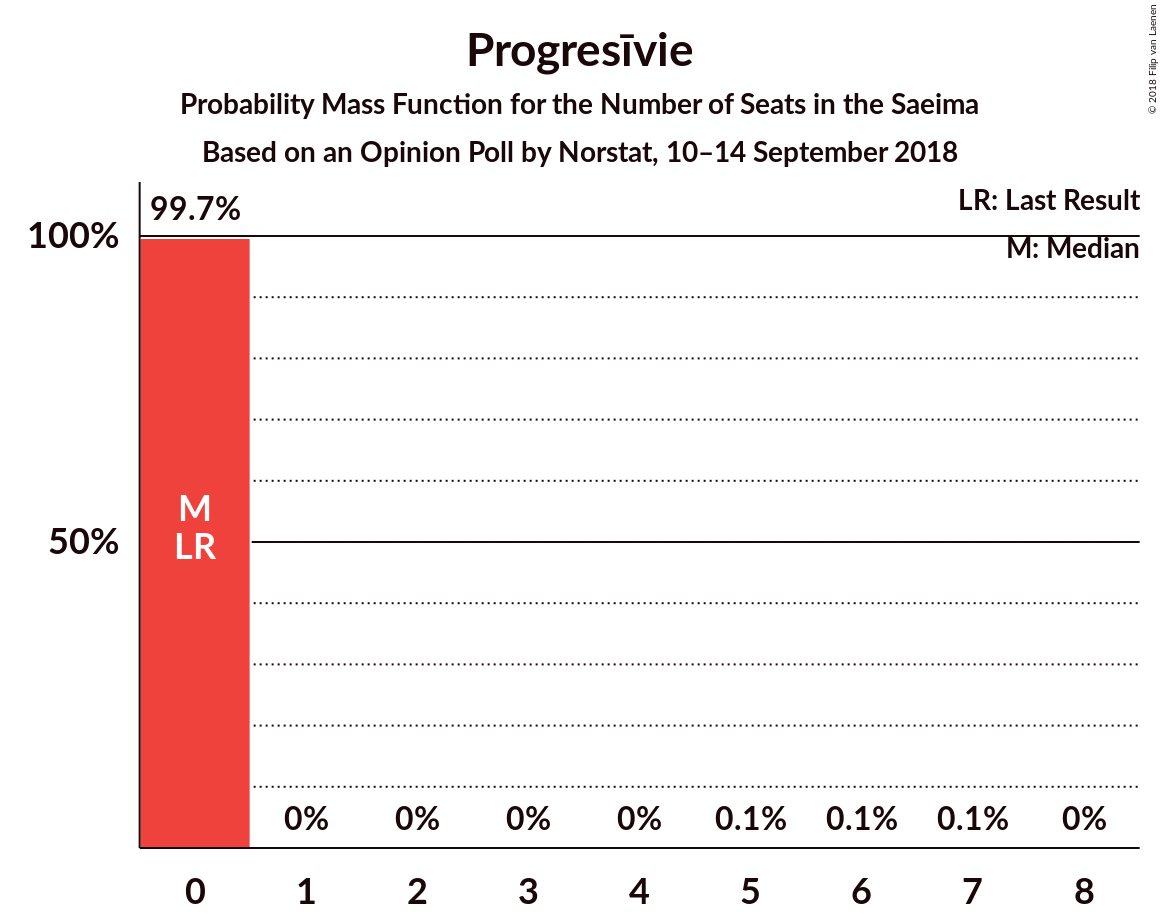
| Number of Seats | Probability | Accumulated | Special Marks |
|---|---|---|---|
| 0 | 99.7% | 100% | Last Result, Median |
| 1 | 0% | 0.3% | |
| 2 | 0% | 0.3% | |
| 3 | 0% | 0.3% | |
| 4 | 0% | 0.3% | |
| 5 | 0.1% | 0.3% | |
| 6 | 0.1% | 0.2% | |
| 7 | 0.1% | 0.1% | |
| 8 | 0% | 0% |
Coalitions
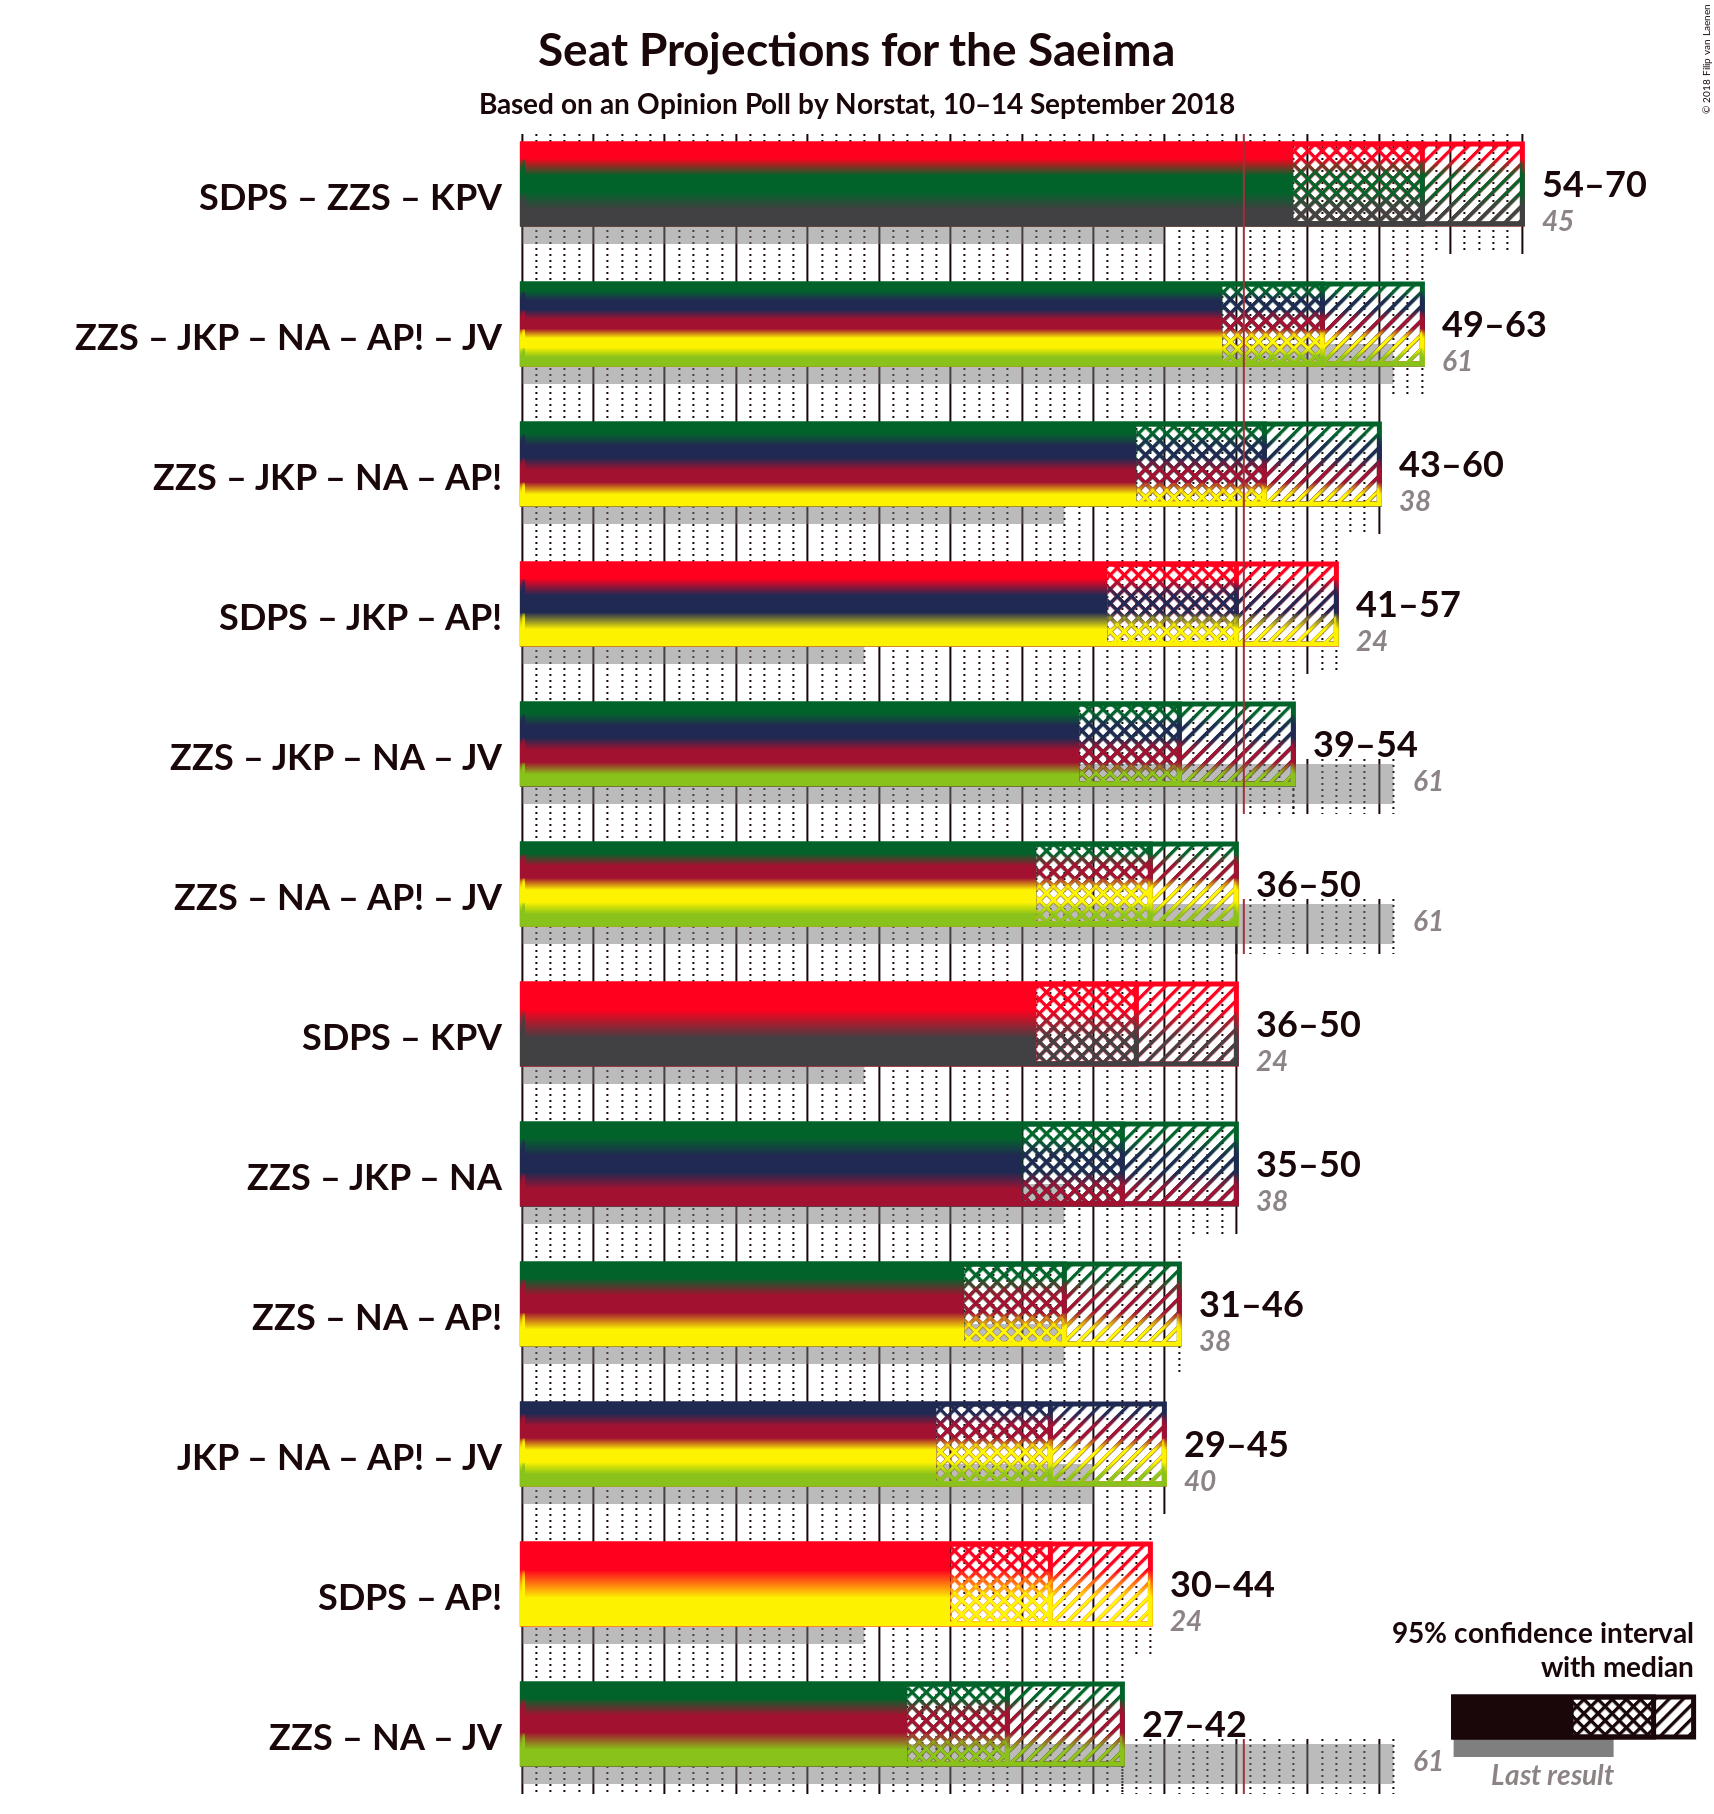
Confidence Intervals
| Coalition | Last Result | Median | Majority? | 80% Confidence Interval | 90% Confidence Interval | 95% Confidence Interval | 99% Confidence Interval |
|---|---|---|---|---|---|---|---|
| Sociāldemokrātiskā Partija “Saskaņa” – Zaļo un Zemnieku savienība – KPV LV | 45 | 63 | 99.8% | 57–68 | 55–70 | 54–70 | 52–74 |
| Zaļo un Zemnieku savienība – Jaunā konservatīvā partija – Nacionālā apvienība „Visu Latvijai!”–„Tēvzemei un Brīvībai/LNNK” – Attīstībai–Par! – Vienotība | 61 | 56 | 93% | 52–60 | 50–61 | 49–63 | 46–65 |
| Zaļo un Zemnieku savienība – Jaunā konservatīvā partija – Nacionālā apvienība „Visu Latvijai!”–„Tēvzemei un Brīvībai/LNNK” – Attīstībai–Par! | 38 | 52 | 70% | 47–56 | 45–58 | 43–60 | 41–62 |
| Sociāldemokrātiskā Partija “Saskaņa” – Jaunā konservatīvā partija – Attīstībai–Par! | 24 | 50 | 45% | 44–56 | 42–56 | 41–57 | 39–60 |
| Zaļo un Zemnieku savienība – Jaunā konservatīvā partija – Nacionālā apvienība „Visu Latvijai!”–„Tēvzemei un Brīvībai/LNNK” – Vienotība | 61 | 46 | 16% | 42–51 | 41–53 | 39–54 | 37–58 |
| Zaļo un Zemnieku savienība – Nacionālā apvienība „Visu Latvijai!”–„Tēvzemei un Brīvībai/LNNK” – Attīstībai–Par! – Vienotība | 61 | 44 | 2% | 37–48 | 37–50 | 36–50 | 33–53 |
| Sociāldemokrātiskā Partija “Saskaņa” – KPV LV | 24 | 43 | 2% | 39–48 | 38–50 | 36–50 | 34–52 |
| Zaļo un Zemnieku savienība – Jaunā konservatīvā partija – Nacionālā apvienība „Visu Latvijai!”–„Tēvzemei un Brīvībai/LNNK” | 38 | 42 | 2% | 38–46 | 36–49 | 35–50 | 32–52 |
| Zaļo un Zemnieku savienība – Nacionālā apvienība „Visu Latvijai!”–„Tēvzemei un Brīvībai/LNNK” – Attīstībai–Par! | 38 | 38 | 0.1% | 35–43 | 33–45 | 31–46 | 30–49 |
| Jaunā konservatīvā partija – Nacionālā apvienība „Visu Latvijai!”–„Tēvzemei un Brīvībai/LNNK” – Attīstībai–Par! – Vienotība | 40 | 37 | 0% | 31–42 | 30–44 | 29–45 | 26–47 |
| Sociāldemokrātiskā Partija “Saskaņa” – Attīstībai–Par! | 24 | 37 | 0% | 32–41 | 32–43 | 30–44 | 27–46 |
| Zaļo un Zemnieku savienība – Nacionālā apvienība „Visu Latvijai!”–„Tēvzemei un Brīvībai/LNNK” – Vienotība | 61 | 34 | 0% | 29–39 | 28–41 | 27–42 | 24–44 |
Sociāldemokrātiskā Partija “Saskaņa” – Zaļo un Zemnieku savienība – KPV LV

| Number of Seats | Probability | Accumulated | Special Marks |
|---|---|---|---|
| 45 | 0% | 100% | Last Result |
| 46 | 0% | 100% | |
| 47 | 0% | 100% | |
| 48 | 0.1% | 100% | |
| 49 | 0% | 99.9% | |
| 50 | 0.1% | 99.9% | |
| 51 | 0.2% | 99.8% | Majority |
| 52 | 0.3% | 99.6% | |
| 53 | 1.0% | 99.3% | |
| 54 | 2% | 98% | |
| 55 | 3% | 96% | |
| 56 | 3% | 94% | |
| 57 | 3% | 91% | |
| 58 | 7% | 88% | |
| 59 | 5% | 81% | |
| 60 | 9% | 76% | |
| 61 | 7% | 67% | Median |
| 62 | 9% | 60% | |
| 63 | 9% | 51% | |
| 64 | 11% | 42% | |
| 65 | 14% | 32% | |
| 66 | 2% | 17% | |
| 67 | 4% | 15% | |
| 68 | 3% | 11% | |
| 69 | 2% | 8% | |
| 70 | 3% | 6% | |
| 71 | 1.2% | 2% | |
| 72 | 0.3% | 1.3% | |
| 73 | 0.2% | 1.0% | |
| 74 | 0.5% | 0.8% | |
| 75 | 0.2% | 0.3% | |
| 76 | 0% | 0.1% | |
| 77 | 0% | 0.1% | |
| 78 | 0% | 0% |
Zaļo un Zemnieku savienība – Jaunā konservatīvā partija – Nacionālā apvienība „Visu Latvijai!”–„Tēvzemei un Brīvībai/LNNK” – Attīstībai–Par! – Vienotība

| Number of Seats | Probability | Accumulated | Special Marks |
|---|---|---|---|
| 42 | 0.1% | 100% | |
| 43 | 0% | 99.9% | |
| 44 | 0.1% | 99.9% | |
| 45 | 0.1% | 99.8% | |
| 46 | 0.2% | 99.7% | |
| 47 | 0.5% | 99.4% | |
| 48 | 0.6% | 98.9% | |
| 49 | 2% | 98% | |
| 50 | 4% | 97% | |
| 51 | 3% | 93% | Majority |
| 52 | 7% | 90% | |
| 53 | 19% | 83% | |
| 54 | 6% | 64% | |
| 55 | 5% | 58% | |
| 56 | 6% | 53% | |
| 57 | 11% | 47% | |
| 58 | 11% | 37% | Median |
| 59 | 7% | 26% | |
| 60 | 11% | 19% | |
| 61 | 3% | 8% | Last Result |
| 62 | 2% | 4% | |
| 63 | 1.3% | 3% | |
| 64 | 0.3% | 2% | |
| 65 | 0.9% | 1.3% | |
| 66 | 0.3% | 0.4% | |
| 67 | 0.1% | 0.1% | |
| 68 | 0% | 0% |
Zaļo un Zemnieku savienība – Jaunā konservatīvā partija – Nacionālā apvienība „Visu Latvijai!”–„Tēvzemei un Brīvībai/LNNK” – Attīstībai–Par!

| Number of Seats | Probability | Accumulated | Special Marks |
|---|---|---|---|
| 38 | 0% | 100% | Last Result |
| 39 | 0.1% | 99.9% | |
| 40 | 0.1% | 99.9% | |
| 41 | 0.5% | 99.8% | |
| 42 | 0.6% | 99.3% | |
| 43 | 1.3% | 98.7% | |
| 44 | 2% | 97% | |
| 45 | 1.4% | 96% | |
| 46 | 4% | 94% | |
| 47 | 3% | 90% | |
| 48 | 3% | 88% | |
| 49 | 5% | 85% | |
| 50 | 11% | 81% | |
| 51 | 12% | 70% | Median, Majority |
| 52 | 14% | 58% | |
| 53 | 23% | 44% | |
| 54 | 5% | 21% | |
| 55 | 3% | 16% | |
| 56 | 3% | 12% | |
| 57 | 4% | 9% | |
| 58 | 1.4% | 6% | |
| 59 | 1.4% | 4% | |
| 60 | 2% | 3% | |
| 61 | 0.3% | 1.1% | |
| 62 | 0.4% | 0.8% | |
| 63 | 0.2% | 0.4% | |
| 64 | 0.1% | 0.1% | |
| 65 | 0% | 0% |
Sociāldemokrātiskā Partija “Saskaņa” – Jaunā konservatīvā partija – Attīstībai–Par!

| Number of Seats | Probability | Accumulated | Special Marks |
|---|---|---|---|
| 24 | 0% | 100% | Last Result |
| 25 | 0% | 100% | |
| 26 | 0% | 100% | |
| 27 | 0% | 100% | |
| 28 | 0% | 100% | |
| 29 | 0% | 100% | |
| 30 | 0% | 100% | |
| 31 | 0% | 100% | |
| 32 | 0% | 100% | |
| 33 | 0% | 100% | |
| 34 | 0% | 100% | |
| 35 | 0% | 100% | |
| 36 | 0% | 100% | |
| 37 | 0.1% | 99.9% | |
| 38 | 0.2% | 99.8% | |
| 39 | 0.2% | 99.7% | |
| 40 | 0.7% | 99.5% | |
| 41 | 3% | 98.8% | |
| 42 | 1.2% | 96% | |
| 43 | 4% | 95% | |
| 44 | 4% | 91% | |
| 45 | 4% | 87% | |
| 46 | 2% | 83% | |
| 47 | 6% | 81% | |
| 48 | 6% | 75% | |
| 49 | 11% | 68% | Median |
| 50 | 12% | 57% | |
| 51 | 7% | 45% | Majority |
| 52 | 9% | 38% | |
| 53 | 12% | 29% | |
| 54 | 3% | 17% | |
| 55 | 2% | 14% | |
| 56 | 10% | 13% | |
| 57 | 1.4% | 3% | |
| 58 | 0.9% | 2% | |
| 59 | 0.2% | 0.8% | |
| 60 | 0.2% | 0.6% | |
| 61 | 0.1% | 0.4% | |
| 62 | 0.1% | 0.2% | |
| 63 | 0.1% | 0.1% | |
| 64 | 0% | 0% |
Zaļo un Zemnieku savienība – Jaunā konservatīvā partija – Nacionālā apvienība „Visu Latvijai!”–„Tēvzemei un Brīvībai/LNNK” – Vienotība

| Number of Seats | Probability | Accumulated | Special Marks |
|---|---|---|---|
| 33 | 0% | 100% | |
| 34 | 0% | 99.9% | |
| 35 | 0.1% | 99.9% | |
| 36 | 0.2% | 99.8% | |
| 37 | 0.4% | 99.6% | |
| 38 | 0.8% | 99.2% | |
| 39 | 1.1% | 98% | |
| 40 | 0.9% | 97% | |
| 41 | 3% | 96% | |
| 42 | 10% | 94% | |
| 43 | 4% | 84% | |
| 44 | 14% | 80% | |
| 45 | 12% | 66% | |
| 46 | 8% | 55% | |
| 47 | 6% | 46% | |
| 48 | 8% | 40% | |
| 49 | 11% | 32% | Median |
| 50 | 5% | 21% | |
| 51 | 7% | 16% | Majority |
| 52 | 3% | 9% | |
| 53 | 2% | 5% | |
| 54 | 1.4% | 3% | |
| 55 | 0.4% | 2% | |
| 56 | 0.4% | 1.1% | |
| 57 | 0.1% | 0.7% | |
| 58 | 0.3% | 0.5% | |
| 59 | 0.2% | 0.2% | |
| 60 | 0.1% | 0.1% | |
| 61 | 0% | 0% | Last Result |
Zaļo un Zemnieku savienība – Nacionālā apvienība „Visu Latvijai!”–„Tēvzemei un Brīvībai/LNNK” – Attīstībai–Par! – Vienotība

| Number of Seats | Probability | Accumulated | Special Marks |
|---|---|---|---|
| 28 | 0% | 100% | |
| 29 | 0.1% | 99.9% | |
| 30 | 0.1% | 99.9% | |
| 31 | 0.1% | 99.8% | |
| 32 | 0.1% | 99.7% | |
| 33 | 0.2% | 99.5% | |
| 34 | 0.4% | 99.3% | |
| 35 | 0.9% | 98.9% | |
| 36 | 1.0% | 98% | |
| 37 | 8% | 97% | |
| 38 | 9% | 89% | |
| 39 | 7% | 80% | |
| 40 | 6% | 72% | |
| 41 | 3% | 66% | |
| 42 | 6% | 63% | |
| 43 | 7% | 57% | |
| 44 | 7% | 50% | |
| 45 | 14% | 43% | Median |
| 46 | 6% | 29% | |
| 47 | 6% | 22% | |
| 48 | 7% | 16% | |
| 49 | 4% | 9% | |
| 50 | 3% | 5% | |
| 51 | 1.3% | 2% | Majority |
| 52 | 0.3% | 1.1% | |
| 53 | 0.4% | 0.8% | |
| 54 | 0.3% | 0.4% | |
| 55 | 0% | 0.1% | |
| 56 | 0% | 0.1% | |
| 57 | 0% | 0% | |
| 58 | 0% | 0% | |
| 59 | 0% | 0% | |
| 60 | 0% | 0% | |
| 61 | 0% | 0% | Last Result |
Sociāldemokrātiskā Partija “Saskaņa” – KPV LV

| Number of Seats | Probability | Accumulated | Special Marks |
|---|---|---|---|
| 24 | 0% | 100% | Last Result |
| 25 | 0% | 100% | |
| 26 | 0% | 100% | |
| 27 | 0% | 100% | |
| 28 | 0% | 100% | |
| 29 | 0% | 100% | |
| 30 | 0% | 100% | |
| 31 | 0% | 100% | |
| 32 | 0% | 100% | |
| 33 | 0.1% | 99.9% | |
| 34 | 0.4% | 99.8% | |
| 35 | 1.3% | 99.4% | |
| 36 | 0.6% | 98% | |
| 37 | 2% | 97% | |
| 38 | 3% | 96% | |
| 39 | 4% | 93% | |
| 40 | 12% | 89% | |
| 41 | 9% | 77% | |
| 42 | 11% | 68% | |
| 43 | 11% | 57% | Median |
| 44 | 6% | 46% | |
| 45 | 4% | 40% | |
| 46 | 5% | 36% | |
| 47 | 18% | 30% | |
| 48 | 5% | 12% | |
| 49 | 2% | 7% | |
| 50 | 4% | 5% | |
| 51 | 1.0% | 2% | Majority |
| 52 | 0.4% | 0.8% | |
| 53 | 0.2% | 0.5% | |
| 54 | 0.2% | 0.3% | |
| 55 | 0% | 0.1% | |
| 56 | 0% | 0.1% | |
| 57 | 0% | 0% |
Zaļo un Zemnieku savienība – Jaunā konservatīvā partija – Nacionālā apvienība „Visu Latvijai!”–„Tēvzemei un Brīvībai/LNNK”

| Number of Seats | Probability | Accumulated | Special Marks |
|---|---|---|---|
| 30 | 0% | 100% | |
| 31 | 0.1% | 99.9% | |
| 32 | 0.5% | 99.8% | |
| 33 | 0.4% | 99.3% | |
| 34 | 0.6% | 98.9% | |
| 35 | 2% | 98% | |
| 36 | 2% | 96% | |
| 37 | 4% | 94% | |
| 38 | 5% | 90% | Last Result |
| 39 | 5% | 85% | |
| 40 | 6% | 80% | |
| 41 | 8% | 74% | |
| 42 | 17% | 67% | Median |
| 43 | 10% | 50% | |
| 44 | 14% | 40% | |
| 45 | 11% | 25% | |
| 46 | 6% | 14% | |
| 47 | 1.5% | 9% | |
| 48 | 2% | 7% | |
| 49 | 2% | 5% | |
| 50 | 1.2% | 3% | |
| 51 | 0.8% | 2% | Majority |
| 52 | 0.6% | 1.0% | |
| 53 | 0.2% | 0.4% | |
| 54 | 0.1% | 0.2% | |
| 55 | 0% | 0.1% | |
| 56 | 0% | 0% |
Zaļo un Zemnieku savienība – Nacionālā apvienība „Visu Latvijai!”–„Tēvzemei un Brīvībai/LNNK” – Attīstībai–Par!

| Number of Seats | Probability | Accumulated | Special Marks |
|---|---|---|---|
| 26 | 0.1% | 100% | |
| 27 | 0.1% | 99.9% | |
| 28 | 0.1% | 99.8% | |
| 29 | 0.2% | 99.7% | |
| 30 | 0.6% | 99.5% | |
| 31 | 1.5% | 98.9% | |
| 32 | 1.2% | 97% | |
| 33 | 3% | 96% | |
| 34 | 2% | 93% | |
| 35 | 3% | 91% | |
| 36 | 4% | 88% | |
| 37 | 14% | 84% | |
| 38 | 21% | 70% | Last Result, Median |
| 39 | 10% | 49% | |
| 40 | 11% | 39% | |
| 41 | 6% | 28% | |
| 42 | 8% | 22% | |
| 43 | 5% | 14% | |
| 44 | 3% | 9% | |
| 45 | 2% | 6% | |
| 46 | 2% | 4% | |
| 47 | 1.3% | 2% | |
| 48 | 0.4% | 0.9% | |
| 49 | 0.3% | 0.5% | |
| 50 | 0.2% | 0.3% | |
| 51 | 0% | 0.1% | Majority |
| 52 | 0% | 0% |
Jaunā konservatīvā partija – Nacionālā apvienība „Visu Latvijai!”–„Tēvzemei un Brīvībai/LNNK” – Attīstībai–Par! – Vienotība

| Number of Seats | Probability | Accumulated | Special Marks |
|---|---|---|---|
| 23 | 0.1% | 100% | |
| 24 | 0% | 99.9% | |
| 25 | 0.3% | 99.9% | |
| 26 | 0.5% | 99.6% | |
| 27 | 0.4% | 99.0% | |
| 28 | 0.4% | 98.7% | |
| 29 | 2% | 98% | |
| 30 | 5% | 96% | |
| 31 | 3% | 92% | |
| 32 | 4% | 89% | |
| 33 | 5% | 85% | |
| 34 | 3% | 80% | |
| 35 | 15% | 78% | |
| 36 | 10% | 63% | |
| 37 | 8% | 53% | |
| 38 | 9% | 45% | |
| 39 | 7% | 35% | |
| 40 | 8% | 28% | Last Result, Median |
| 41 | 5% | 20% | |
| 42 | 7% | 15% | |
| 43 | 3% | 9% | |
| 44 | 2% | 6% | |
| 45 | 2% | 4% | |
| 46 | 1.2% | 2% | |
| 47 | 0.6% | 0.8% | |
| 48 | 0.1% | 0.2% | |
| 49 | 0% | 0.1% | |
| 50 | 0% | 0% |
Sociāldemokrātiskā Partija “Saskaņa” – Attīstībai–Par!

| Number of Seats | Probability | Accumulated | Special Marks |
|---|---|---|---|
| 24 | 0% | 100% | Last Result |
| 25 | 0.1% | 99.9% | |
| 26 | 0.1% | 99.8% | |
| 27 | 0.4% | 99.7% | |
| 28 | 0.5% | 99.2% | |
| 29 | 0.7% | 98.7% | |
| 30 | 1.4% | 98% | |
| 31 | 1.1% | 97% | |
| 32 | 6% | 96% | |
| 33 | 4% | 90% | |
| 34 | 5% | 86% | |
| 35 | 14% | 81% | |
| 36 | 8% | 67% | Median |
| 37 | 16% | 58% | |
| 38 | 7% | 42% | |
| 39 | 7% | 35% | |
| 40 | 10% | 28% | |
| 41 | 9% | 17% | |
| 42 | 2% | 8% | |
| 43 | 3% | 6% | |
| 44 | 1.4% | 3% | |
| 45 | 0.8% | 2% | |
| 46 | 0.4% | 0.9% | |
| 47 | 0.2% | 0.4% | |
| 48 | 0.2% | 0.3% | |
| 49 | 0.1% | 0.1% | |
| 50 | 0% | 0% |
Zaļo un Zemnieku savienība – Nacionālā apvienība „Visu Latvijai!”–„Tēvzemei un Brīvībai/LNNK” – Vienotība

| Number of Seats | Probability | Accumulated | Special Marks |
|---|---|---|---|
| 22 | 0.1% | 100% | |
| 23 | 0.2% | 99.9% | |
| 24 | 0.4% | 99.7% | |
| 25 | 0.7% | 99.3% | |
| 26 | 1.0% | 98.6% | |
| 27 | 1.2% | 98% | |
| 28 | 2% | 96% | |
| 29 | 17% | 94% | |
| 30 | 6% | 77% | |
| 31 | 8% | 71% | |
| 32 | 7% | 64% | |
| 33 | 5% | 57% | |
| 34 | 8% | 52% | |
| 35 | 12% | 44% | |
| 36 | 5% | 32% | Median |
| 37 | 8% | 27% | |
| 38 | 4% | 19% | |
| 39 | 5% | 14% | |
| 40 | 3% | 10% | |
| 41 | 4% | 6% | |
| 42 | 0.9% | 3% | |
| 43 | 0.7% | 2% | |
| 44 | 0.6% | 1.0% | |
| 45 | 0.3% | 0.4% | |
| 46 | 0.1% | 0.1% | |
| 47 | 0% | 0.1% | |
| 48 | 0% | 0% | |
| 49 | 0% | 0% | |
| 50 | 0% | 0% | |
| 51 | 0% | 0% | Majority |
| 52 | 0% | 0% | |
| 53 | 0% | 0% | |
| 54 | 0% | 0% | |
| 55 | 0% | 0% | |
| 56 | 0% | 0% | |
| 57 | 0% | 0% | |
| 58 | 0% | 0% | |
| 59 | 0% | 0% | |
| 60 | 0% | 0% | |
| 61 | 0% | 0% | Last Result |
Technical Information
Opinion Poll
- Polling firm: Norstat
- Commissioner(s): —
- Fieldwork period: 10–14 September 2018
Calculations
- Sample size: 285
- Simulations done: 1,048,576
- Error estimate: 3.09%