Overview
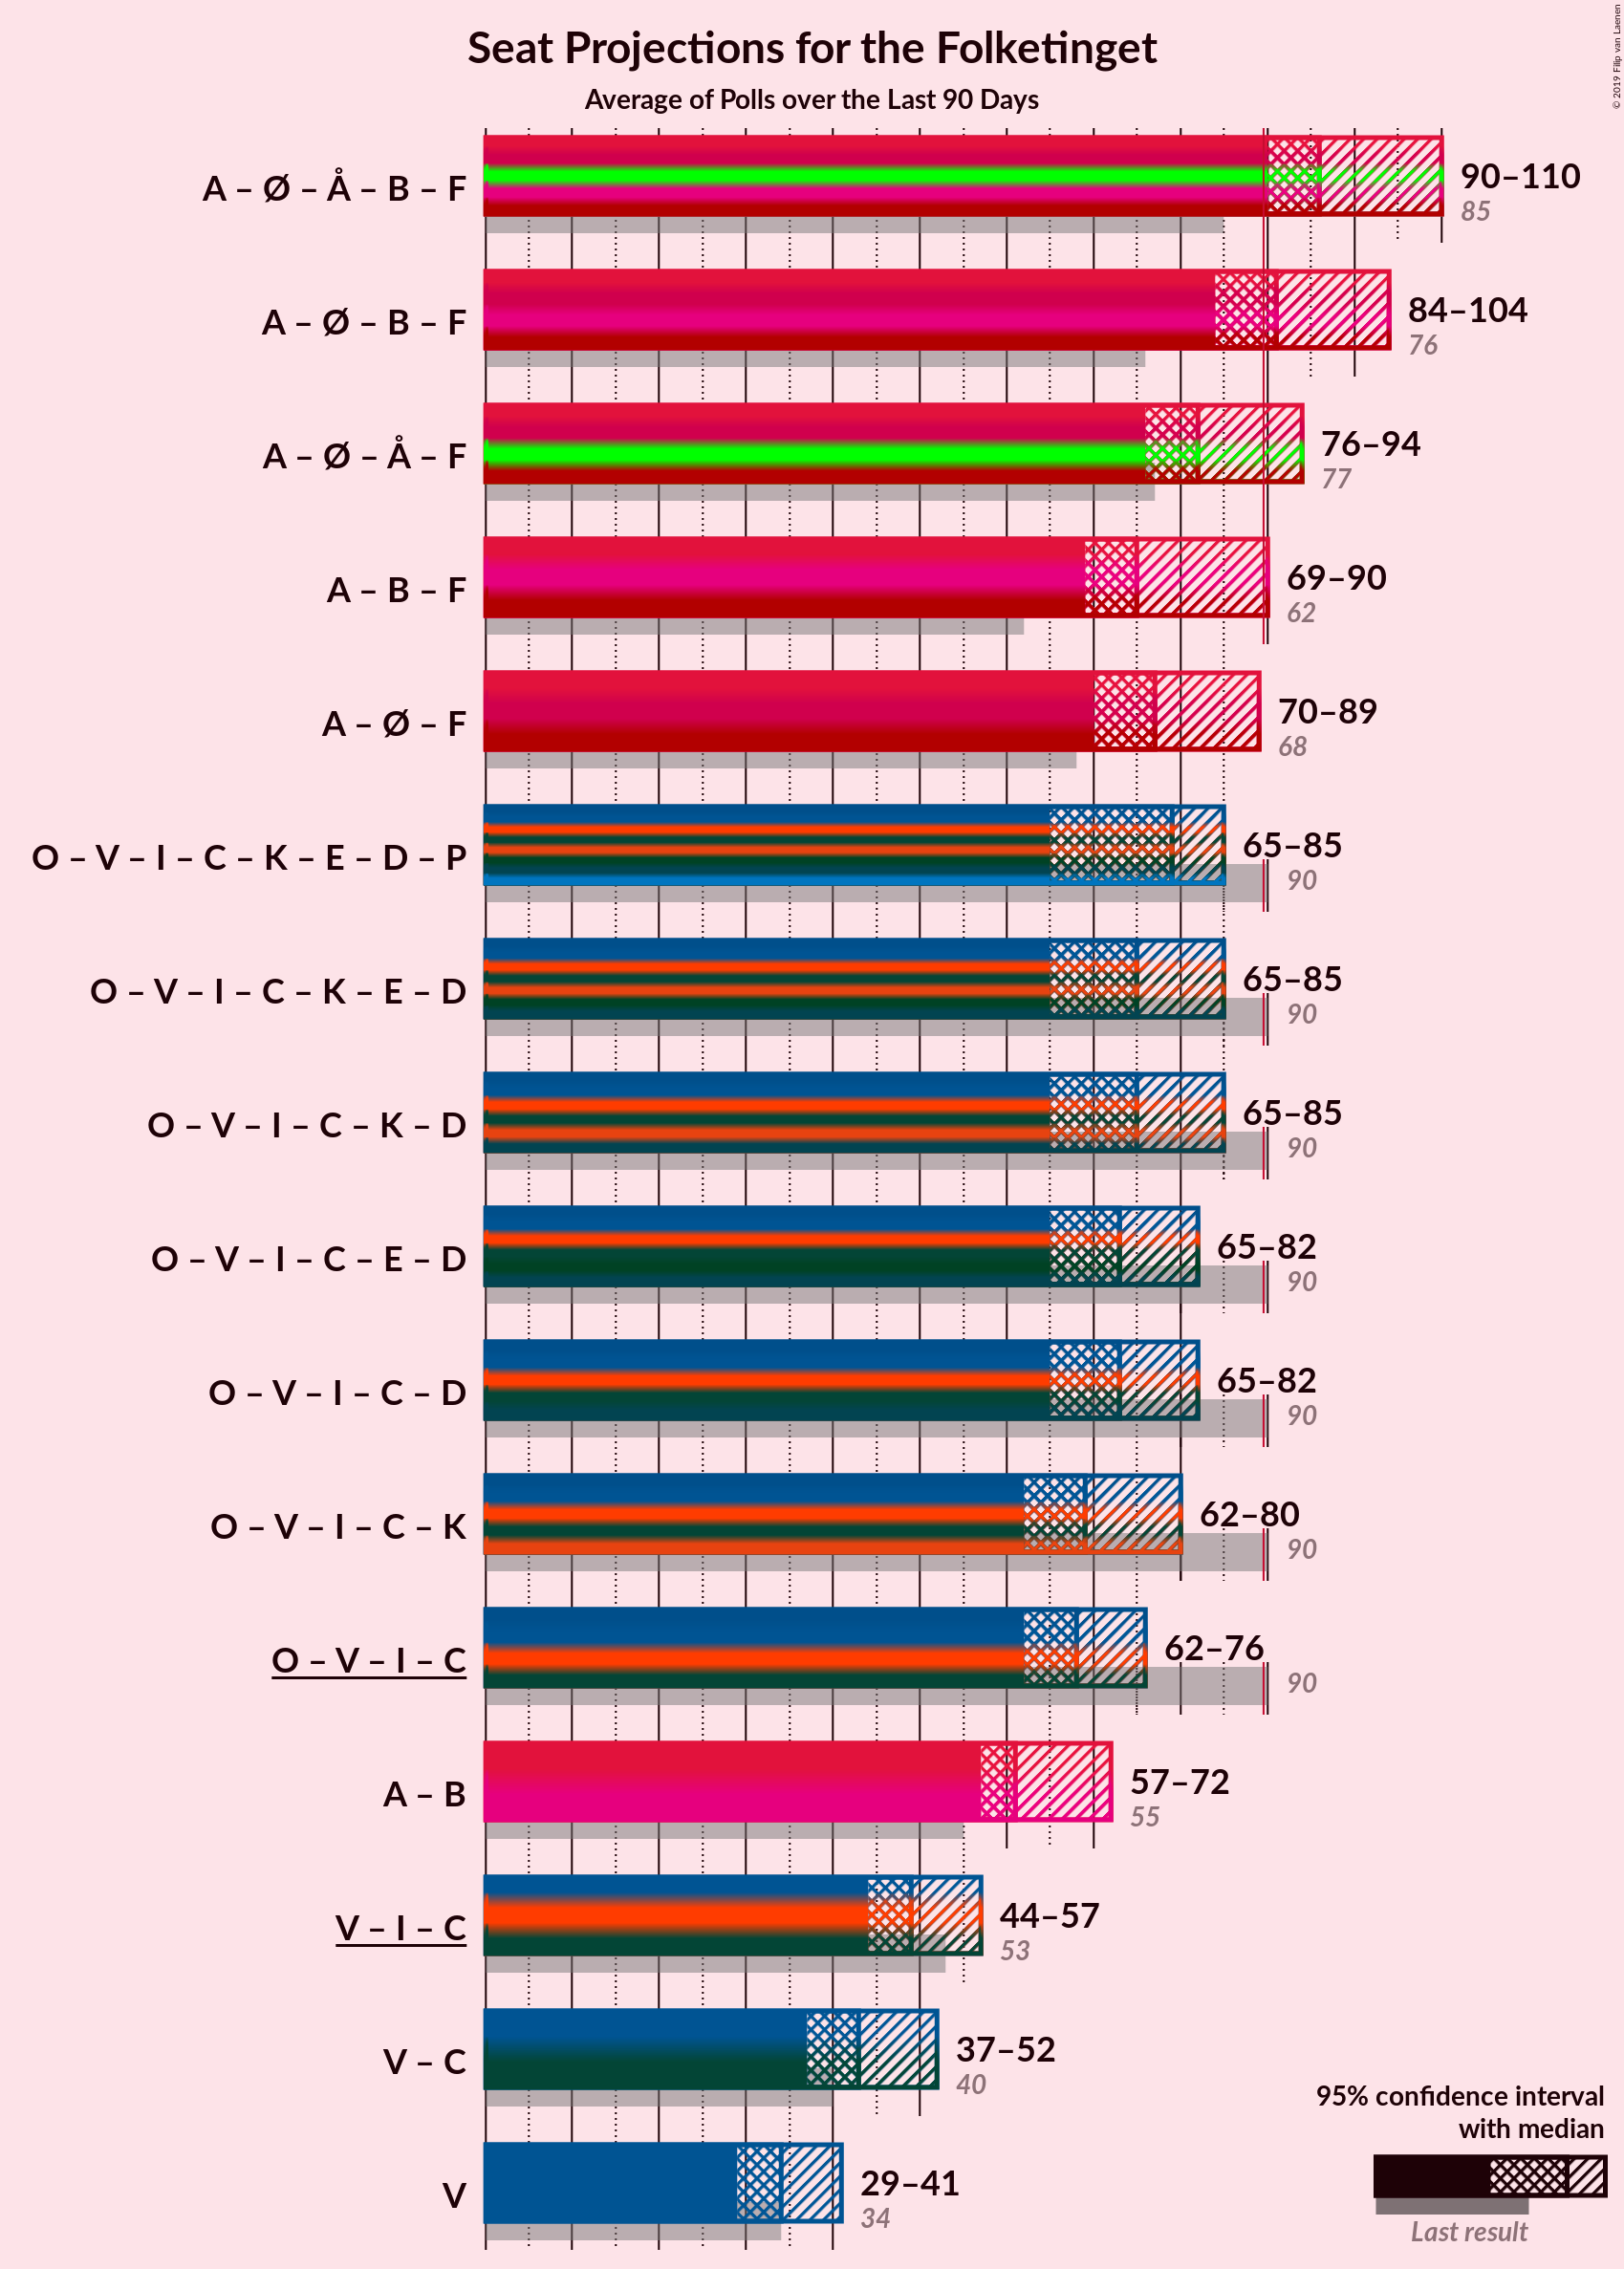
The table below lists the most recent polls (less than 90 days old) registered and analyzed so far.
| Period | Polling firm/Commissioner(s) | A | O | V | Ø | I | Å | B | F | C | K | D | E | P |
|---|---|---|---|---|---|---|---|---|---|---|---|---|---|---|
| 18 June 2015 | General Election | 26.3% 47 |
21.1% 37 |
19.5% 34 |
7.8% 14 |
7.5% 13 |
4.8% 9 |
4.6% 8 |
4.2% 7 |
3.4% 6 |
0.8% 0 |
0.0% 0 |
0.0% 0 |
0.0% 0 |
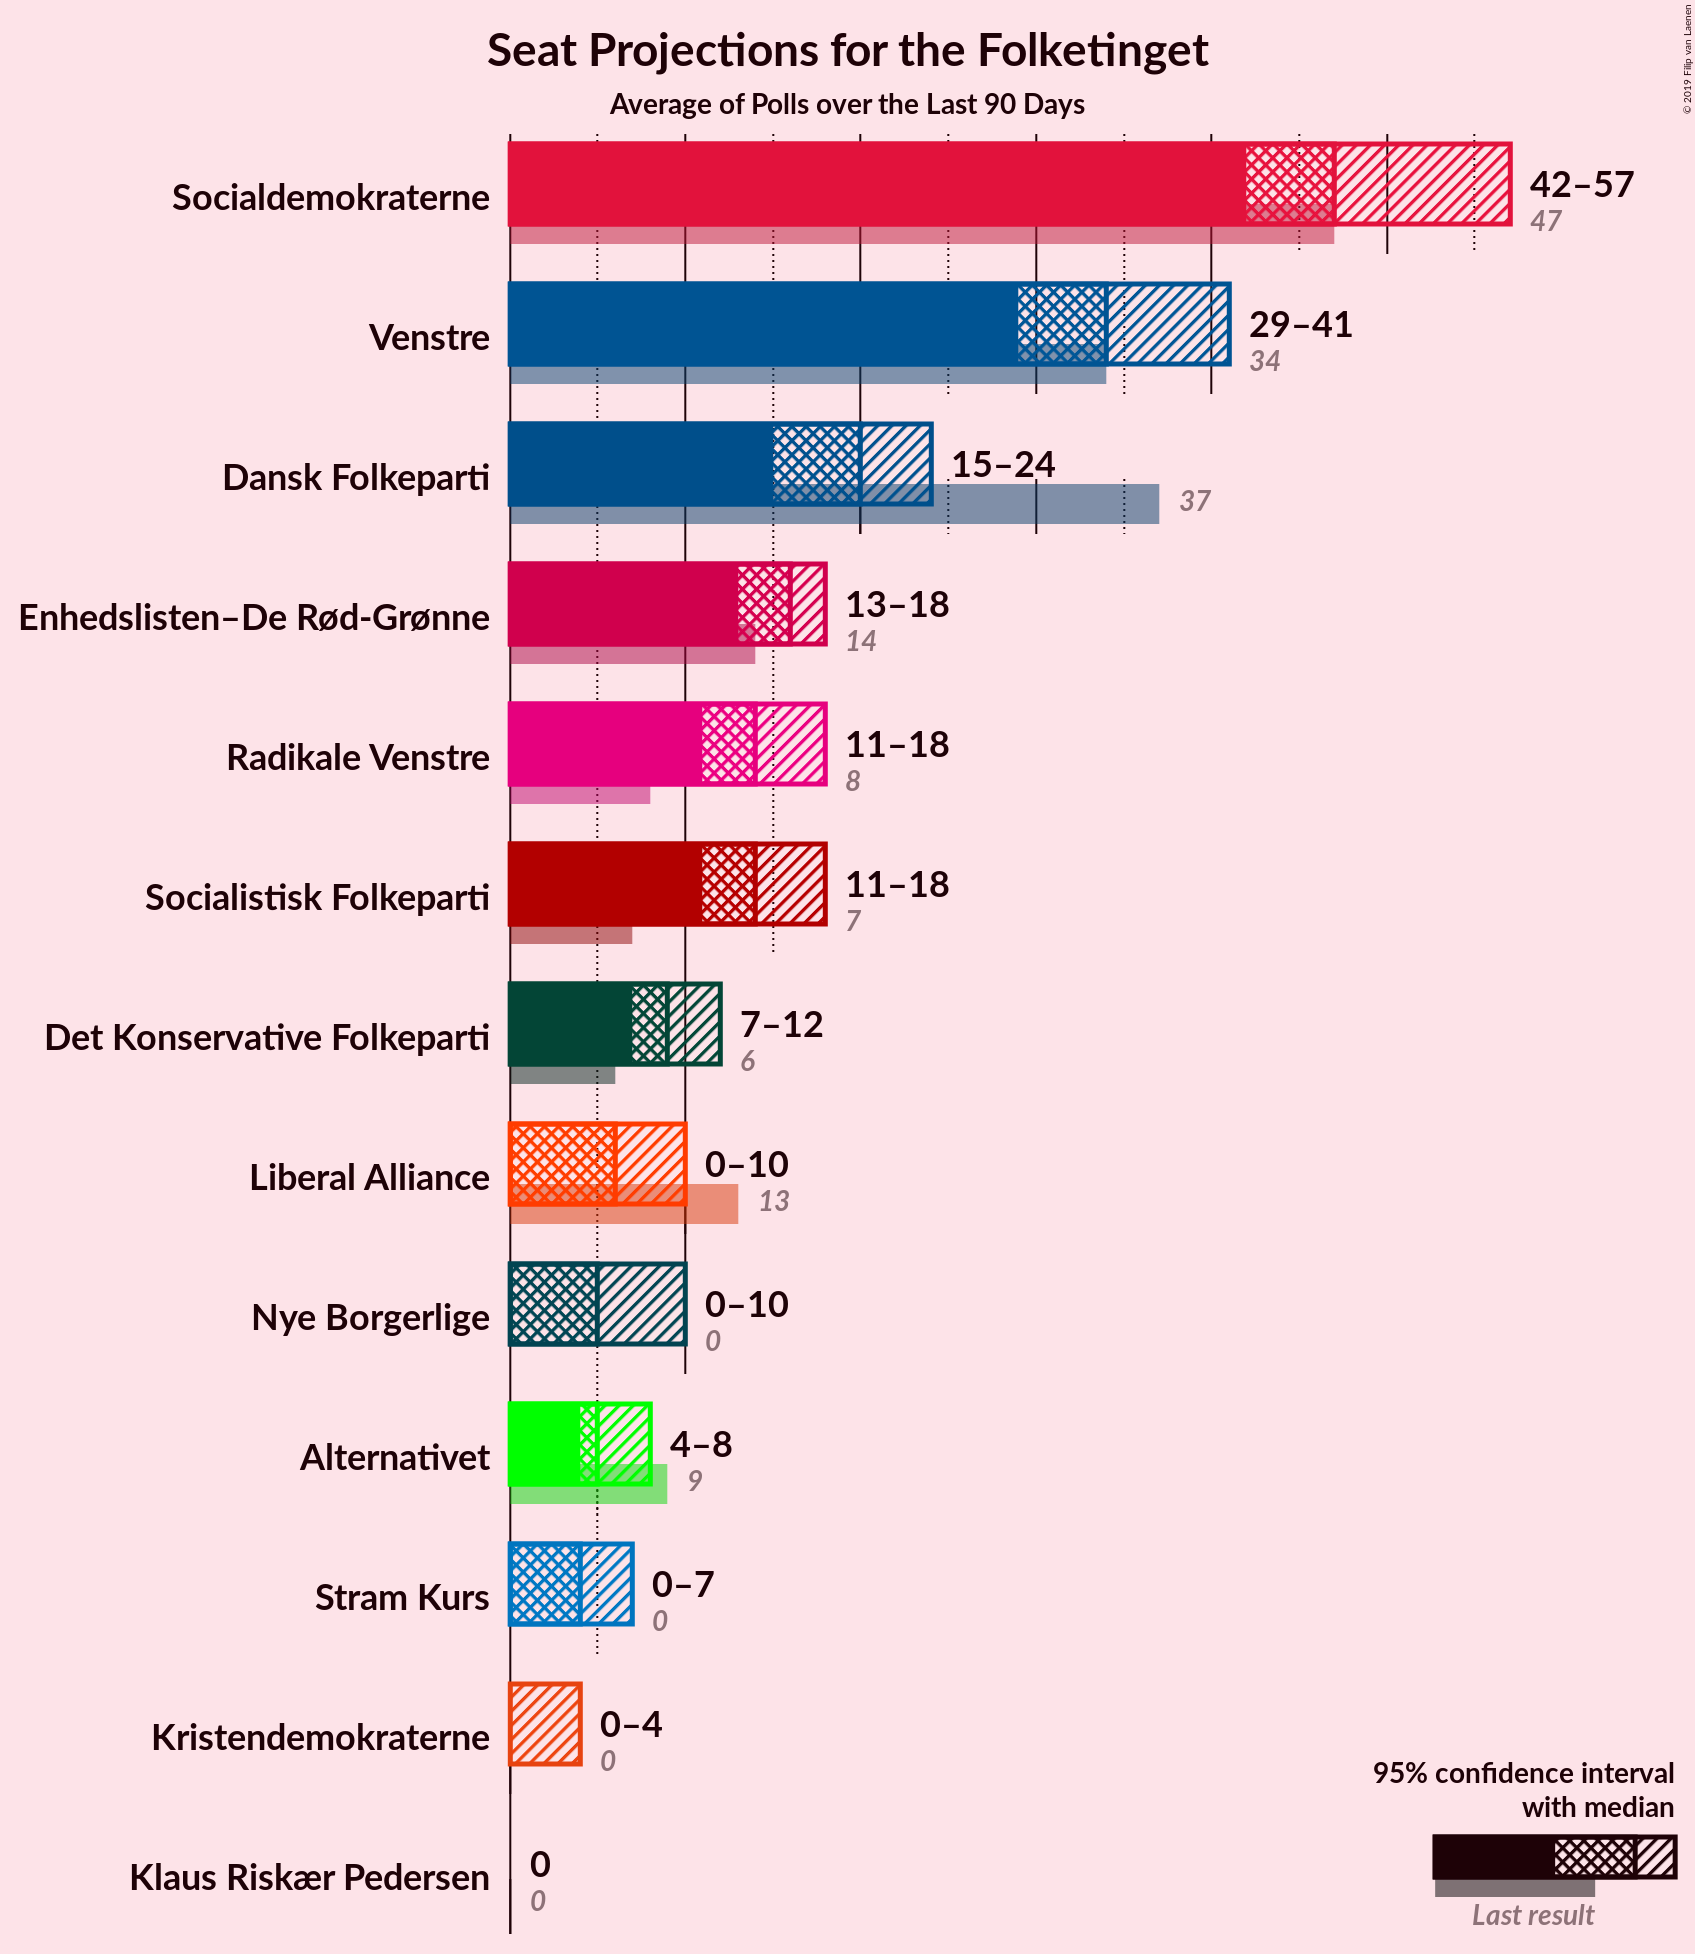
| N/A | Poll Average | 23–31% 42–57 |
9–14% 15–24 |
16–23% 29–41 |
7–10% 13–18 |
2–5% 0–10 |
2–5% 4–8 |
6–10% 11–18 |
6–10% 11–18 |
4–7% 7–12 |
1–3% 0–4 |
2–5% 0–10 |
0–1% 0 |
1–4% 0–7 |
| 31 May–4 June 2019 | YouGov | 25–30% 43–51 |
9–13% 18–23 |
16–21% 30–37 |
7–10% 12–19 |
2–4% 4–7 |
2–4% 4–6 |
6–9% 11–17 |
6–9% 10–14 |
3–6% 7–10 |
1–3% 0–4 |
4–6% 7–12 |
0–1% 0 |
2–4% 0–7 |
| 4 June 2019 | Gallup | 24–27% 44–49 |
10–12% 17–21 |
21–24% 37–42 |
7–9% 13–16 |
2–3% 4–6 |
2–3% 4–6 |
7–8% 12–15 |
7–8% 12–15 |
5–7% 10–13 |
2% 0–4 |
2–3% 4–6 |
1% 0 |
1% 0 |
| 4 June 2019 | Epinion DR |
24–27% 43–48 |
8–11% 15–19 |
19–22% 35–40 |
7–10% 13–18 |
2–3% 0–7 |
3–4% 4–8 |
8–10% 14–19 |
7–9% 13–16 |
5–7% 10–12 |
1–2% 0–4 |
2–3% 4–6 |
0–1% 0 |
1–3% 0–4 |
| 1–3 June 2019 | Voxmeter Ritzau |
27–32% 48–57 |
8–12% 16–22 |
16–21% 29–39 |
7–10% 13–19 |
2–5% 4–9 |
2–4% 4–8 |
7–11% 13–18 |
7–11% 13–19 |
3–6% 6–10 |
1–3% 0–4 |
1–3% 0–5 |
0–1% 0 |
1–2% 0–4 |
| 3 June 2019 | Norstat Altinget and Jyllands-Posten |
26–31% 46–55 |
9–12% 16–22 |
16–20% 28–36 |
7–10% 13–18 |
3–5% 4–9 |
2–4% 0–6 |
6–9% 10–17 |
6–9% 11–16 |
3–6% 6–11 |
1–3% 0–5 |
3–5% 6–10 |
0–1% 0 |
1–3% 0–6 |
| 3 June 2019 | Greens Analyseinstitut Børsen |
24–29% 44–50 |
9–12% 17–21 |
17–21% 30–36 |
7–10% 13–17 |
2–4% 4–7 |
3–5% 6–10 |
5–8% 10–14 |
7–10% 13–17 |
4–7% 8–11 |
1–3% 0–5 |
2–4% 4–7 |
0–1% 0 |
2–4% 0–6 |
| 28–30 May 2019 | Megafon Politiken and TV 2 |
23–28% 41–50 |
10–14% 20–25 |
17–22% 32–40 |
7–11% 13–19 |
2–5% 4–8 |
2–5% 5–8 |
7–10% 12–18 |
6–9% 11–15 |
4–7% 8–12 |
1–2% 0 |
1–3% 0–6 |
0–1% 0 |
1–3% 0–5 |
| 8 May 2019 | Kantar Gallup Berlingske |
22–26% 40–46 |
11–14% 19–25 |
16–20% 30–35 |
8–11% 15–19 |
3–5% 6–10 |
2–4% 4–7 |
7–10% 13–18 |
6–9% 12–15 |
4–6% 6–11 |
1–2% 0 |
2–4% 0–6 |
1–2% 0 |
3–4% 5–8 |
| 18 June 2015 | General Election | 26.3% 47 |
21.1% 37 |
19.5% 34 |
7.8% 14 |
7.5% 13 |
4.8% 9 |
4.6% 8 |
4.2% 7 |
3.4% 6 |
0.8% 0 |
0.0% 0 |
0.0% 0 |
0.0% 0 |
Only polls for which at least the sample size has been published are included in the table above.
Legend:
- Top half of each row: Voting intentions (95% confidence interval)
- Bottom half of each row: Seat projections for the Folketinget (95% confidence interval)
- A: Socialdemokraterne
- O: Dansk Folkeparti
- V: Venstre
- Ø: Enhedslisten–De Rød-Grønne
- I: Liberal Alliance
- Å: Alternativet
- B: Radikale Venstre
- F: Socialistisk Folkeparti
- C: Det Konservative Folkeparti
- K: Kristendemokraterne
- D: Nye Borgerlige
- E: Klaus Riskær Pedersen
- P: Stram Kurs
- N/A (single party): Party not included the published results
- N/A (entire row): Calculation for this opinion poll not started yet


