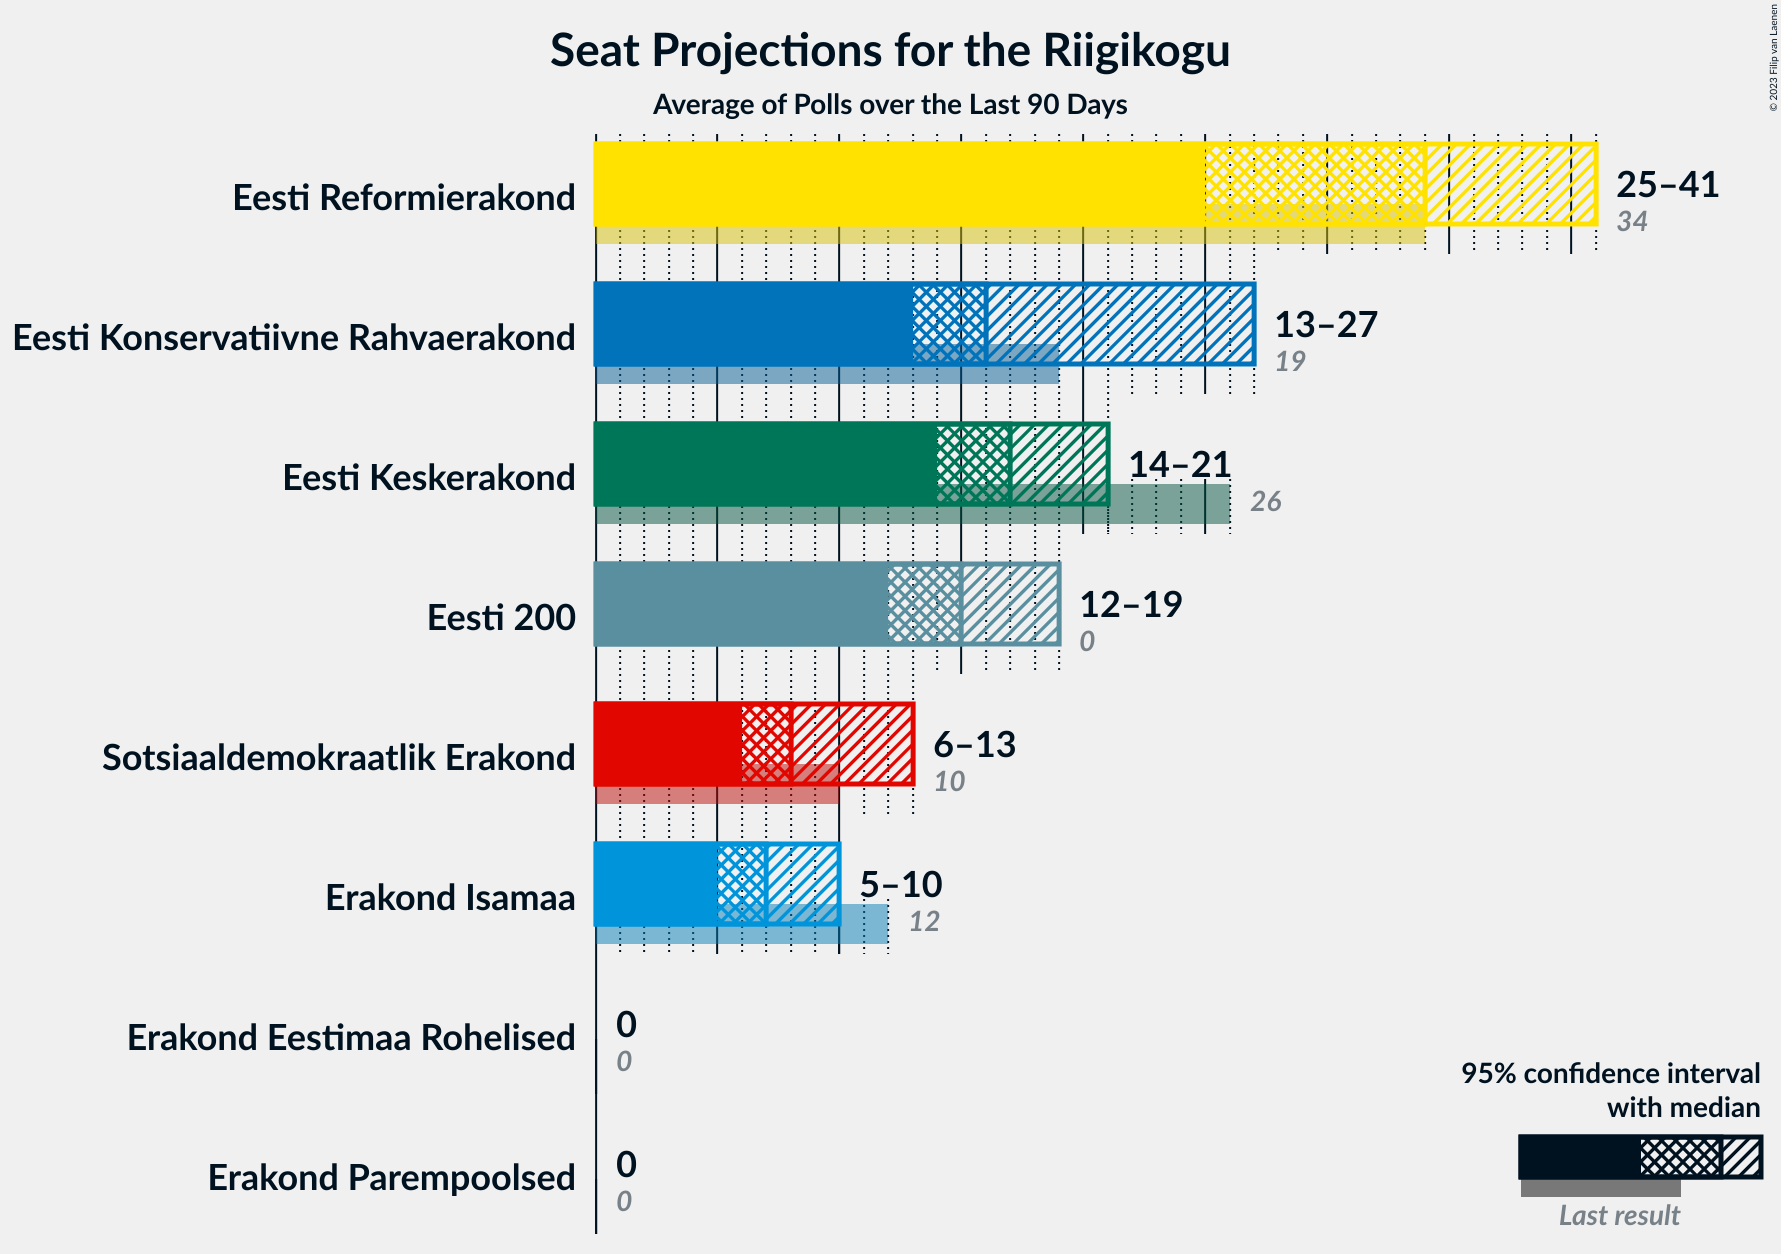
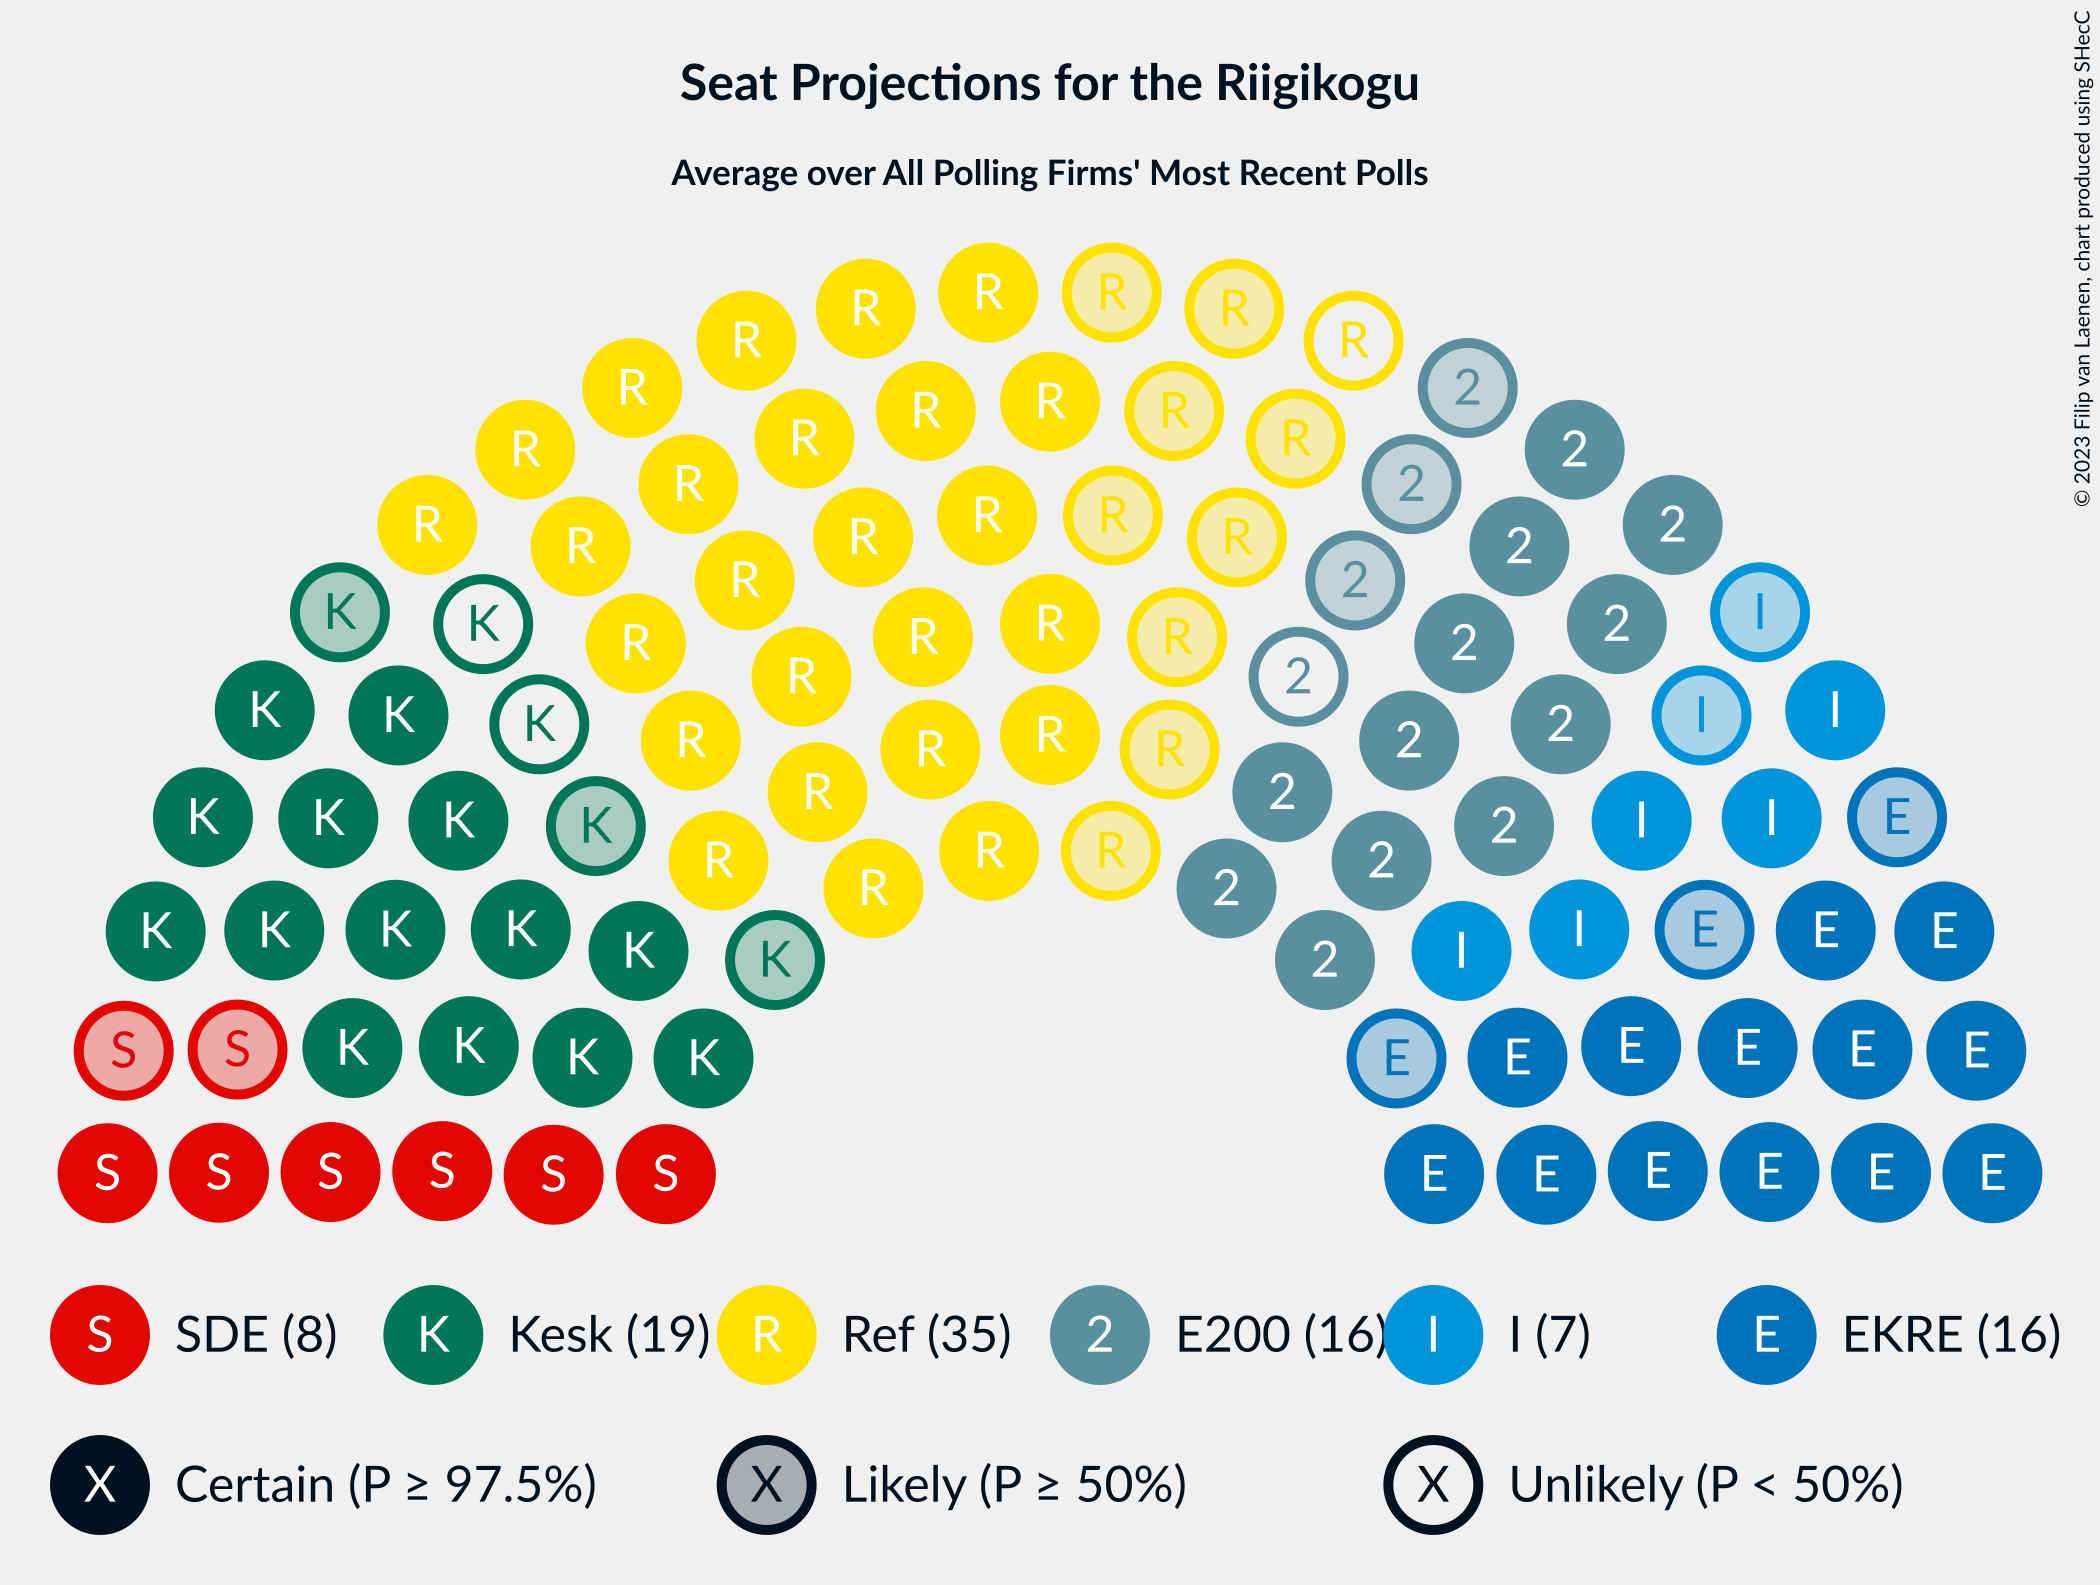
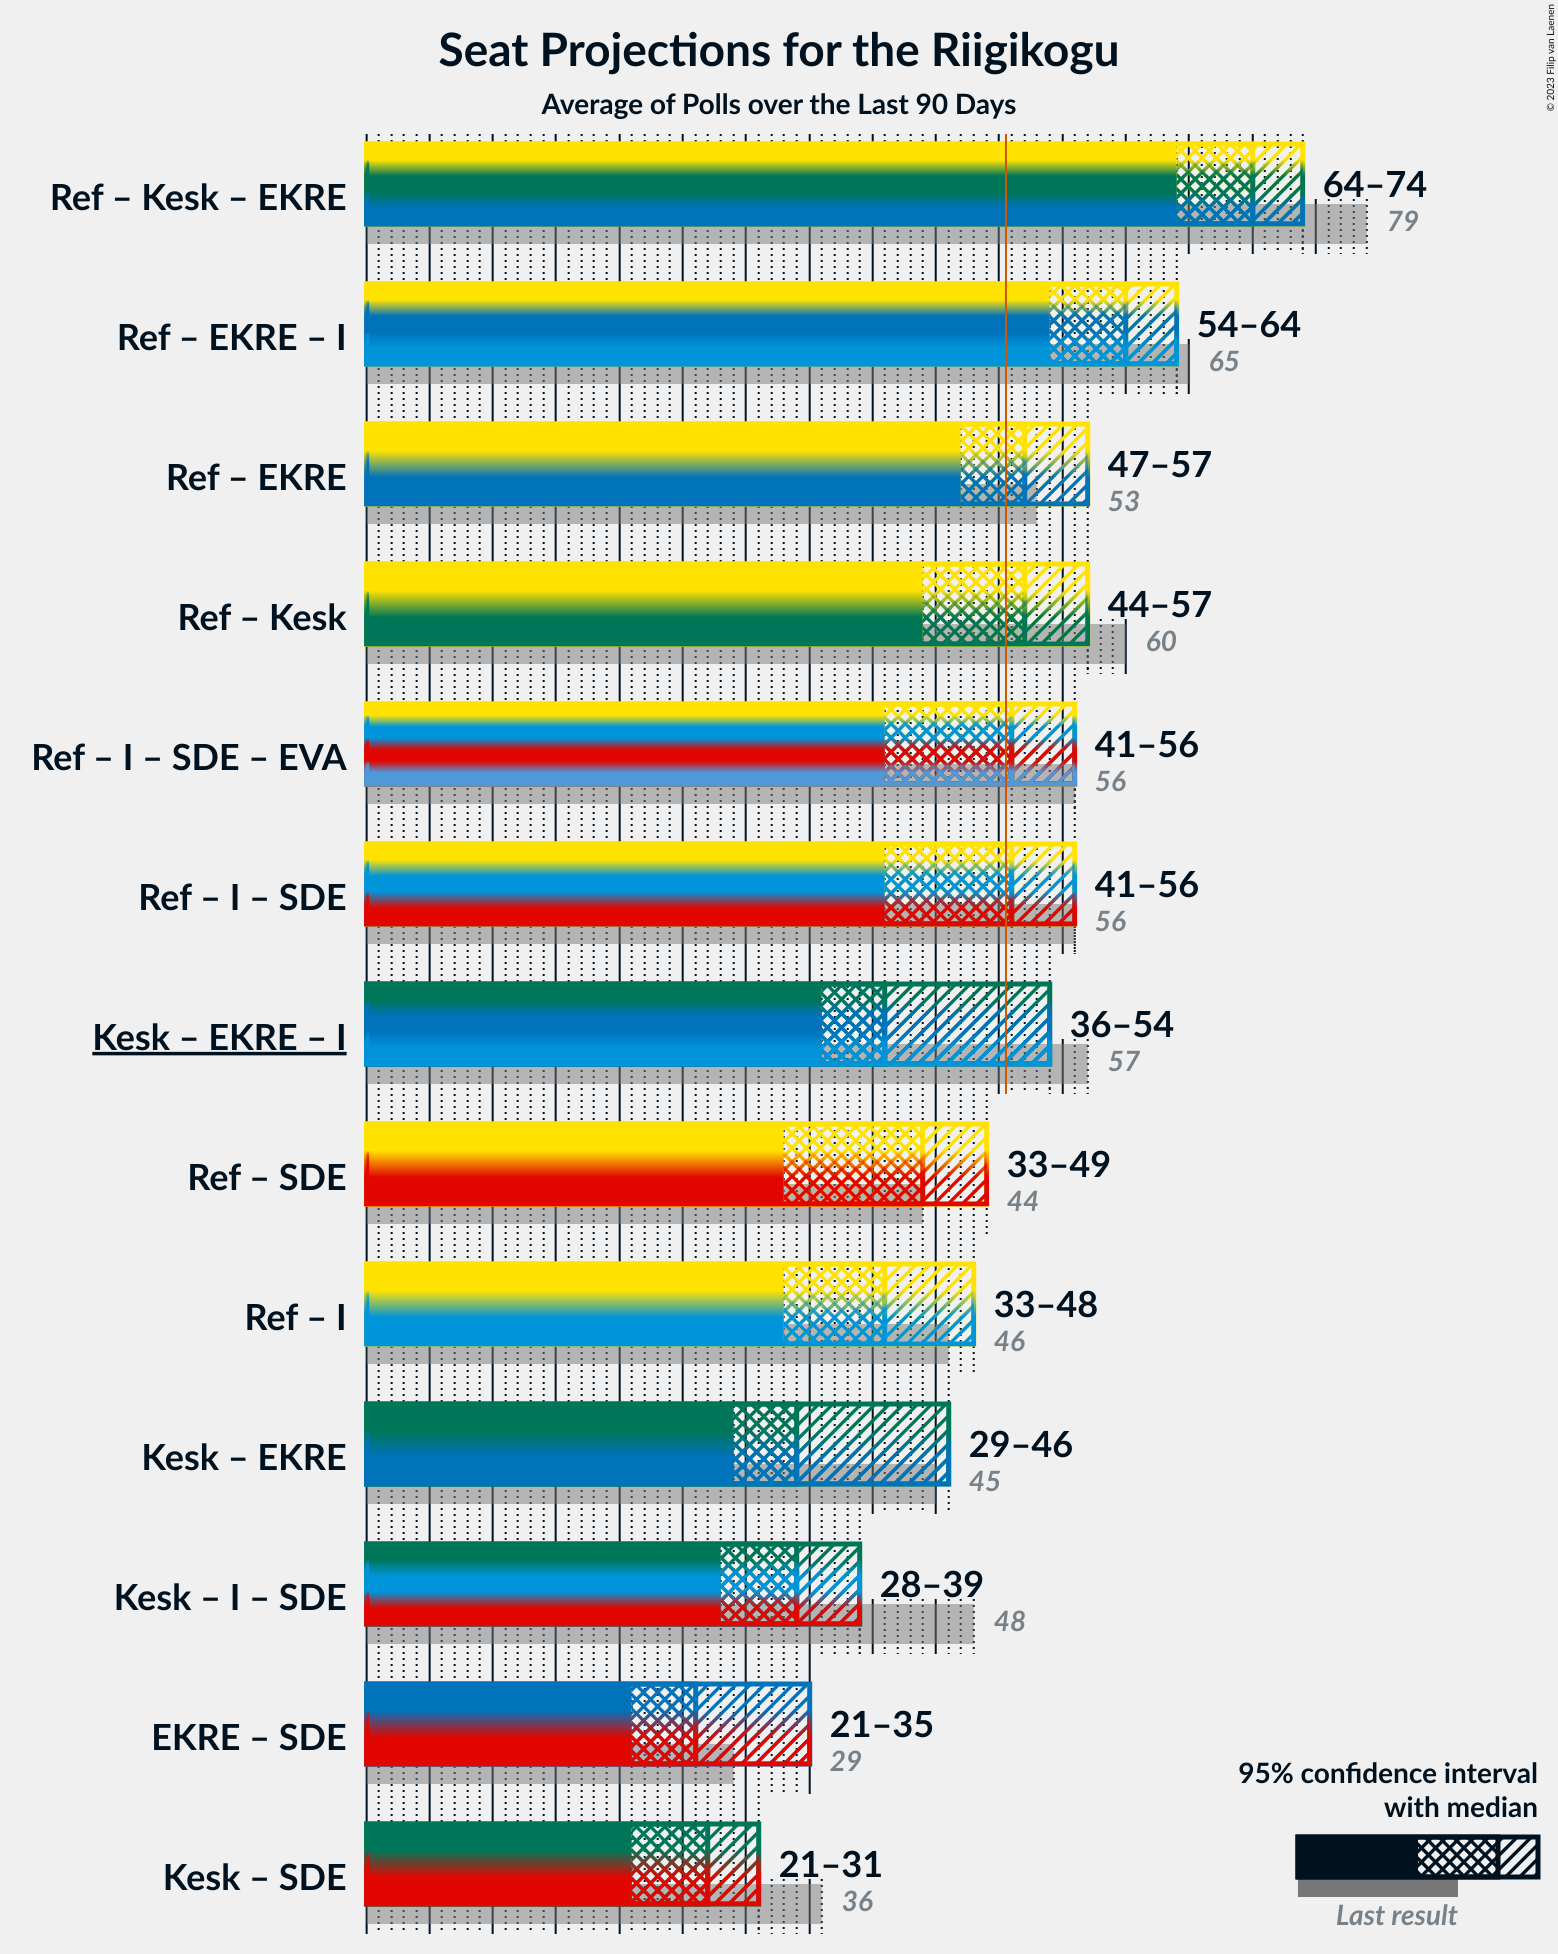
Overview
The table below lists the most recent polls (less than 90 days old) registered and analyzed so far.
| Period | Polling firm/Commissioner(s) | Ref | Kesk | EKRE | I | SDE | E200 | Rohelised | EVA | EP |
|---|---|---|---|---|---|---|---|---|---|---|
| 3 March 2019 | General Election | 28.9% 34 |
23.1% 26 |
17.8% 19 |
11.4% 12 |
9.8% 10 |
4.4% 0 |
1.8% 0 |
1.2% 0 |
0.0% 0 |
| N/A | Poll Average | 23–35% 25–41 |
14–20% 14–21 |
13–24% 13–27 |
6–10% 5–10 |
7–13% 6–13 |
12–17% 12–19 |
1–3% 0 |
N/A N/A |
1–4% 0 |
| 28 February–3 March 2023 | Norstat MTÜ Ühiskonnauuringute Instituut |
30–36% 35–42 |
13–17% 13–18 |
14–18% 14–19 |
6–9% 5–9 |
6–10% 5–9 |
13–18% 14–19 |
1–3% 0 |
N/A N/A |
2–4% 0 |
| 28 February–2 March 2023 | Kantar Emor ERR |
27–31% 31–37 |
14–18% 15–20 |
13–16% 13–17 |
6–9% 5–8 |
10–13% 10–14 |
14–17% 14–19 |
2–3% 0 |
N/A N/A |
2–3% 0 |
| 20–28 February 2023 | Turu-uuringute AS Eesti Päevaleht |
26–34% 30–40 |
14–20% 15–22 |
12–18% 13–20 |
6–10% 6–10 |
7–12% 6–12 |
11–17% 12–18 |
1–3% 0 |
N/A N/A |
2–5% 0 |
| 10–27 February 2023 | RAIT Faktum&Ariko | 22–27% 24–31 |
15–20% 16–22 |
20–25% 22–28 |
7–10% 6–10 |
7–10% 6–10 |
11–16% 11–16 |
1–3% 0 |
N/A N/A |
1–2% 0 |
| 3 March 2019 | General Election | 28.9% 34 |
23.1% 26 |
17.8% 19 |
11.4% 12 |
9.8% 10 |
4.4% 0 |
1.8% 0 |
1.2% 0 |
0.0% 0 |
Only polls for which at least the sample size has been published are included in the table above.
Legend:
- Top half of each row: Voting intentions (95% confidence interval)
- Bottom half of each row: Seat projections for the Riigikogu (95% confidence interval)
- Ref: Eesti Reformierakond
- Kesk: Eesti Keskerakond
- EKRE: Eesti Konservatiivne Rahvaerakond
- I: Erakond Isamaa
- SDE: Sotsiaaldemokraatlik Erakond
- E200: Eesti 200
- Rohelised: Erakond Eestimaa Rohelised
- EVA: Eesti Vabaerakond
- EP: Erakond Parempoolsed
- N/A (single party): Party not included the published results
- N/A (entire row): Calculation for this opinion poll not started yet


