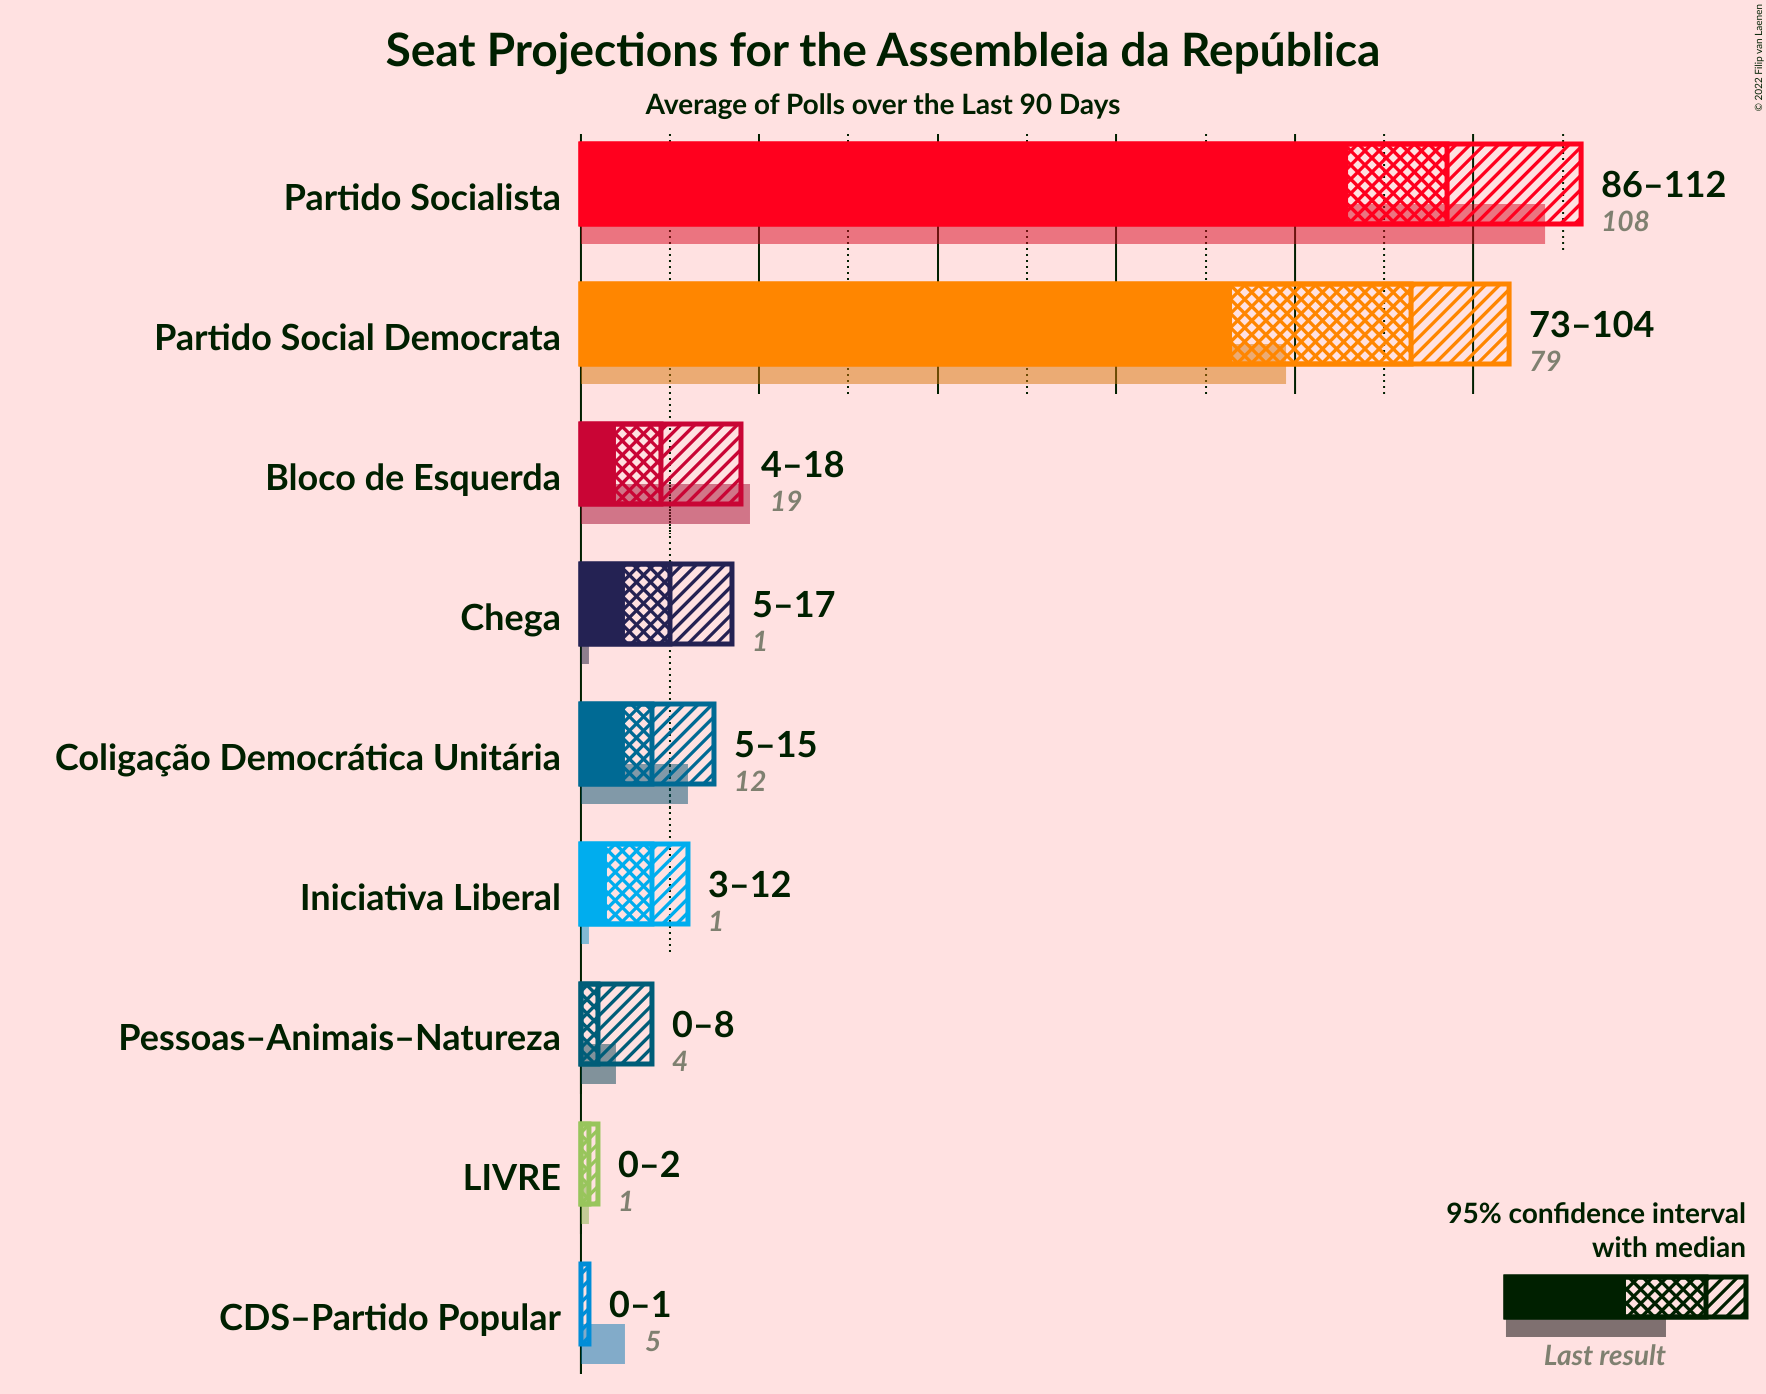
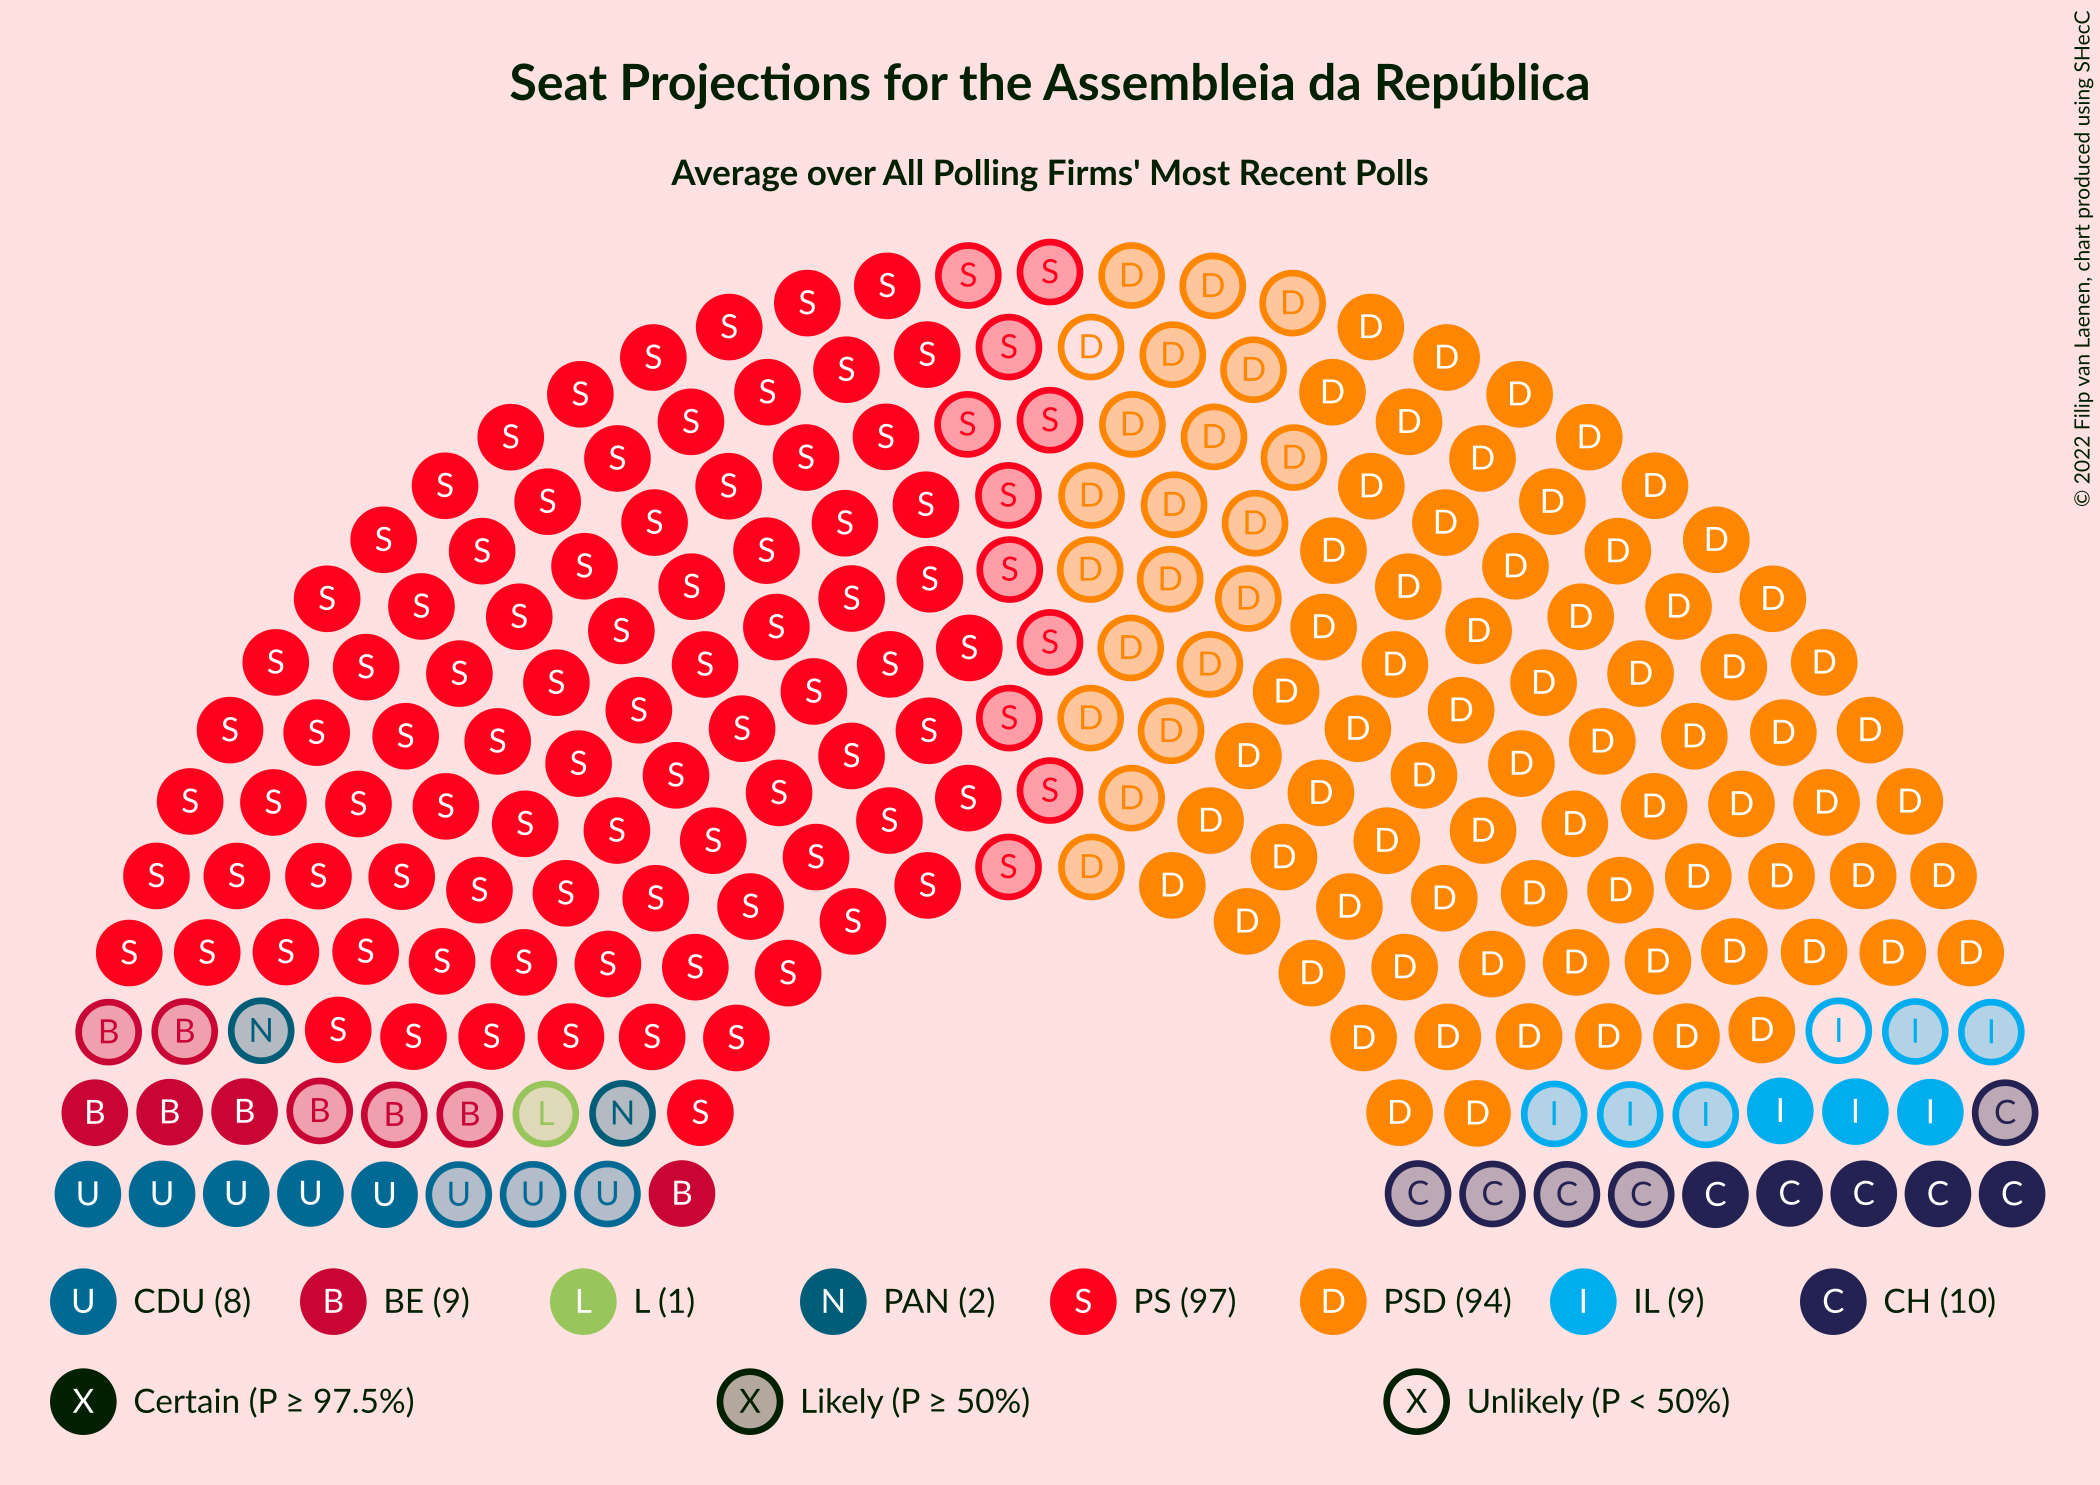
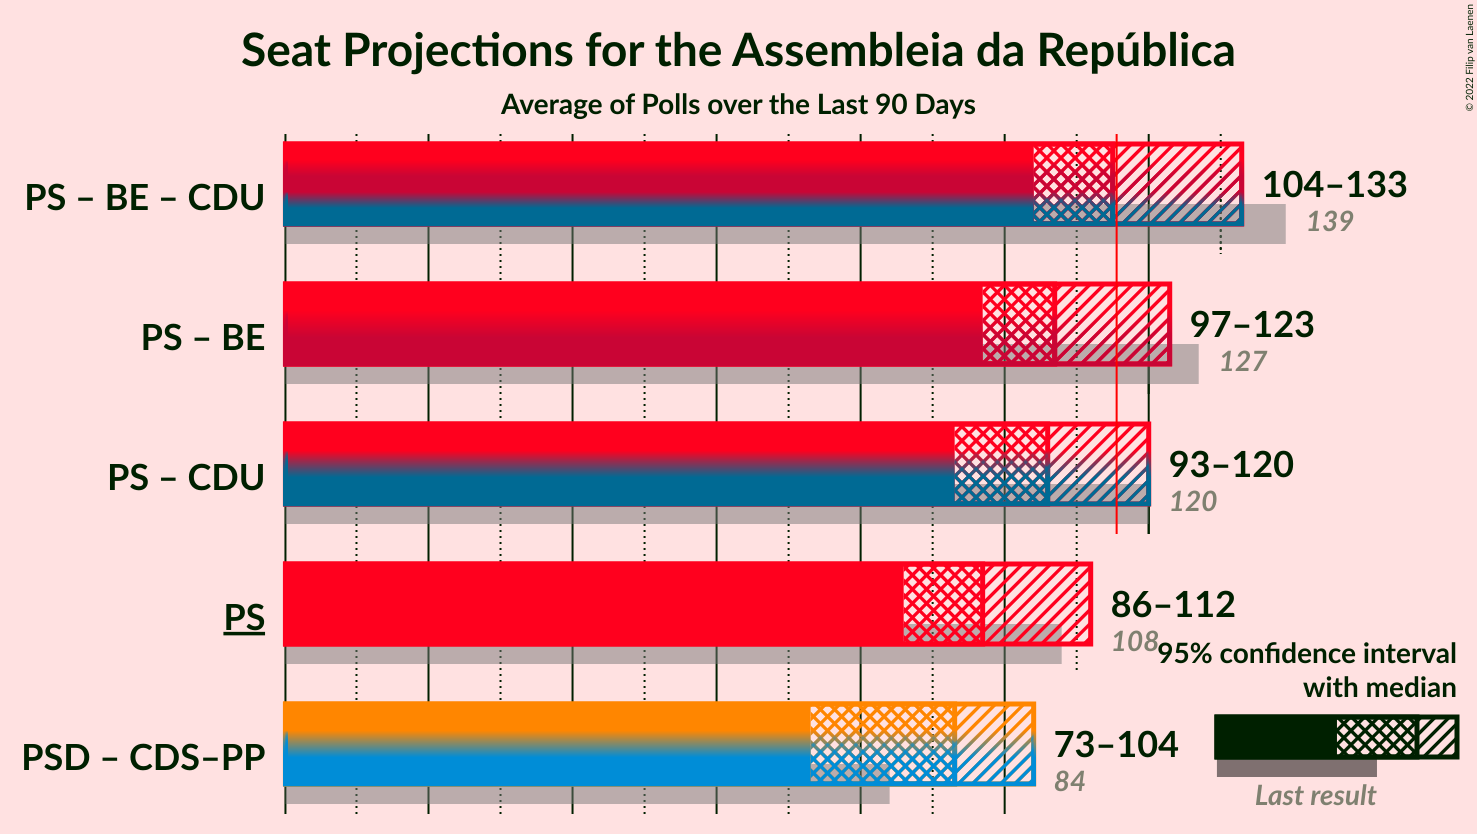
Overview
The table below lists the most recent polls (less than 90 days old) registered and analyzed so far.
| Period | Polling firm/Commissioner(s) | PS | PSD | BE | CDU | CDS–PP | PAN | CH | IL | L | A |
|---|---|---|---|---|---|---|---|---|---|---|---|
| 6 October 2019 | General Election | 36.4% 108 |
27.8% 79 |
9.5% 19 |
6.3% 12 |
4.2% 5 |
3.3% 4 |
1.3% 1 |
1.3% 1 |
1.1% 1 |
0.8% 0 |
| N/A | Poll Average | 32–39% 86–112 |
27–36% 73–104 |
4–10% 4–18 |
4–8% 5–15 |
1–2% 0–1 |
1–5% 0–8 |
4–9% 5–17 |
2–7% 3–12 |
0–3% 0–2 |
N/A N/A |
| 24–28 January 2022 | Pitagórica CNN Portugal and TVI |
33–40% 92–115 |
30–36% 83–103 |
4–7% 4–13 |
4–7% 5–13 |
1–3% 0–1 |
1–2% 0–2 |
4–7% 4–11 |
4–7% 5–12 |
1–3% 1–3 |
N/A N/A |
| 19–26 January 2022 | CESOP–UCP Público and RTP |
34–38% 92–107 |
31–35% 85–99 |
5–7% 7–14 |
4–6% 5–9 |
1–3% 0–2 |
1–3% 1–2 |
5–7% 7–11 |
5–7% 6–12 |
1–3% 1–2 |
N/A N/A |
| 18–24 January 2022 | ICS/ISCTE Expresso and SIC Notícias |
32–38% 88–108 |
30–36% 84–103 |
4–7% 4–11 |
5–8% 6–15 |
1–2% 0 |
1–3% 0–3 |
5–8% 5–12 |
5–8% 6–14 |
1–2% 0–1 |
N/A N/A |
| 16–21 January 2022 | Aximage Diário de Notícias, Jornal de Notícias and TSF Rádio Notícias |
31–37% 85–104 |
31–37% 88–106 |
5–8% 7–16 |
3–6% 4–10 |
1–3% 0–1 |
2–5% 2–6 |
6–10% 11–18 |
2–4% 2–5 |
1–2% 0–2 |
N/A N/A |
| 4–10 January 2022 | Intercampus CMTV, Correio da Manhã and Negócios |
32–39% 85–110 |
26–33% 68–93 |
7–11% 11–21 |
4–8% 6–16 |
1–2% 0–1 |
3–6% 2–10 |
5–9% 8–17 |
4–8% 5–13 |
0–2% 0–1 |
N/A N/A |
| 6 October 2019 | General Election | 36.4% 108 |
27.8% 79 |
9.5% 19 |
6.3% 12 |
4.2% 5 |
3.3% 4 |
1.3% 1 |
1.3% 1 |
1.1% 1 |
0.8% 0 |
Only polls for which at least the sample size has been published are included in the table above.
Legend:
- Top half of each row: Voting intentions (95% confidence interval)
- Bottom half of each row: Seat projections for the Assembleia da República (95% confidence interval)
- PS: Partido Socialista
- PSD: Partido Social Democrata
- BE: Bloco de Esquerda
- CDU: Coligação Democrática Unitária
- CDS–PP: CDS–Partido Popular
- PAN: Pessoas–Animais–Natureza
- CH: Chega
- IL: Iniciativa Liberal
- L: LIVRE
- A: Aliança
- N/A (single party): Party not included the published results
- N/A (entire row): Calculation for this opinion poll not started yet


