Opinion Poll by Dedicated for La Libre Belgique–RTBf, 3–7 December 2015
Voting Intentions | Seats | Coalitions | Technical Information
Voting Intentions
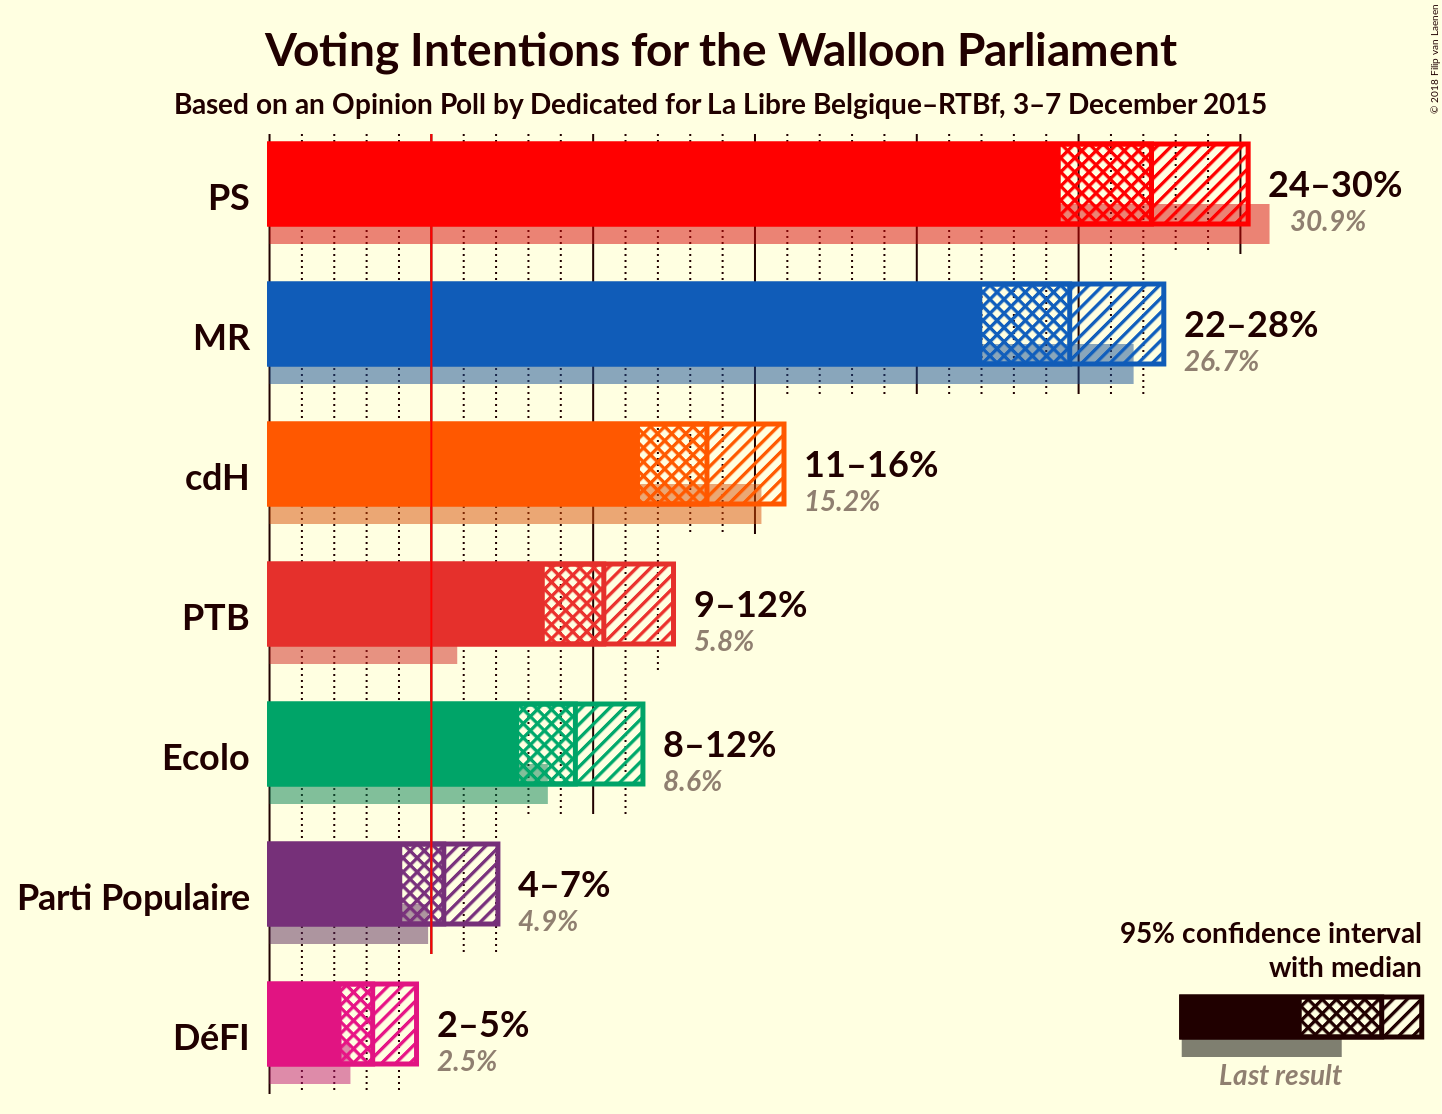
Confidence Intervals
| Party | Last Result | Poll Result | 80% Confidence Interval | 90% Confidence Interval | 95% Confidence Interval | 99% Confidence Interval |
|---|---|---|---|---|---|---|
| PS | 30.9% | 27.3% | 25.4–29.2% | 24.9–29.8% | 24.4–30.2% | 23.6–31.2% |
| MR | 26.7% | 24.7% | 23.0–26.6% | 22.5–27.2% | 22.0–27.6% | 21.2–28.6% |
| cdH | 15.2% | 13.5% | 12.1–15.1% | 11.8–15.5% | 11.4–15.9% | 10.8–16.7% |
| PTB | 5.8% | 10.3% | 9.1–11.7% | 8.8–12.1% | 8.5–12.5% | 8.0–13.2% |
| Ecolo | 8.6% | 9.5% | 8.3–10.8% | 8.0–11.2% | 7.7–11.5% | 7.2–12.2% |
| Parti Populaire | 4.9% | 5.4% | 4.5–6.5% | 4.3–6.8% | 4.1–7.1% | 3.7–7.6% |
| DéFI | 2.5% | 3.2% | 2.5–4.1% | 2.4–4.3% | 2.2–4.5% | 2.0–5.0% |
Note: The poll result column reflects the actual value used in the calculations. Published results may vary slightly, and in addition be rounded to fewer digits.
Seats
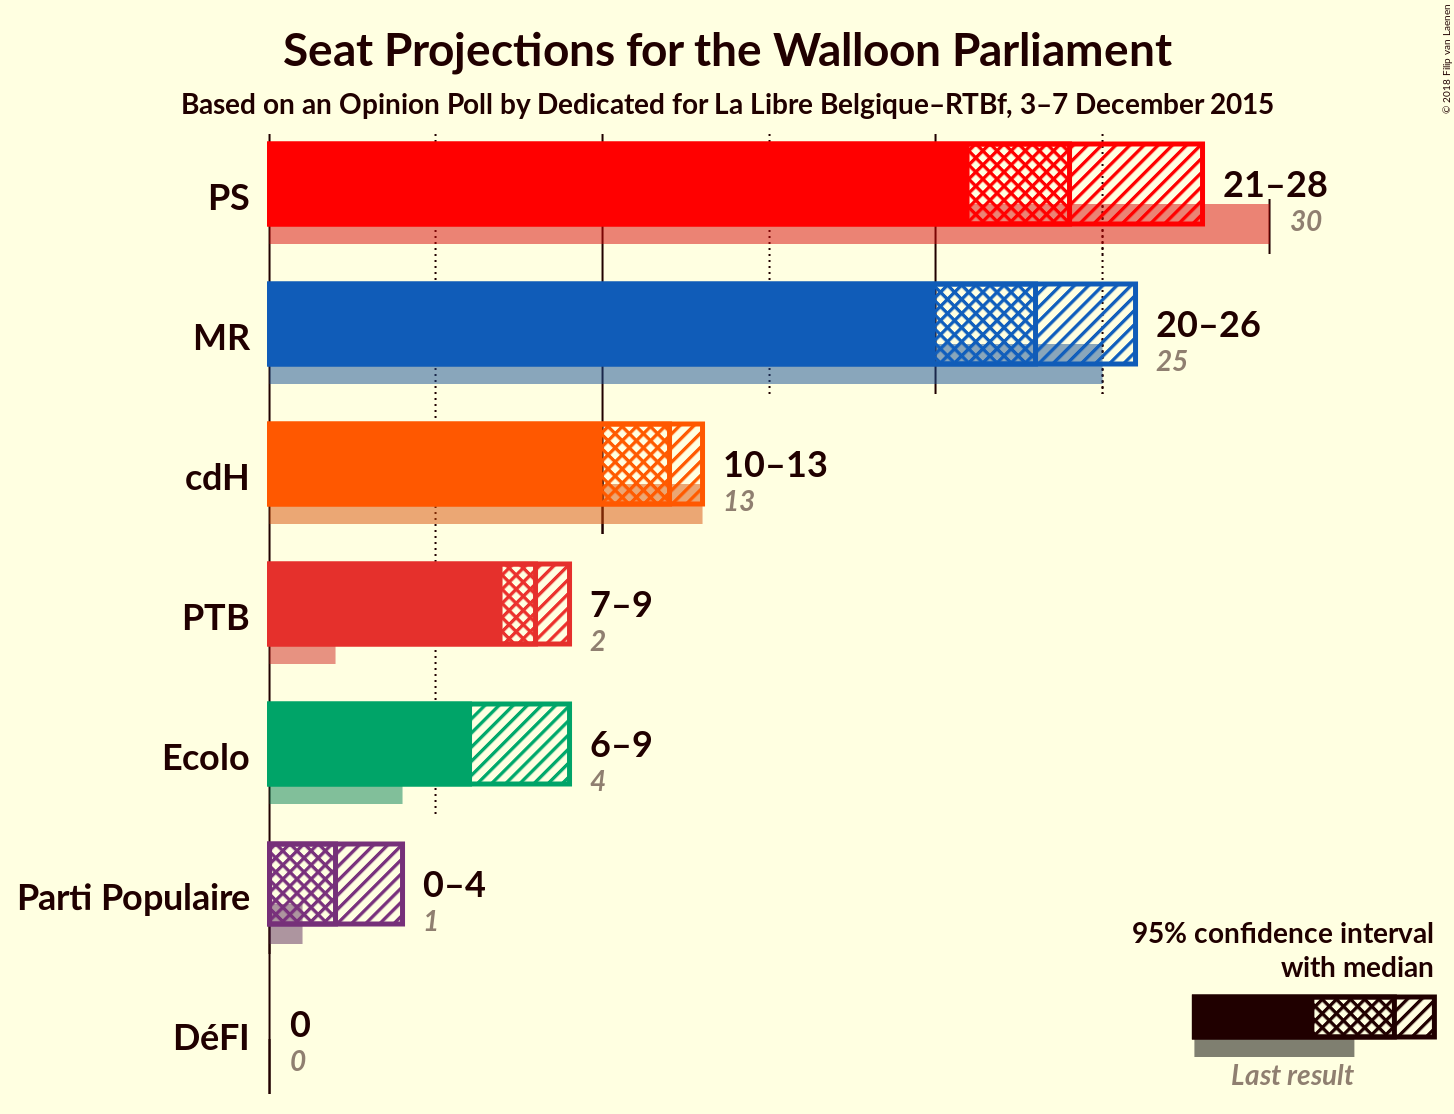
Confidence Intervals
| Party | Last Result | Median | 80% Confidence Interval | 90% Confidence Interval | 95% Confidence Interval | 99% Confidence Interval |
|---|---|---|---|---|---|---|
| PS | 30 | 24 | 22–27 | 22–27 | 21–28 | 21–29 |
| MR | 25 | 23 | 21–25 | 20–25 | 20–26 | 19–26 |
| cdH | 13 | 12 | 10–13 | 10–13 | 10–13 | 9–14 |
| PTB | 2 | 8 | 7–9 | 7–9 | 7–9 | 6–10 |
| Ecolo | 4 | 6 | 6–7 | 6–8 | 6–9 | 5–10 |
| Parti Populaire | 1 | 2 | 1–4 | 0–4 | 0–4 | 0–5 |
| DéFI | 0 | 0 | 0 | 0 | 0 | 0–1 |
PS
For a full overview of the results for this party, see the PS page.
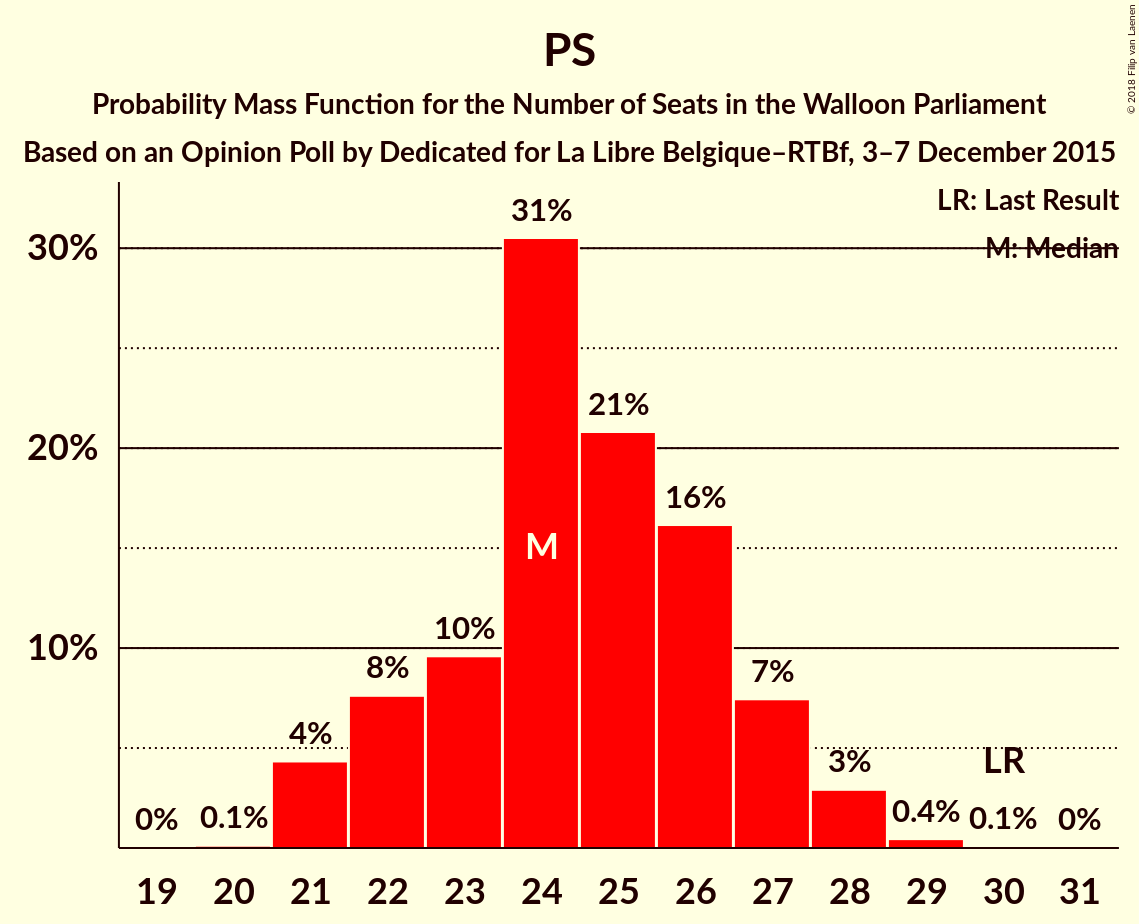
| Number of Seats | Probability | Accumulated | Special Marks |
|---|---|---|---|
| 20 | 0.1% | 100% | |
| 21 | 4% | 99.9% | |
| 22 | 8% | 96% | |
| 23 | 10% | 88% | |
| 24 | 31% | 78% | Median |
| 25 | 21% | 48% | |
| 26 | 16% | 27% | |
| 27 | 7% | 11% | |
| 28 | 3% | 3% | |
| 29 | 0.4% | 0.5% | |
| 30 | 0.1% | 0.1% | Last Result |
| 31 | 0% | 0% |
MR
For a full overview of the results for this party, see the MR page.
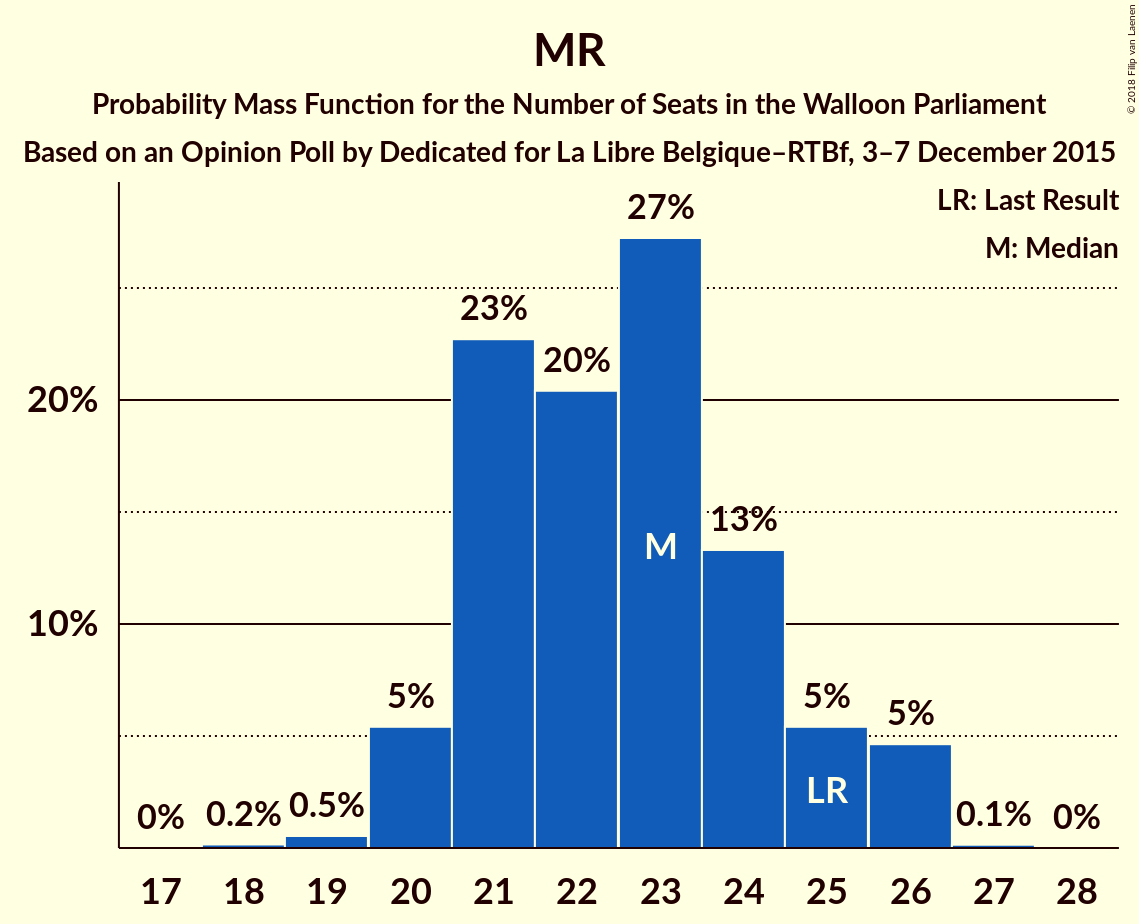
| Number of Seats | Probability | Accumulated | Special Marks |
|---|---|---|---|
| 18 | 0.2% | 100% | |
| 19 | 0.5% | 99.8% | |
| 20 | 5% | 99.3% | |
| 21 | 23% | 94% | |
| 22 | 20% | 71% | |
| 23 | 27% | 51% | Median |
| 24 | 13% | 24% | |
| 25 | 5% | 10% | Last Result |
| 26 | 5% | 5% | |
| 27 | 0.1% | 0.2% | |
| 28 | 0% | 0% |
cdH
For a full overview of the results for this party, see the cdH page.
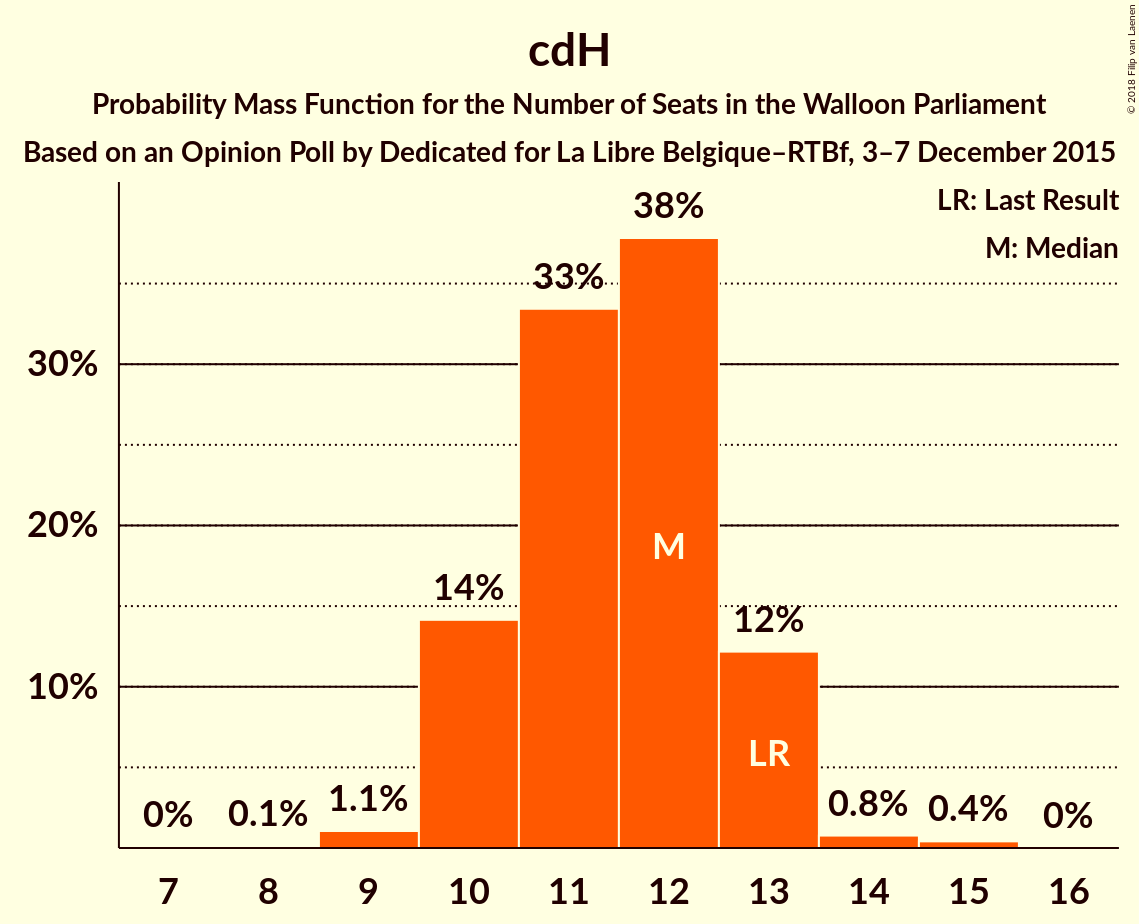
| Number of Seats | Probability | Accumulated | Special Marks |
|---|---|---|---|
| 8 | 0.1% | 100% | |
| 9 | 1.1% | 99.8% | |
| 10 | 14% | 98.8% | |
| 11 | 33% | 85% | |
| 12 | 38% | 51% | Median |
| 13 | 12% | 13% | Last Result |
| 14 | 0.8% | 1.2% | |
| 15 | 0.4% | 0.4% | |
| 16 | 0% | 0% |
PTB
For a full overview of the results for this party, see the PTB page.
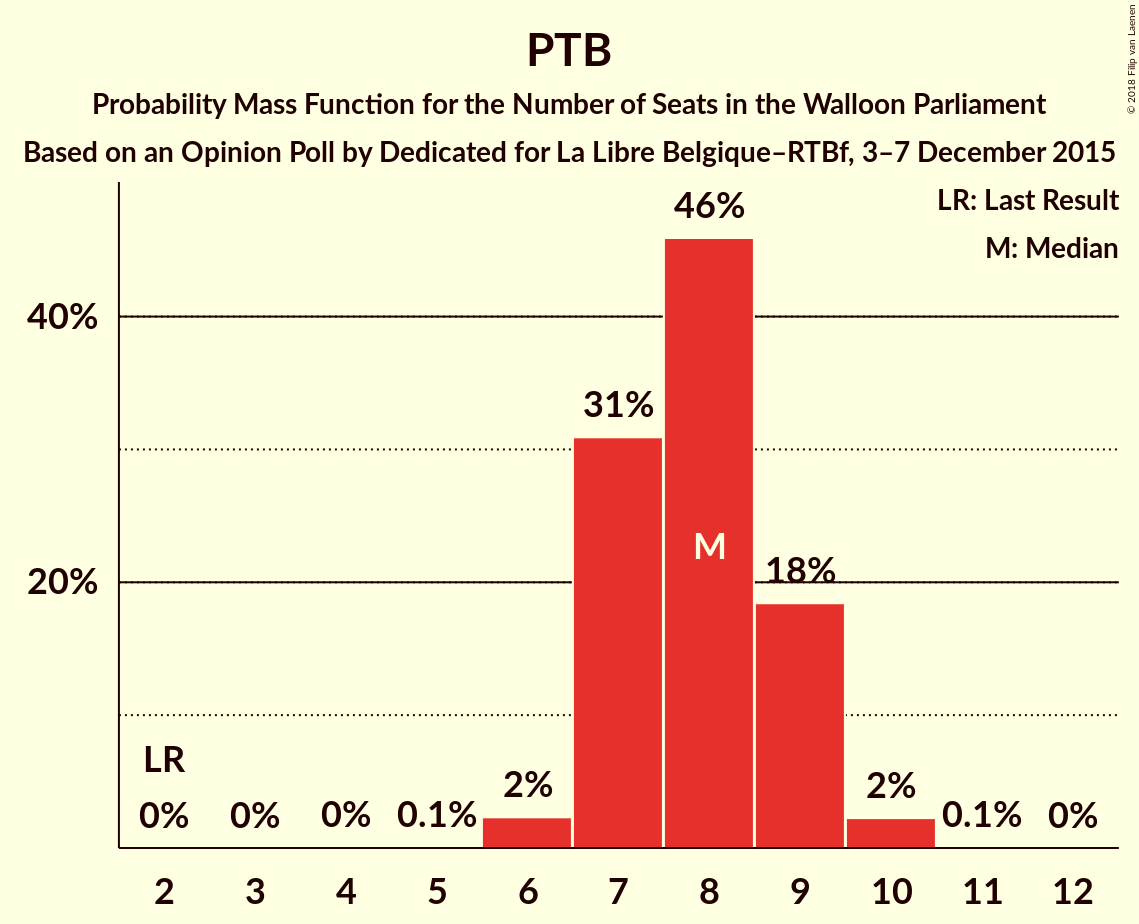
| Number of Seats | Probability | Accumulated | Special Marks |
|---|---|---|---|
| 2 | 0% | 100% | Last Result |
| 3 | 0% | 100% | |
| 4 | 0% | 100% | |
| 5 | 0.1% | 100% | |
| 6 | 2% | 99.9% | |
| 7 | 31% | 98% | |
| 8 | 46% | 67% | Median |
| 9 | 18% | 21% | |
| 10 | 2% | 2% | |
| 11 | 0.1% | 0.1% | |
| 12 | 0% | 0% |
Ecolo
For a full overview of the results for this party, see the Ecolo page.
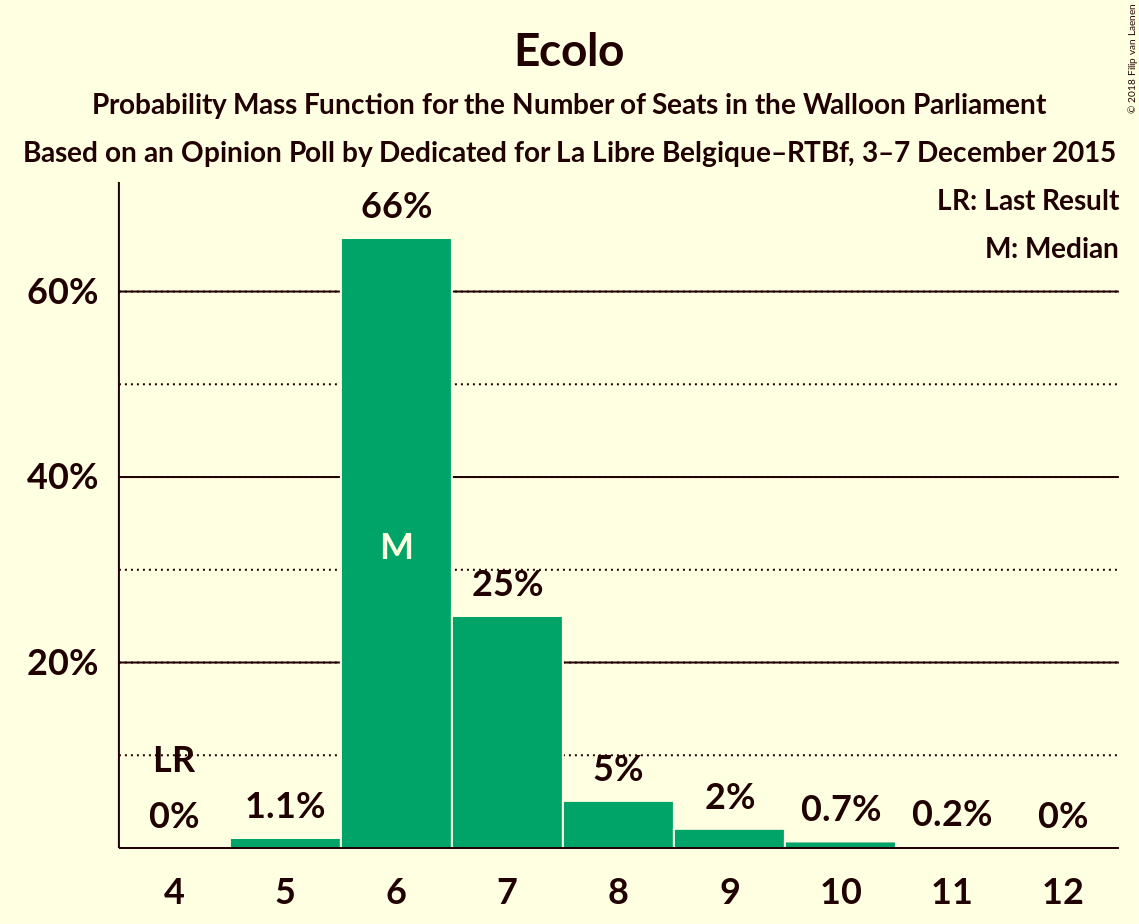
| Number of Seats | Probability | Accumulated | Special Marks |
|---|---|---|---|
| 4 | 0% | 100% | Last Result |
| 5 | 1.1% | 99.9% | |
| 6 | 66% | 98.9% | Median |
| 7 | 25% | 33% | |
| 8 | 5% | 8% | |
| 9 | 2% | 3% | |
| 10 | 0.7% | 0.9% | |
| 11 | 0.2% | 0.2% | |
| 12 | 0% | 0% |
Parti Populaire
For a full overview of the results for this party, see the Parti Populaire page.
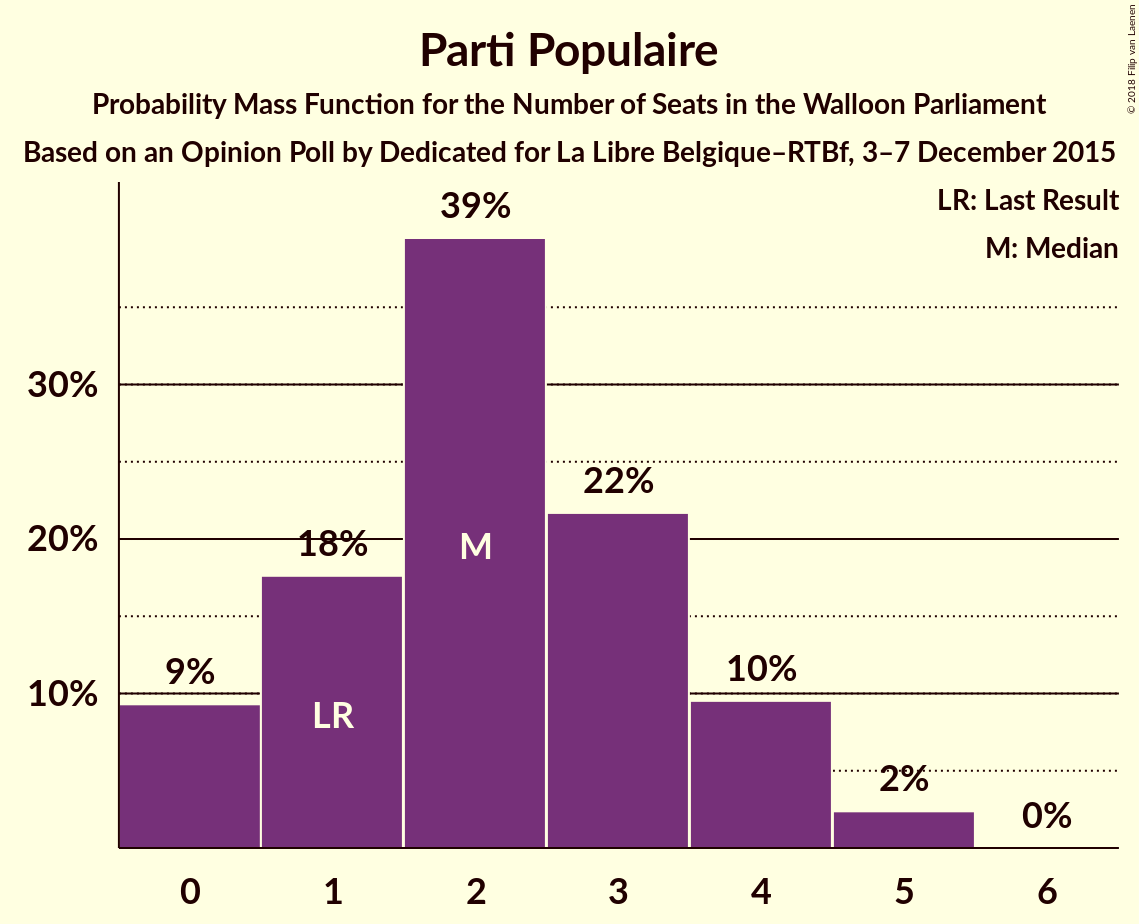
| Number of Seats | Probability | Accumulated | Special Marks |
|---|---|---|---|
| 0 | 9% | 100% | |
| 1 | 18% | 91% | Last Result |
| 2 | 39% | 73% | Median |
| 3 | 22% | 34% | |
| 4 | 10% | 12% | |
| 5 | 2% | 2% | |
| 6 | 0% | 0% |
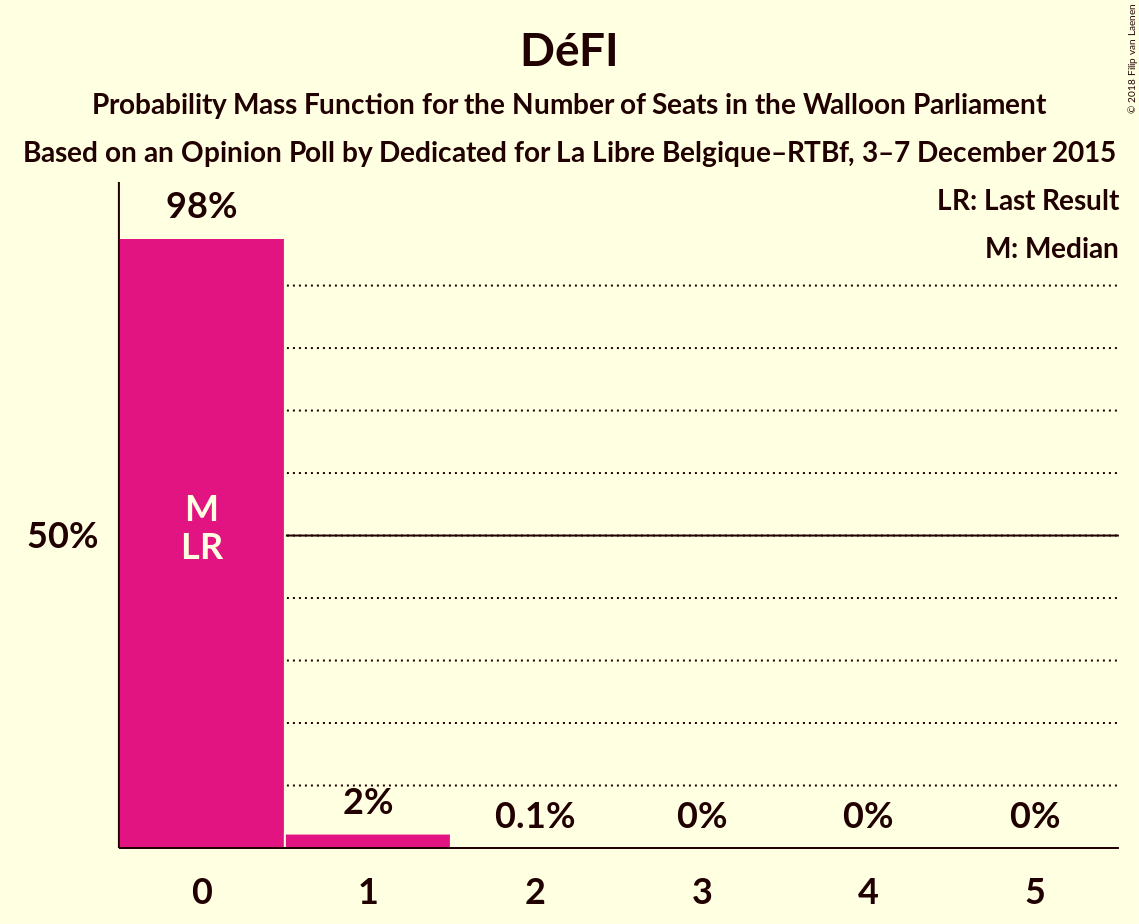
DéFI
For a full overview of the results for this party, see the DéFI page.
| Number of Seats | Probability | Accumulated | Special Marks |
|---|---|---|---|
| 0 | 98% | 100% | Last Result, Median |
| 1 | 2% | 2% | |
| 2 | 0.1% | 0.1% | |
| 3 | 0% | 0% |
Coalitions
Confidence Intervals
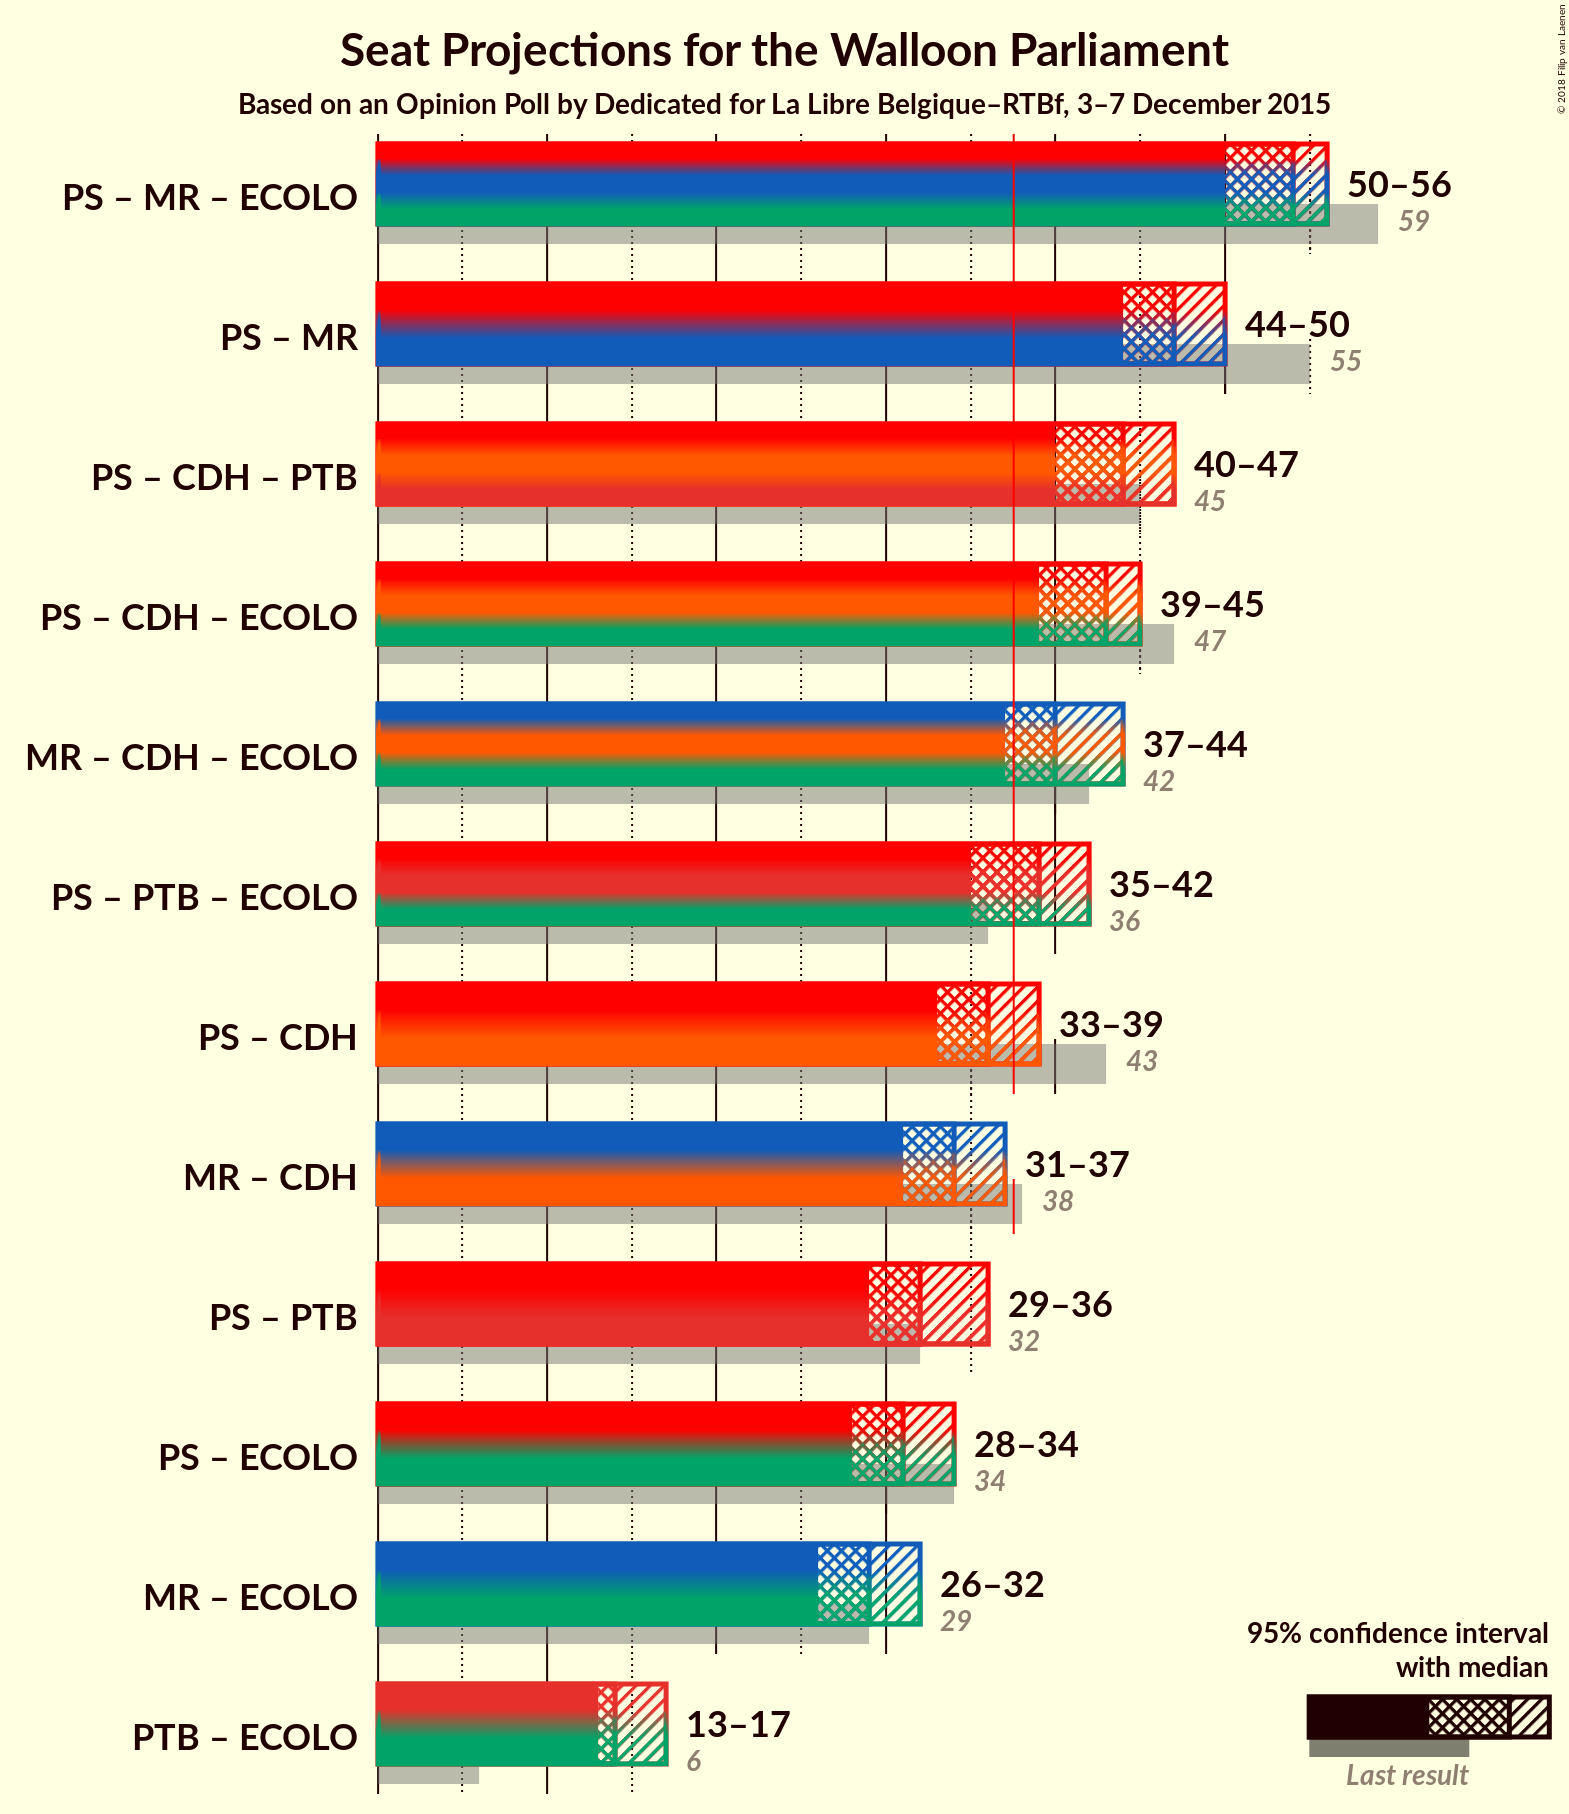
| Coalition | Last Result | Median | Majority? | 80% Confidence Interval | 90% Confidence Interval | 95% Confidence Interval | 99% Confidence Interval |
|---|---|---|---|---|---|---|---|
| PS – MR – Ecolo | 59 | 54 | 100% | 52–55 | 51–56 | 50–56 | 50–57 |
| PS – MR | 55 | 47 | 100% | 45–49 | 44–49 | 44–50 | 43–51 |
| PS – cdH – PTB | 45 | 44 | 100% | 42–46 | 41–46 | 40–47 | 39–48 |
| PS – cdH – Ecolo | 47 | 43 | 99.9% | 40–45 | 39–45 | 39–45 | 38–47 |
| MR – cdH – Ecolo | 42 | 40 | 97% | 38–43 | 38–43 | 37–44 | 36–45 |
| PS – PTB – Ecolo | 36 | 39 | 79% | 37–41 | 36–42 | 35–42 | 35–43 |
| PS – cdH | 43 | 36 | 18% | 34–38 | 33–39 | 33–39 | 32–40 |
| MR – cdH | 38 | 34 | 2% | 32–36 | 31–37 | 31–37 | 30–38 |
| PS – PTB | 32 | 32 | 0.1% | 30–34 | 30–35 | 29–36 | 28–37 |
| PS – Ecolo | 34 | 31 | 0% | 29–33 | 28–34 | 28–34 | 27–35 |
| MR – Ecolo | 29 | 29 | 0% | 27–31 | 27–32 | 26–32 | 26–33 |
| PTB – Ecolo | 6 | 14 | 0% | 13–16 | 13–16 | 13–17 | 12–18 |
PS – MR – Ecolo

| Number of Seats | Probability | Accumulated | Special Marks |
|---|---|---|---|
| 49 | 0.4% | 100% | |
| 50 | 2% | 99.6% | |
| 51 | 7% | 97% | |
| 52 | 13% | 90% | |
| 53 | 27% | 78% | Median |
| 54 | 26% | 51% | |
| 55 | 18% | 25% | |
| 56 | 5% | 7% | |
| 57 | 1.4% | 2% | |
| 58 | 0.2% | 0.2% | |
| 59 | 0% | 0% | Last Result |
PS – MR

| Number of Seats | Probability | Accumulated | Special Marks |
|---|---|---|---|
| 41 | 0% | 100% | |
| 42 | 0.2% | 99.9% | |
| 43 | 1.1% | 99.7% | |
| 44 | 4% | 98.6% | |
| 45 | 11% | 95% | |
| 46 | 16% | 84% | |
| 47 | 30% | 69% | Median |
| 48 | 24% | 39% | |
| 49 | 12% | 15% | |
| 50 | 3% | 3% | |
| 51 | 0.5% | 0.6% | |
| 52 | 0.1% | 0.1% | |
| 53 | 0% | 0% | |
| 54 | 0% | 0% | |
| 55 | 0% | 0% | Last Result |
PS – cdH – PTB

| Number of Seats | Probability | Accumulated | Special Marks |
|---|---|---|---|
| 38 | 0.1% | 100% | Majority |
| 39 | 0.5% | 99.9% | |
| 40 | 2% | 99.4% | |
| 41 | 6% | 97% | |
| 42 | 13% | 91% | |
| 43 | 17% | 77% | |
| 44 | 21% | 60% | Median |
| 45 | 21% | 39% | Last Result |
| 46 | 14% | 19% | |
| 47 | 3% | 5% | |
| 48 | 1.1% | 1.2% | |
| 49 | 0.1% | 0.1% | |
| 50 | 0% | 0% |
PS – cdH – Ecolo

| Number of Seats | Probability | Accumulated | Special Marks |
|---|---|---|---|
| 37 | 0.1% | 100% | |
| 38 | 1.0% | 99.9% | Majority |
| 39 | 4% | 98.9% | |
| 40 | 9% | 95% | |
| 41 | 14% | 86% | |
| 42 | 20% | 72% | Median |
| 43 | 24% | 51% | |
| 44 | 15% | 27% | |
| 45 | 10% | 12% | |
| 46 | 2% | 2% | |
| 47 | 0.4% | 0.5% | Last Result |
| 48 | 0.1% | 0.1% | |
| 49 | 0% | 0% |
MR – cdH – Ecolo

| Number of Seats | Probability | Accumulated | Special Marks |
|---|---|---|---|
| 35 | 0.1% | 100% | |
| 36 | 0.4% | 99.9% | |
| 37 | 3% | 99.5% | |
| 38 | 9% | 97% | Majority |
| 39 | 17% | 88% | |
| 40 | 24% | 72% | |
| 41 | 22% | 48% | Median |
| 42 | 15% | 26% | Last Result |
| 43 | 7% | 11% | |
| 44 | 3% | 4% | |
| 45 | 1.0% | 1.1% | |
| 46 | 0.1% | 0.1% | |
| 47 | 0% | 0% |
PS – PTB – Ecolo

| Number of Seats | Probability | Accumulated | Special Marks |
|---|---|---|---|
| 34 | 0.3% | 100% | |
| 35 | 2% | 99.7% | |
| 36 | 7% | 97% | Last Result |
| 37 | 11% | 90% | |
| 38 | 23% | 79% | Median, Majority |
| 39 | 20% | 56% | |
| 40 | 20% | 36% | |
| 41 | 9% | 16% | |
| 42 | 5% | 7% | |
| 43 | 1.1% | 1.4% | |
| 44 | 0.2% | 0.3% | |
| 45 | 0.1% | 0.1% | |
| 46 | 0% | 0% |
PS – cdH

| Number of Seats | Probability | Accumulated | Special Marks |
|---|---|---|---|
| 31 | 0.4% | 100% | |
| 32 | 2% | 99.6% | |
| 33 | 7% | 98% | |
| 34 | 11% | 91% | |
| 35 | 16% | 80% | |
| 36 | 22% | 64% | Median |
| 37 | 23% | 42% | |
| 38 | 12% | 18% | Majority |
| 39 | 6% | 7% | |
| 40 | 0.8% | 1.0% | |
| 41 | 0.1% | 0.1% | |
| 42 | 0% | 0% | |
| 43 | 0% | 0% | Last Result |
MR – cdH

| Number of Seats | Probability | Accumulated | Special Marks |
|---|---|---|---|
| 29 | 0.1% | 100% | |
| 30 | 0.9% | 99.8% | |
| 31 | 5% | 98.9% | |
| 32 | 11% | 94% | |
| 33 | 19% | 83% | |
| 34 | 25% | 64% | |
| 35 | 22% | 38% | Median |
| 36 | 9% | 16% | |
| 37 | 5% | 7% | |
| 38 | 2% | 2% | Last Result, Majority |
| 39 | 0.1% | 0.1% | |
| 40 | 0% | 0% |
PS – PTB

| Number of Seats | Probability | Accumulated | Special Marks |
|---|---|---|---|
| 28 | 1.2% | 100% | |
| 29 | 3% | 98.7% | |
| 30 | 9% | 95% | |
| 31 | 17% | 87% | |
| 32 | 22% | 69% | Last Result, Median |
| 33 | 20% | 47% | |
| 34 | 17% | 27% | |
| 35 | 7% | 10% | |
| 36 | 3% | 3% | |
| 37 | 0.6% | 0.7% | |
| 38 | 0.1% | 0.1% | Majority |
| 39 | 0% | 0% |
PS – Ecolo

| Number of Seats | Probability | Accumulated | Special Marks |
|---|---|---|---|
| 26 | 0.1% | 100% | |
| 27 | 2% | 99.9% | |
| 28 | 6% | 98% | |
| 29 | 7% | 92% | |
| 30 | 27% | 84% | Median |
| 31 | 21% | 57% | |
| 32 | 17% | 37% | |
| 33 | 13% | 19% | |
| 34 | 5% | 6% | Last Result |
| 35 | 1.1% | 2% | |
| 36 | 0.3% | 0.4% | |
| 37 | 0% | 0.1% | |
| 38 | 0% | 0% | Majority |
MR – Ecolo

| Number of Seats | Probability | Accumulated | Special Marks |
|---|---|---|---|
| 24 | 0.1% | 100% | |
| 25 | 0.3% | 99.9% | |
| 26 | 2% | 99.6% | |
| 27 | 20% | 97% | |
| 28 | 17% | 78% | |
| 29 | 25% | 61% | Last Result, Median |
| 30 | 20% | 36% | |
| 31 | 9% | 16% | |
| 32 | 5% | 7% | |
| 33 | 2% | 2% | |
| 34 | 0.4% | 0.4% | |
| 35 | 0% | 0% |
PTB – Ecolo

| Number of Seats | Probability | Accumulated | Special Marks |
|---|---|---|---|
| 6 | 0% | 100% | Last Result |
| 7 | 0% | 100% | |
| 8 | 0% | 100% | |
| 9 | 0% | 100% | |
| 10 | 0% | 100% | |
| 11 | 0.1% | 100% | |
| 12 | 2% | 99.9% | |
| 13 | 17% | 98% | |
| 14 | 46% | 81% | Median |
| 15 | 22% | 35% | |
| 16 | 10% | 13% | |
| 17 | 2% | 3% | |
| 18 | 0.9% | 1.2% | |
| 19 | 0.3% | 0.4% | |
| 20 | 0.1% | 0.1% | |
| 21 | 0% | 0% |
Technical Information
Opinion Poll
- Polling firm: Dedicated
- Commissioner(s): La Libre Belgique–RTBf
- Fieldwork period: 3–7 December 2015
Calculations
- Sample size: 910
- Simulations done: 2,097,152
- Error estimate: 0.98%