Overview
The table below lists the most recent polls (less than 90 days old) registered and analyzed so far.
| Period | Polling firm/Commissioner(s) | CON | LAB | LIBDEM | SNP | UKIP | GREEN | PC | BREXIT | ChUK |
|---|---|---|---|---|---|---|---|---|---|---|
| 8 June 2017 | General Election | 43.4% 317 |
41.0% 262 |
7.6% 12 |
3.1% 35 |
1.9% 0 |
1.7% 1 |
0.5% 4 |
0.0% 0 |
0.0% 0 |
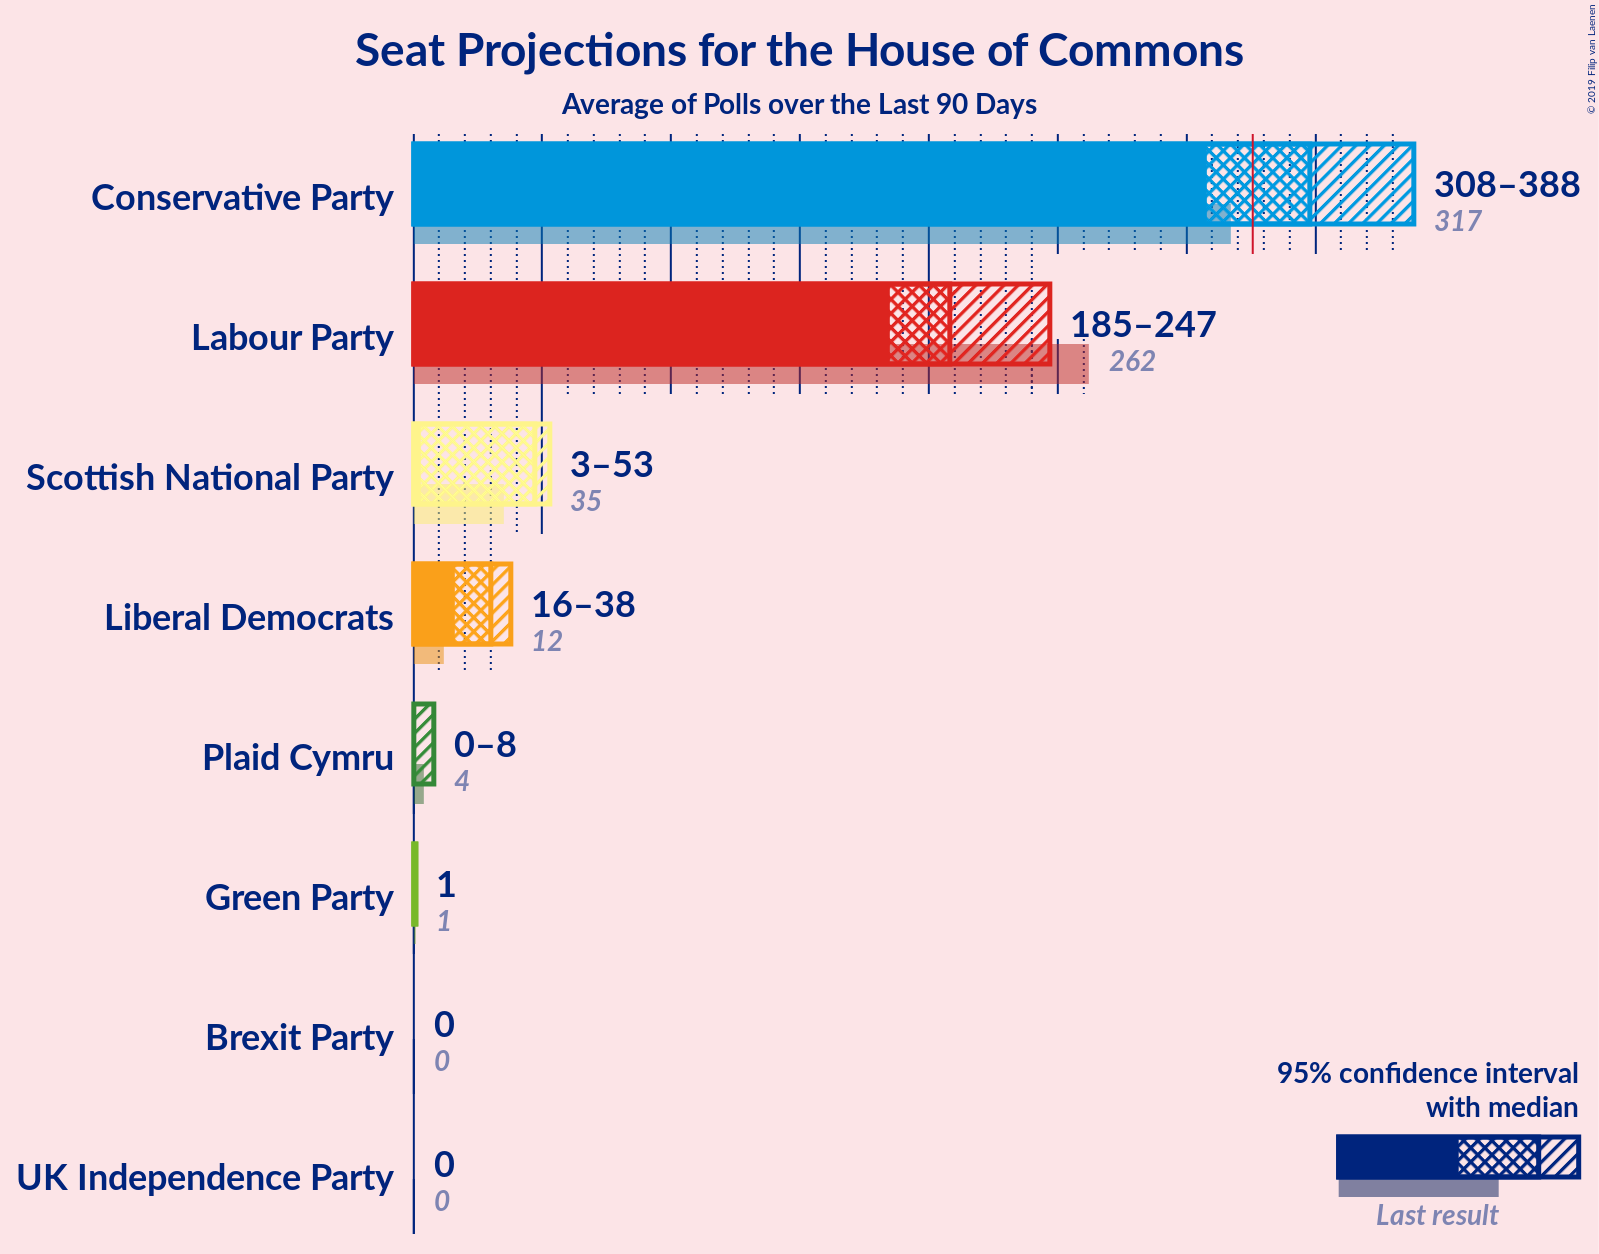
| N/A | Poll Average | 40–46% 308–388 |
30–37% 185–247 |
9–15% 16–38 |
2–5% 3–53 |
0–1% 0 |
2–4% 1 |
0–1% 0–8 |
2–5% 0 |
N/A N/A |
| 10–11 December 2019 | Survation | 43–47% 333–378 |
32–36% 186–225 |
8–10% 13–22 |
3–5% 41–54 |
N/A N/A |
2–4% 1 |
1% 5–8 |
2–4% 0 |
N/A N/A |
| 10–11 December 2019 | Panelbase | 41–45% 320–360 |
32–36% 198–234 |
10–12% 22–30 |
3–5% 41–52 |
N/A N/A |
2–4% 1 |
0–1% 0–3 |
3–5% 0 |
N/A N/A |
| 10–11 December 2019 | Opinium | 44–47% 336–375 |
32–35% 185–217 |
11–13% 26–31 |
3–5% 41–51 |
N/A N/A |
2–3% 1 |
0–1% 0–3 |
2–3% 0 |
N/A N/A |
| 9–11 December 2019 | Kantar Public | 42–46% 333–373 |
30–34% 183–218 |
12–14% 30–34 |
3–5% 41–51 |
N/A N/A |
2–4% 1 |
0–1% 0–3 |
2–4% 0 |
N/A N/A |
| 9–11 December 2019 | Ipsos MORI Evening Standard |
42–46% 339–380 |
31–35% 185–227 |
11–13% 26–33 |
N/A N/A |
N/A N/A |
2–4% 1 |
N/A N/A |
1–3% 0 |
N/A N/A |
| 9–11 December 2019 | Deltapoll | 42–47% 322–376 |
32–37% 190–238 |
9–11% 16–29 |
3–5% 39–54 |
N/A N/A |
2–4% 1 |
0–1% 0–3 |
3–5% 0 |
N/A N/A |
| 6–11 December 2019 | BMG Research | 39–43% 318–374 |
30–34% 187–237 |
12–16% 31–44 |
N/A N/A |
N/A N/A |
2–4% 1 |
N/A N/A |
3–5% 0 |
N/A N/A |
| 8–10 December 2019 | Number Cruncher Politics Bloomberg |
40–46% 311–376 |
30–36% 179–235 |
10–14% 21–35 |
3–5% 36–54 |
N/A N/A |
2–4% 1 |
1–2% 3–10 |
2–4% 0 |
N/A N/A |
| 9–10 December 2019 | ComRes Daily Telegraph |
39–43% 286–335 |
34–38% 217–262 |
11–13% 26–35 |
3–5% 40–54 |
N/A N/A |
1–3% 1 |
N/A N/A |
2–4% 0 |
N/A N/A |
| 6–9 December 2019 | ICM Research | 40–44% 303–351 |
34–38% 214–264 |
11–14% 26–35 |
2–4% 17–48 |
0–1% 0 |
1–3% 1 |
0–1% 0–3 |
2–4% 0 |
N/A N/A |
| 5–8 December 2019 | Qriously | 41–46% 358–401 |
28–32% 179–229 |
11–14% 28–35 |
2–3% 0–34 |
N/A N/A |
3–5% 1–3 |
N/A N/A |
2–4% 0 |
N/A N/A |
| 5–6 December 2019 | YouGov The Sunday Times |
41–45% 316–370 |
31–35% 186–232 |
11–15% 29–36 |
3–5% 40–53 |
N/A N/A |
2–4% 1 |
0–1% 0–3 |
2–4% 0 |
N/A N/A |
| 8 June 2017 | General Election | 43.4% 317 |
41.0% 262 |
7.6% 12 |
3.1% 35 |
1.9% 0 |
1.7% 1 |
0.5% 4 |
0.0% 0 |
0.0% 0 |
Only polls for which at least the sample size has been published are included in the table above.
Legend:
- Top half of each row: Voting intentions (95% confidence interval)
- Bottom half of each row: Seat projections for the House of Commons (95% confidence interval)
- CON: Conservative Party
- LAB: Labour Party
- LIBDEM: Liberal Democrats
- SNP: Scottish National Party
- UKIP: UK Independence Party
- GREEN: Green Party
- PC: Plaid Cymru
- BREXIT: Brexit Party
- ChUK: Change UK
- N/A (single party): Party not included the published results
- N/A (entire row): Calculation for this opinion poll not started yet


