Opinion Poll by Peil.nl, 21–26 January 2020
Voting Intentions | Seats | Coalitions | Technical Information
Voting Intentions
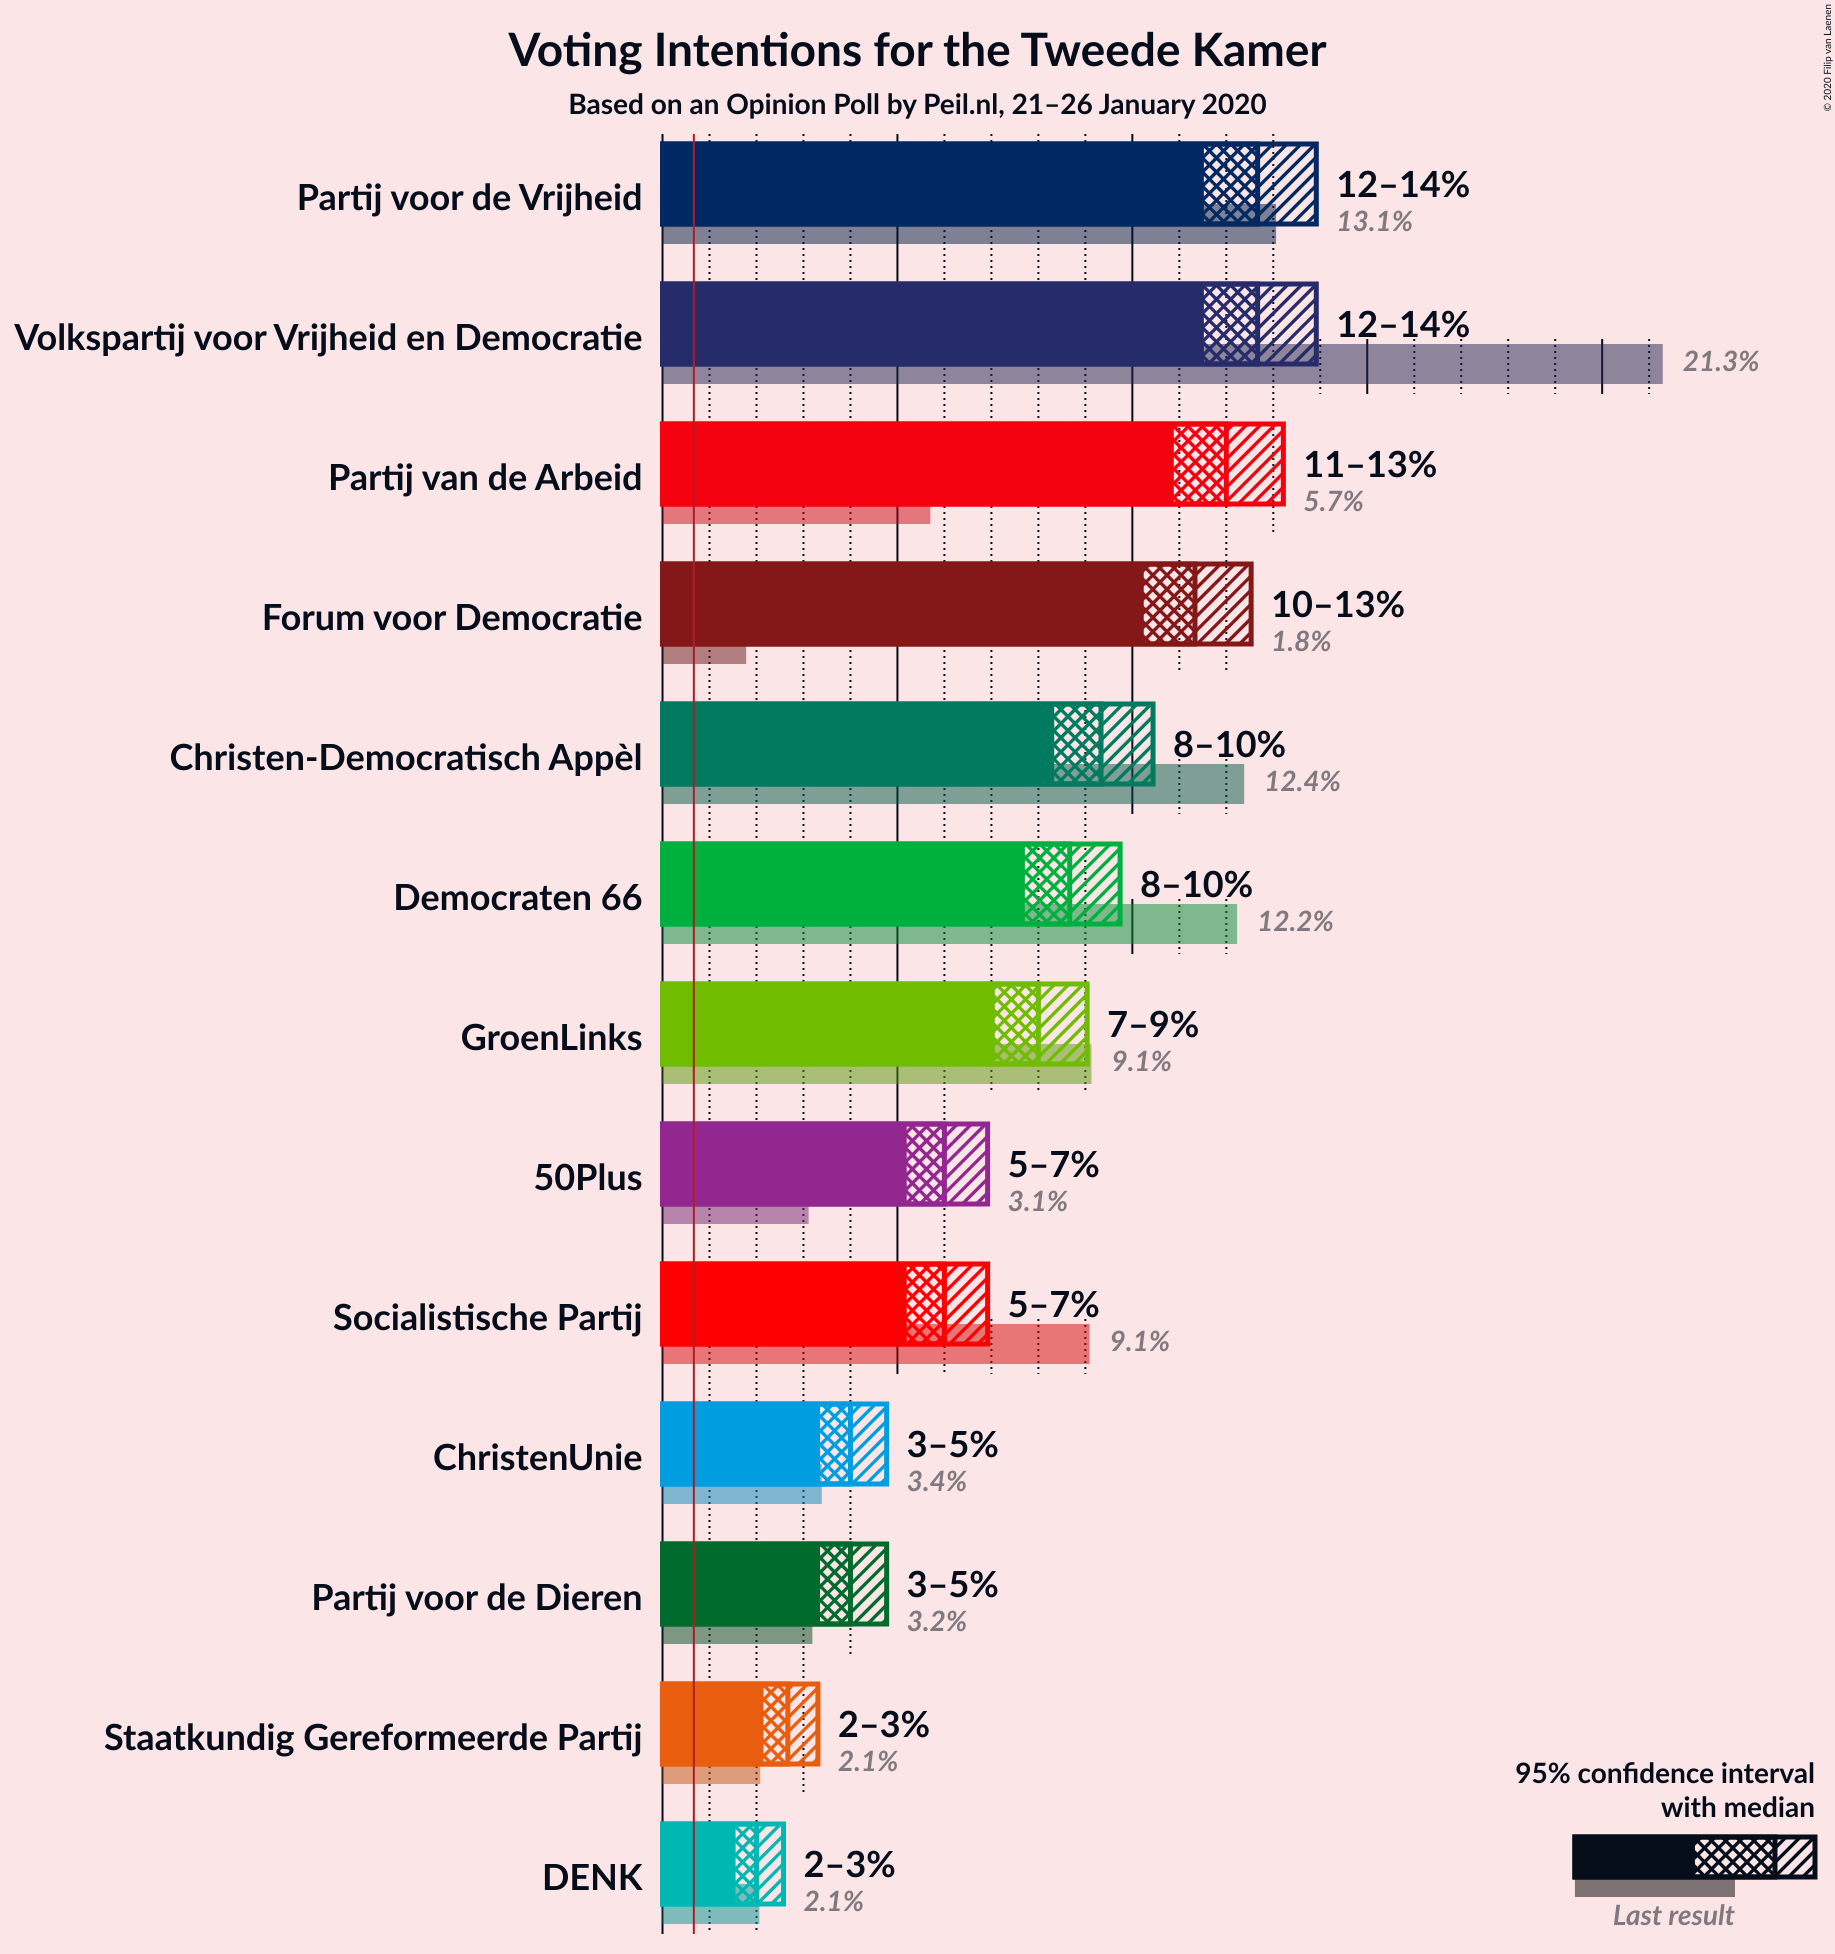
Confidence Intervals
| Party | Last Result | Poll Result | 80% Confidence Interval | 90% Confidence Interval | 95% Confidence Interval | 99% Confidence Interval |
|---|---|---|---|---|---|---|
| Volkspartij voor Vrijheid en Democratie | 21.3% | 12.7% | 11.9–13.5% | 11.7–13.7% | 11.5–13.9% | 11.2–14.3% |
| Partij voor de Vrijheid | 13.1% | 12.7% | 11.9–13.5% | 11.7–13.7% | 11.5–13.9% | 11.2–14.3% |
| Partij van de Arbeid | 5.7% | 12.0% | 11.3–12.8% | 11.1–13.0% | 10.9–13.2% | 10.5–13.6% |
| Forum voor Democratie | 1.8% | 11.3% | 10.6–12.1% | 10.4–12.3% | 10.2–12.5% | 9.9–12.9% |
| Christen-Democratisch Appèl | 12.4% | 9.3% | 8.7–10.1% | 8.5–10.3% | 8.3–10.4% | 8.0–10.8% |
| Democraten 66 | 12.2% | 8.7% | 8.0–9.4% | 7.8–9.6% | 7.7–9.7% | 7.4–10.1% |
| GroenLinks | 9.1% | 8.0% | 7.4–8.7% | 7.2–8.9% | 7.1–9.0% | 6.8–9.4% |
| Socialistische Partij | 9.1% | 6.0% | 5.5–6.6% | 5.3–6.8% | 5.2–6.9% | 5.0–7.2% |
| 50Plus | 3.1% | 6.0% | 5.5–6.6% | 5.3–6.8% | 5.2–6.9% | 5.0–7.2% |
| ChristenUnie | 3.4% | 4.0% | 3.6–4.5% | 3.4–4.6% | 3.4–4.8% | 3.2–5.0% |
| Partij voor de Dieren | 3.2% | 4.0% | 3.6–4.5% | 3.4–4.6% | 3.4–4.8% | 3.2–5.0% |
| Staatkundig Gereformeerde Partij | 2.1% | 2.7% | 2.3–3.1% | 2.2–3.2% | 2.1–3.3% | 2.0–3.5% |
| DENK | 2.1% | 2.0% | 1.7–2.4% | 1.6–2.5% | 1.6–2.6% | 1.4–2.8% |
Note: The poll result column reflects the actual value used in the calculations. Published results may vary slightly, and in addition be rounded to fewer digits.
Seats
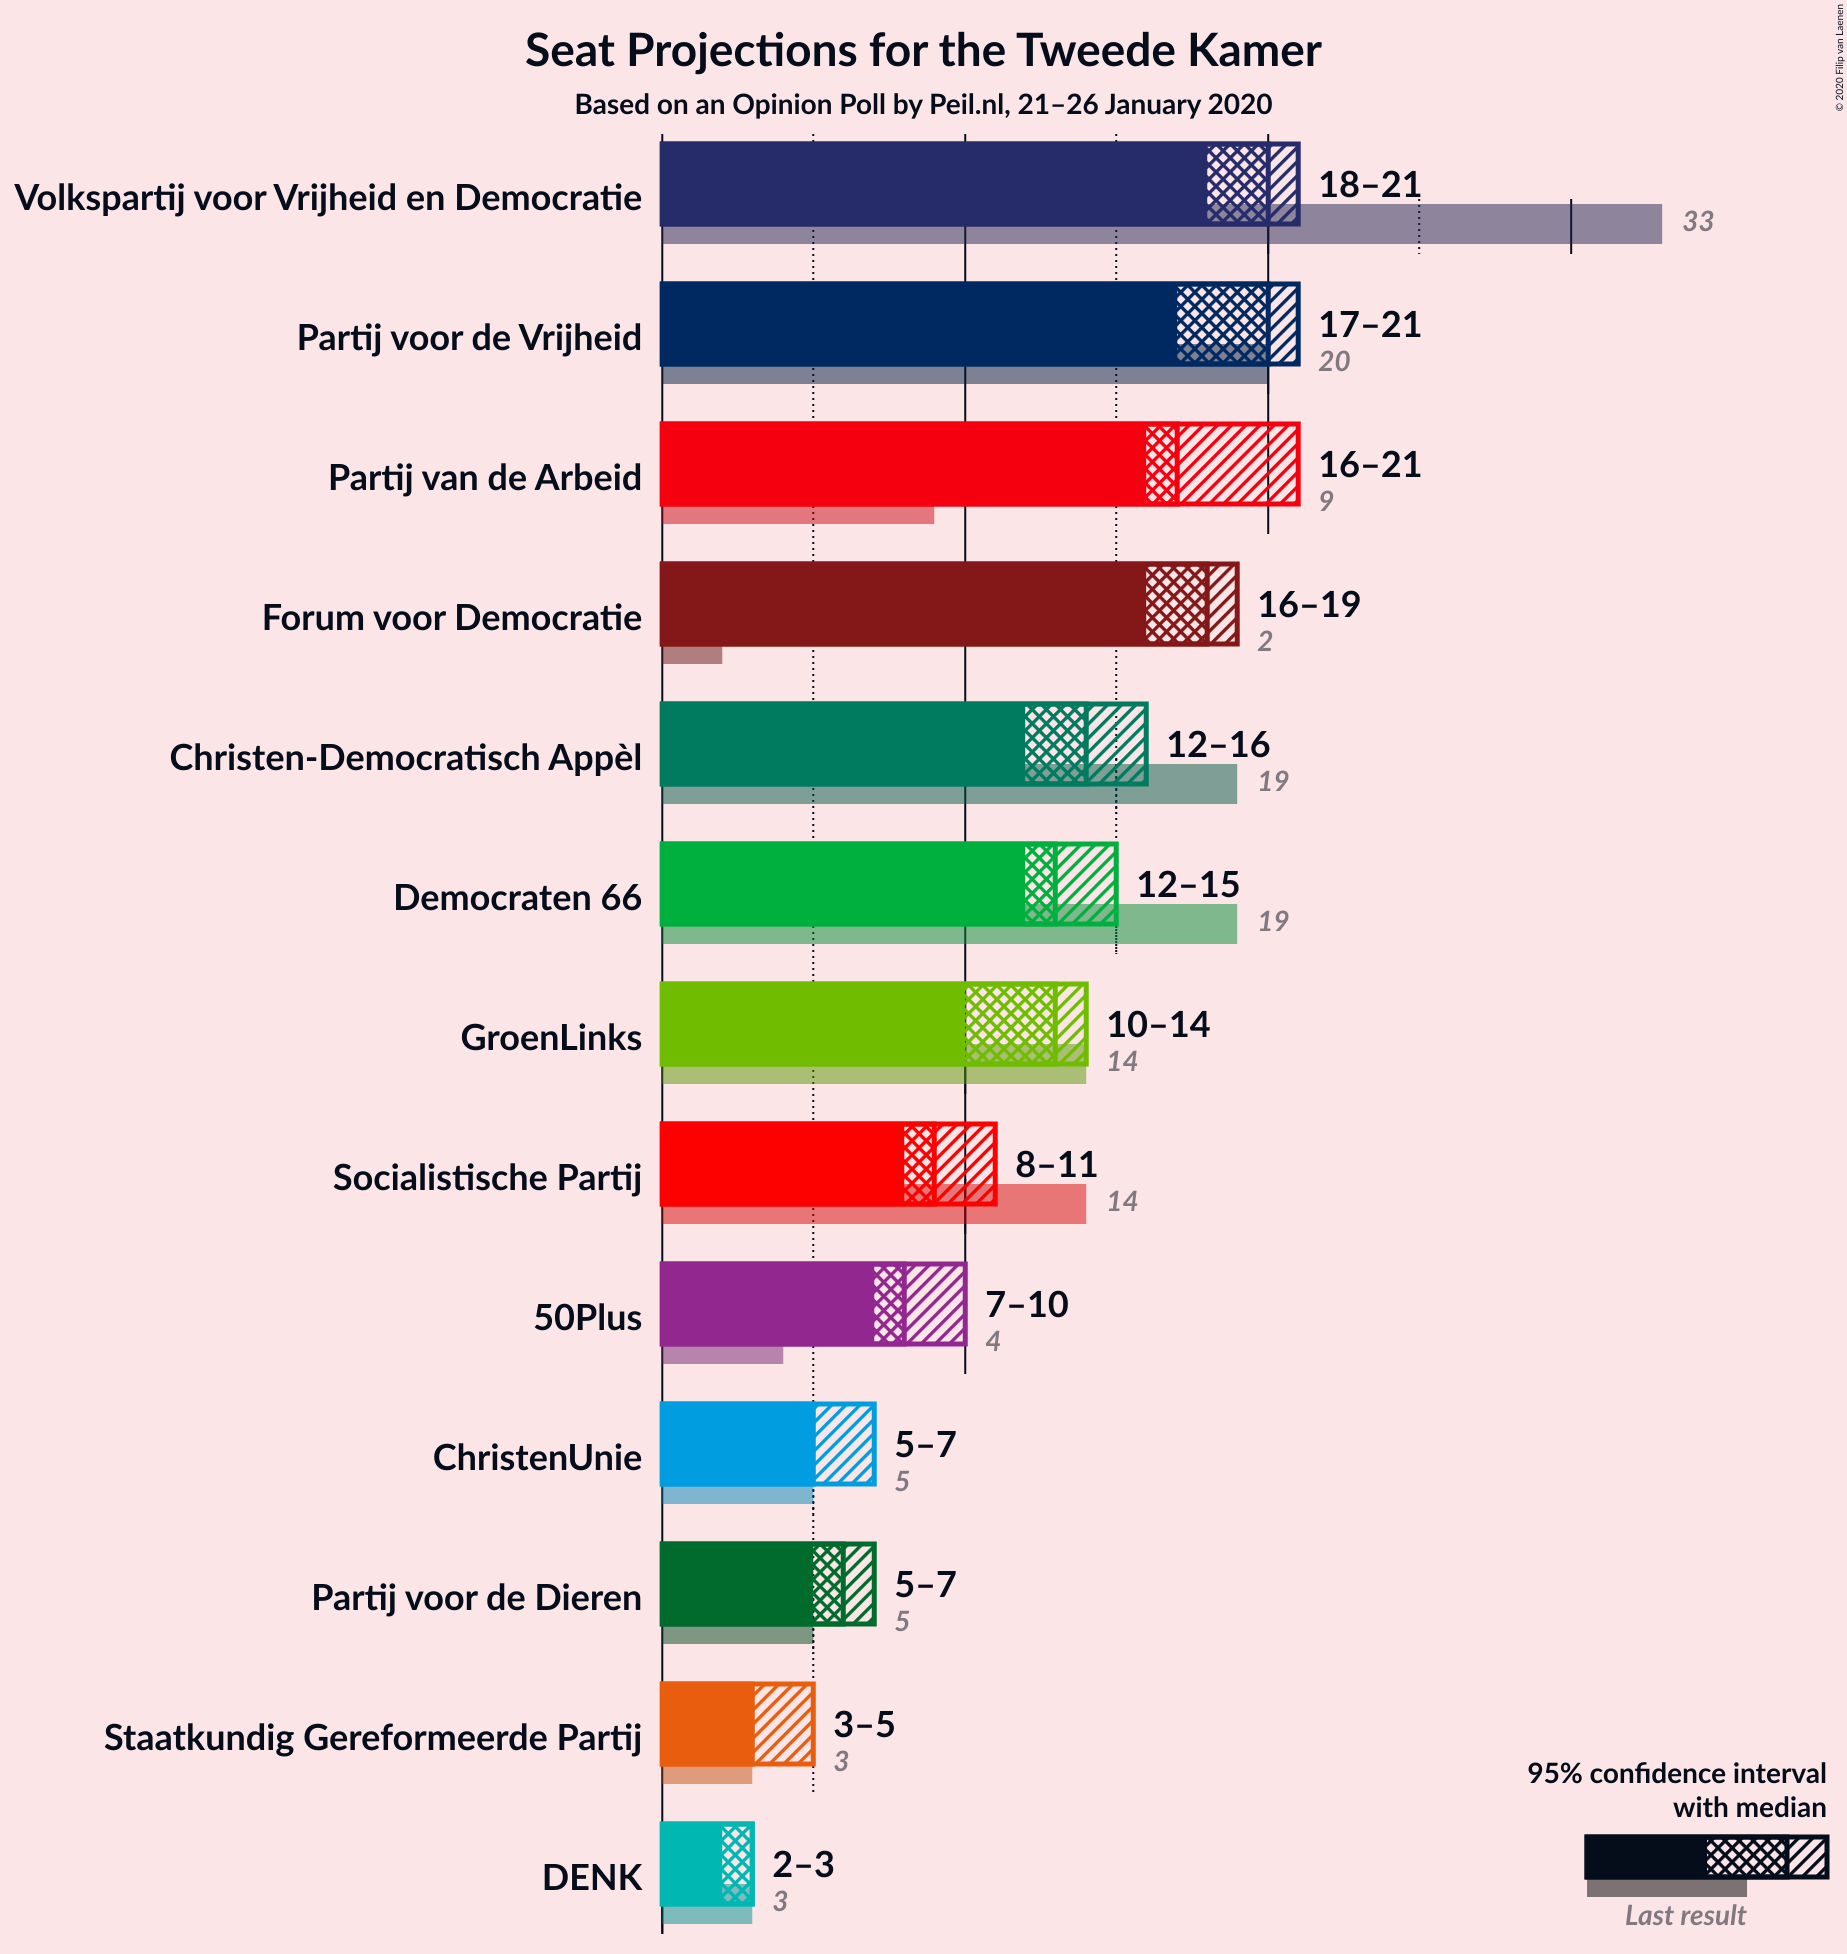
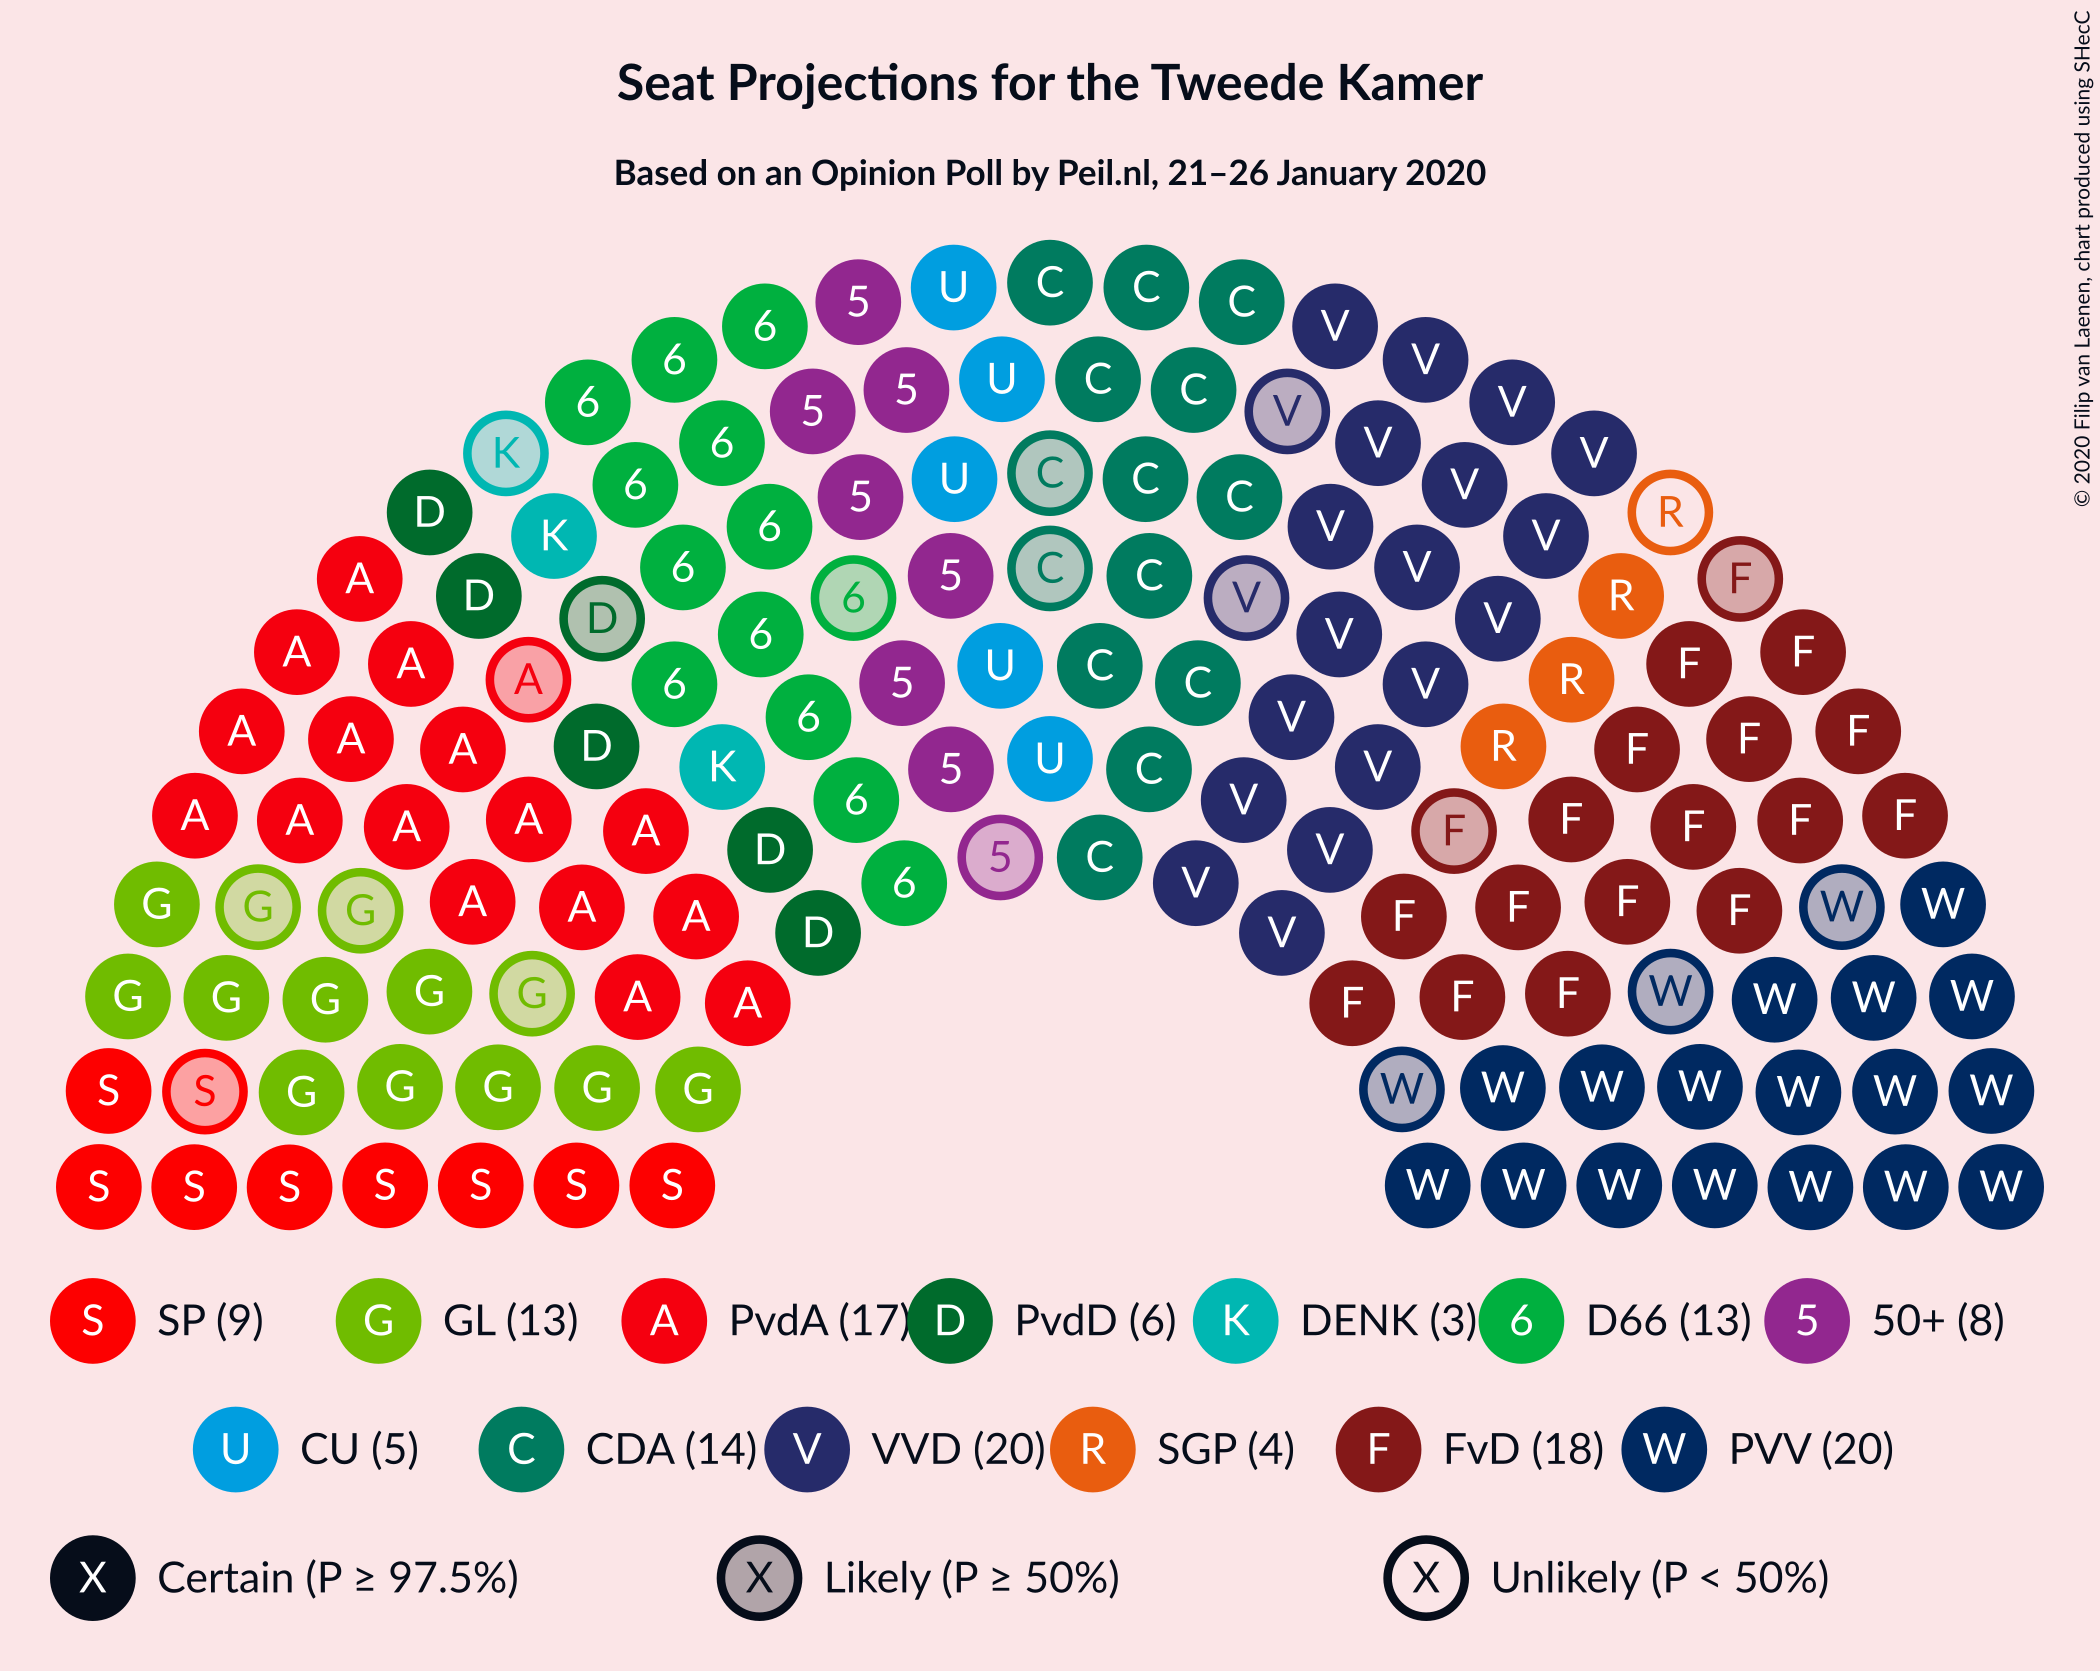
Confidence Intervals
| Party | Last Result | Median | 80% Confidence Interval | 90% Confidence Interval | 95% Confidence Interval | 99% Confidence Interval |
|---|---|---|---|---|---|---|
| Volkspartij voor Vrijheid en Democratie | 33 | 20 | 18–21 | 18–21 | 18–21 | 17–21 |
| Partij voor de Vrijheid | 20 | 20 | 18–20 | 17–20 | 17–21 | 17–22 |
| Partij van de Arbeid | 9 | 17 | 17–19 | 16–20 | 16–21 | 16–21 |
| Forum voor Democratie | 2 | 18 | 17–19 | 16–19 | 16–19 | 15–20 |
| Christen-Democratisch Appèl | 19 | 14 | 13–16 | 12–16 | 12–16 | 12–17 |
| Democraten 66 | 19 | 13 | 12–14 | 12–14 | 12–15 | 11–16 |
| GroenLinks | 14 | 13 | 11–13 | 11–13 | 10–14 | 10–14 |
| Socialistische Partij | 14 | 9 | 8–10 | 8–10 | 8–11 | 7–11 |
| 50Plus | 4 | 8 | 8–10 | 8–10 | 7–10 | 7–10 |
| ChristenUnie | 5 | 5 | 5–6 | 5–6 | 5–7 | 5–7 |
| Partij voor de Dieren | 5 | 6 | 5–6 | 5–7 | 5–7 | 5–7 |
| Staatkundig Gereformeerde Partij | 3 | 3 | 3–4 | 3–5 | 3–5 | 3–5 |
| DENK | 3 | 3 | 2–3 | 2–3 | 2–3 | 2–4 |
Volkspartij voor Vrijheid en Democratie
For a full overview of the results for this party, see the Volkspartij voor Vrijheid en Democratie page.
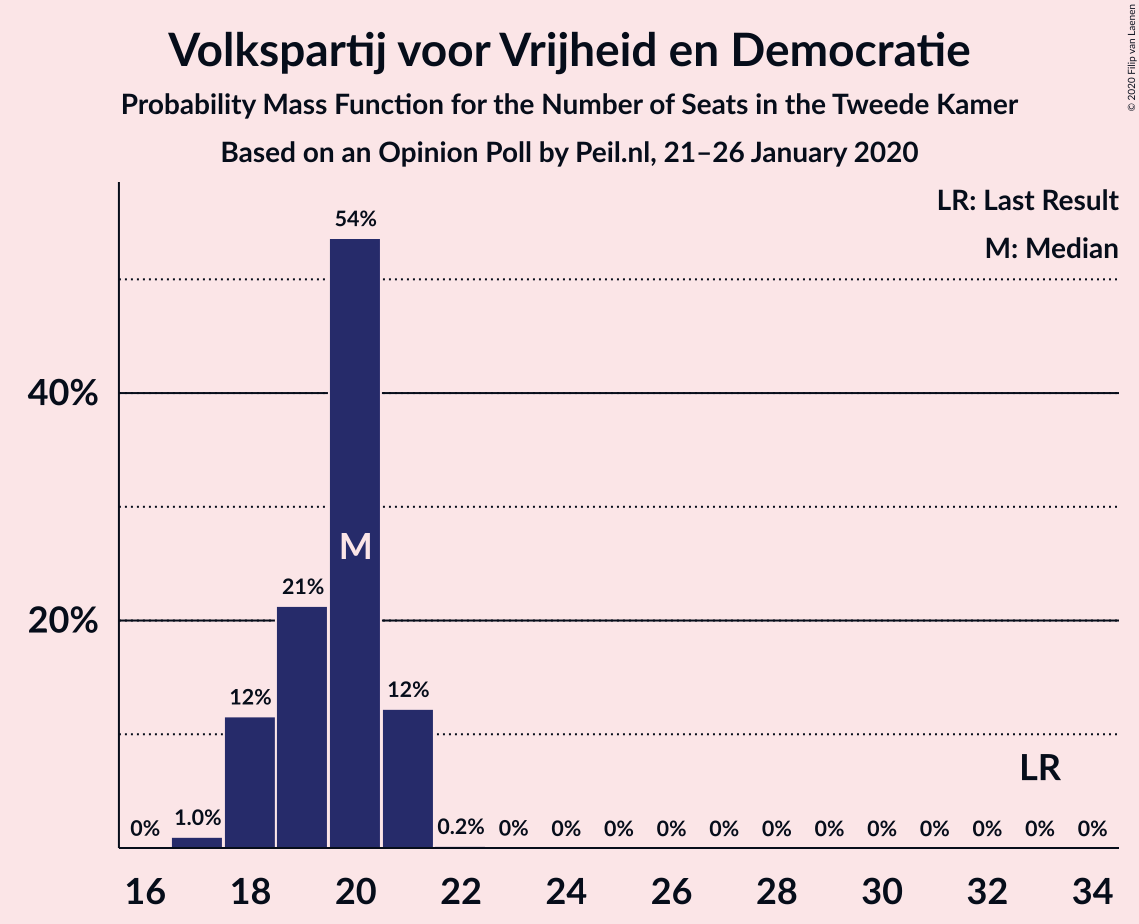
| Number of Seats | Probability | Accumulated | Special Marks |
|---|---|---|---|
| 17 | 1.0% | 100% | |
| 18 | 12% | 99.0% | |
| 19 | 21% | 87% | |
| 20 | 54% | 66% | Median |
| 21 | 12% | 12% | |
| 22 | 0.2% | 0.3% | |
| 23 | 0% | 0.1% | |
| 24 | 0% | 0% | |
| 25 | 0% | 0% | |
| 26 | 0% | 0% | |
| 27 | 0% | 0% | |
| 28 | 0% | 0% | |
| 29 | 0% | 0% | |
| 30 | 0% | 0% | |
| 31 | 0% | 0% | |
| 32 | 0% | 0% | |
| 33 | 0% | 0% | Last Result |
Partij voor de Vrijheid
For a full overview of the results for this party, see the Partij voor de Vrijheid page.
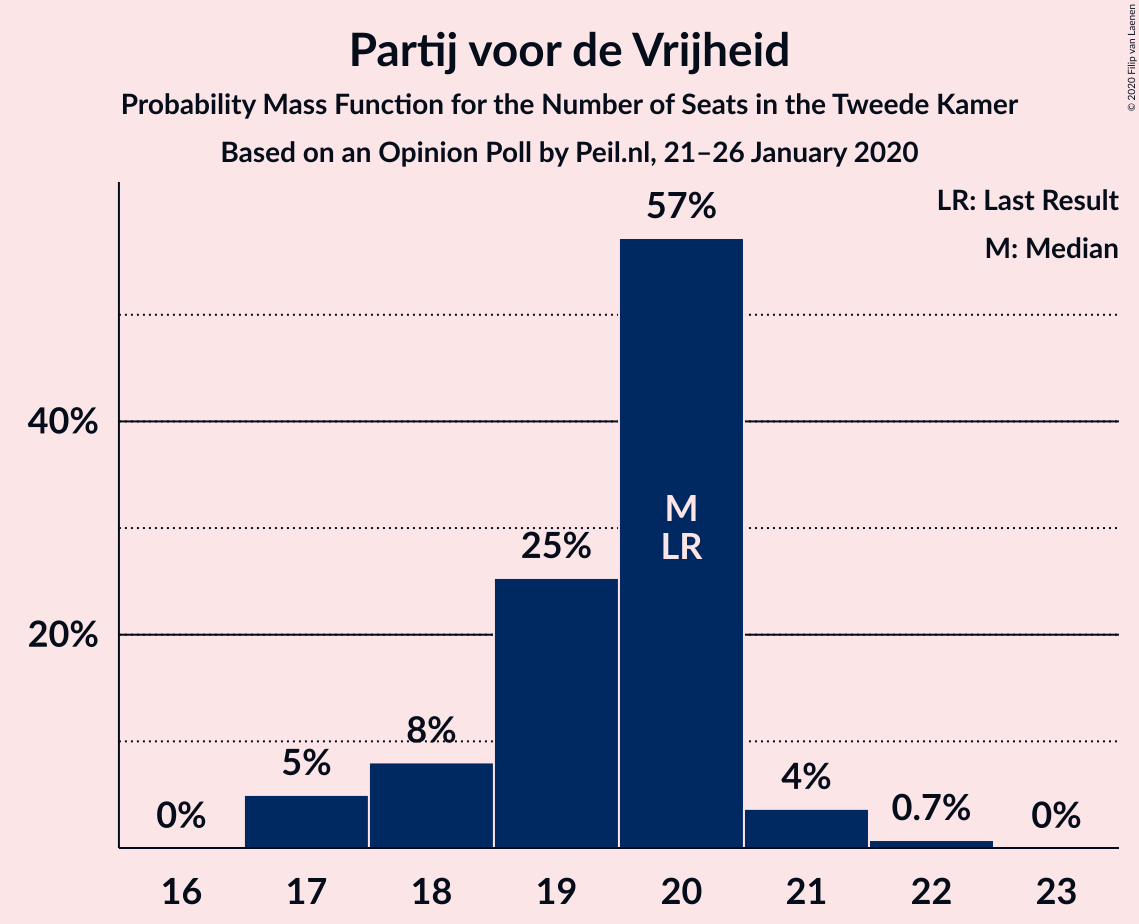
| Number of Seats | Probability | Accumulated | Special Marks |
|---|---|---|---|
| 17 | 5% | 100% | |
| 18 | 8% | 95% | |
| 19 | 25% | 87% | |
| 20 | 57% | 62% | Last Result, Median |
| 21 | 4% | 4% | |
| 22 | 0.7% | 0.8% | |
| 23 | 0% | 0% |
Partij van de Arbeid
For a full overview of the results for this party, see the Partij van de Arbeid page.
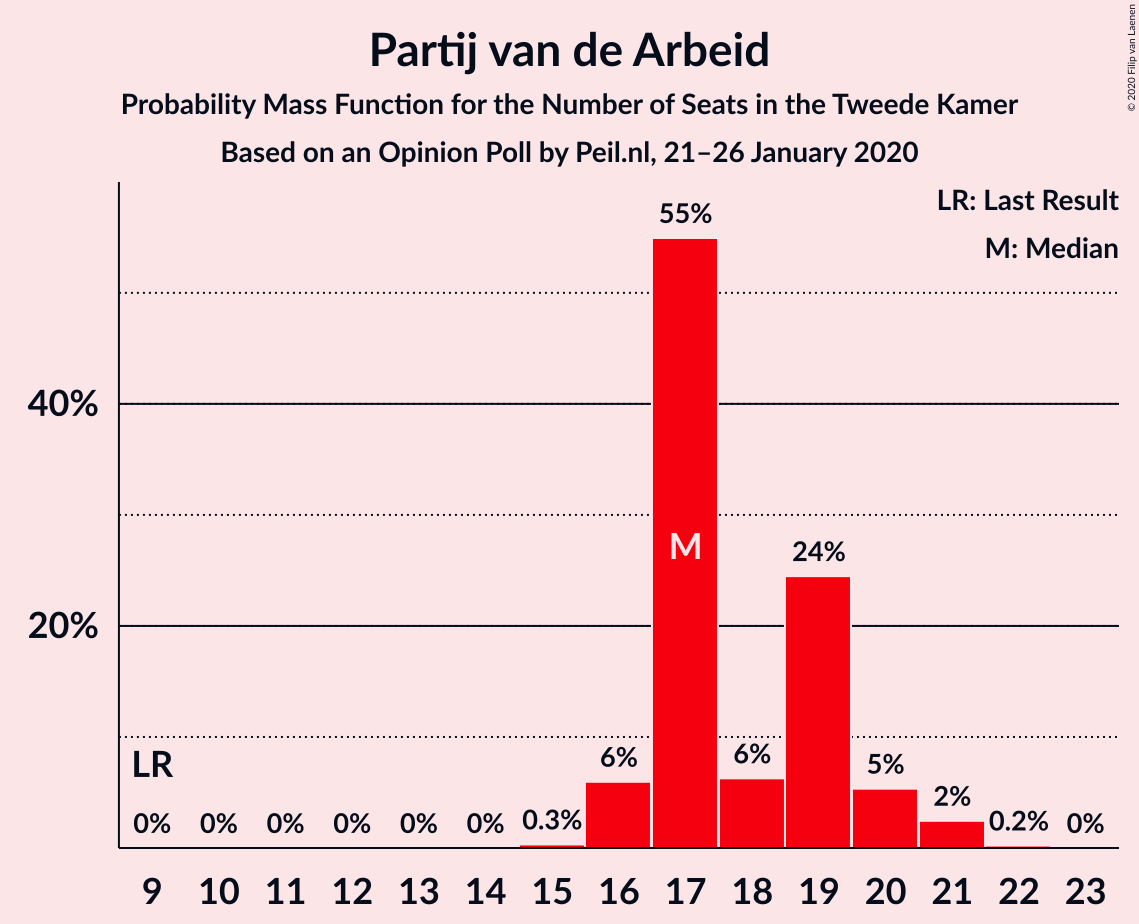
| Number of Seats | Probability | Accumulated | Special Marks |
|---|---|---|---|
| 9 | 0% | 100% | Last Result |
| 10 | 0% | 100% | |
| 11 | 0% | 100% | |
| 12 | 0% | 100% | |
| 13 | 0% | 100% | |
| 14 | 0% | 100% | |
| 15 | 0.3% | 100% | |
| 16 | 6% | 99.7% | |
| 17 | 55% | 94% | Median |
| 18 | 6% | 39% | |
| 19 | 24% | 32% | |
| 20 | 5% | 8% | |
| 21 | 2% | 3% | |
| 22 | 0.2% | 0.2% | |
| 23 | 0% | 0% |
Forum voor Democratie
For a full overview of the results for this party, see the Forum voor Democratie page.
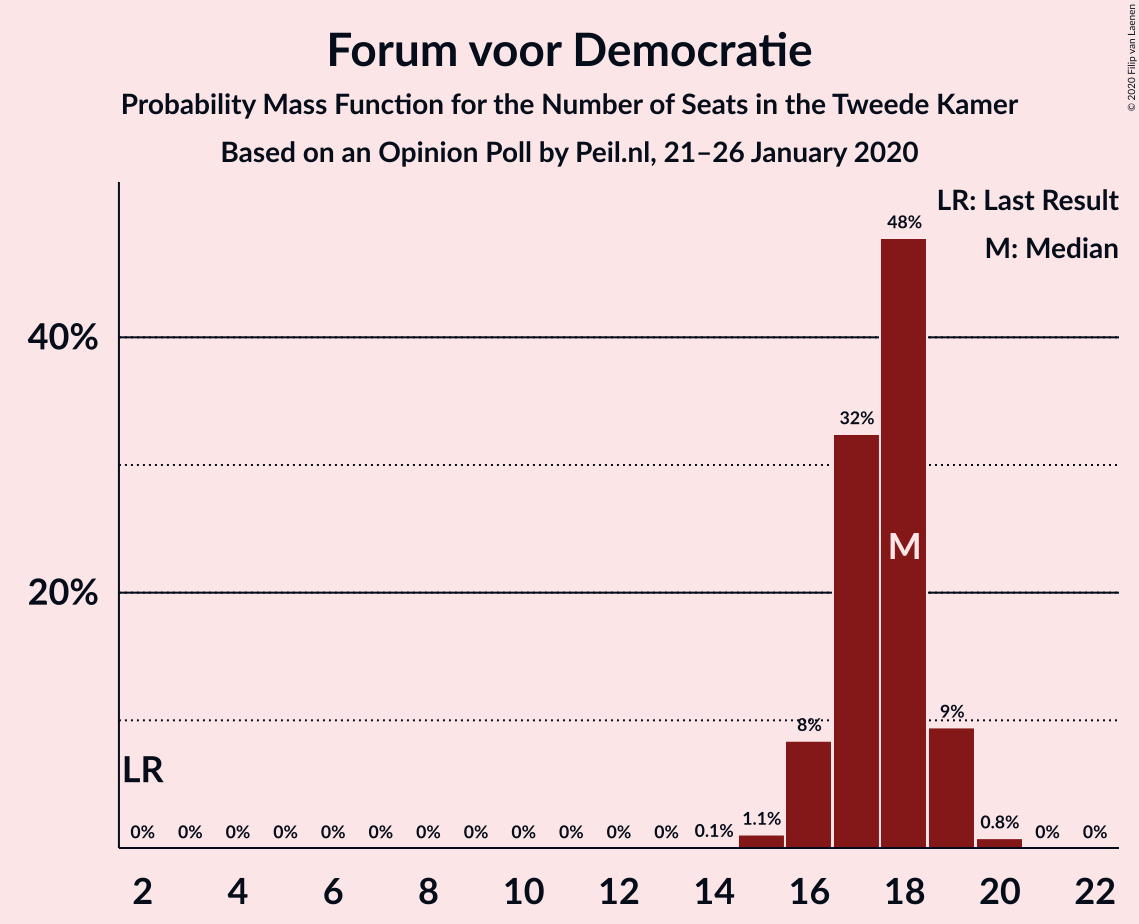
| Number of Seats | Probability | Accumulated | Special Marks |
|---|---|---|---|
| 2 | 0% | 100% | Last Result |
| 3 | 0% | 100% | |
| 4 | 0% | 100% | |
| 5 | 0% | 100% | |
| 6 | 0% | 100% | |
| 7 | 0% | 100% | |
| 8 | 0% | 100% | |
| 9 | 0% | 100% | |
| 10 | 0% | 100% | |
| 11 | 0% | 100% | |
| 12 | 0% | 100% | |
| 13 | 0% | 100% | |
| 14 | 0.1% | 100% | |
| 15 | 1.1% | 99.9% | |
| 16 | 8% | 98.8% | |
| 17 | 32% | 90% | |
| 18 | 48% | 58% | Median |
| 19 | 9% | 10% | |
| 20 | 0.8% | 0.8% | |
| 21 | 0% | 0% |
Christen-Democratisch Appèl
For a full overview of the results for this party, see the Christen-Democratisch Appèl page.
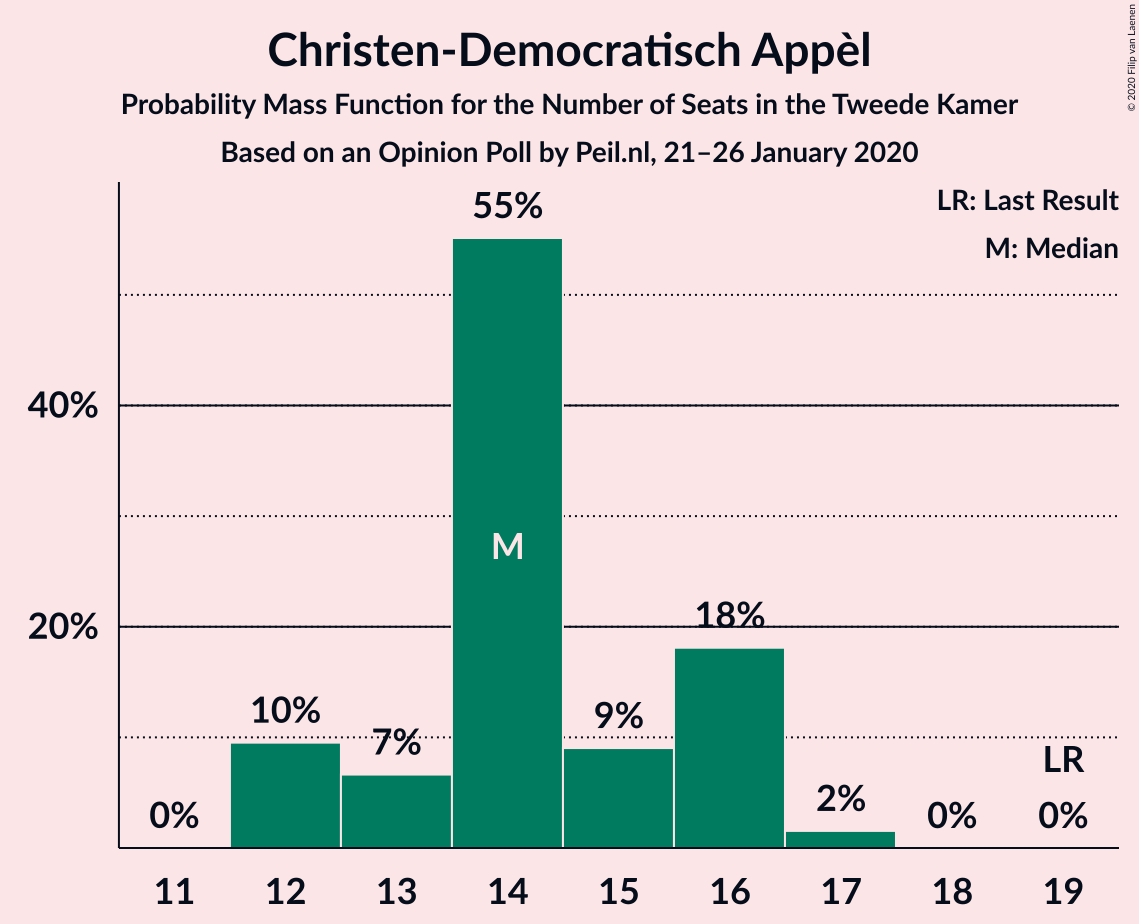
| Number of Seats | Probability | Accumulated | Special Marks |
|---|---|---|---|
| 12 | 10% | 100% | |
| 13 | 7% | 90% | |
| 14 | 55% | 84% | Median |
| 15 | 9% | 29% | |
| 16 | 18% | 20% | |
| 17 | 2% | 2% | |
| 18 | 0% | 0% | |
| 19 | 0% | 0% | Last Result |
Democraten 66
For a full overview of the results for this party, see the Democraten 66 page.
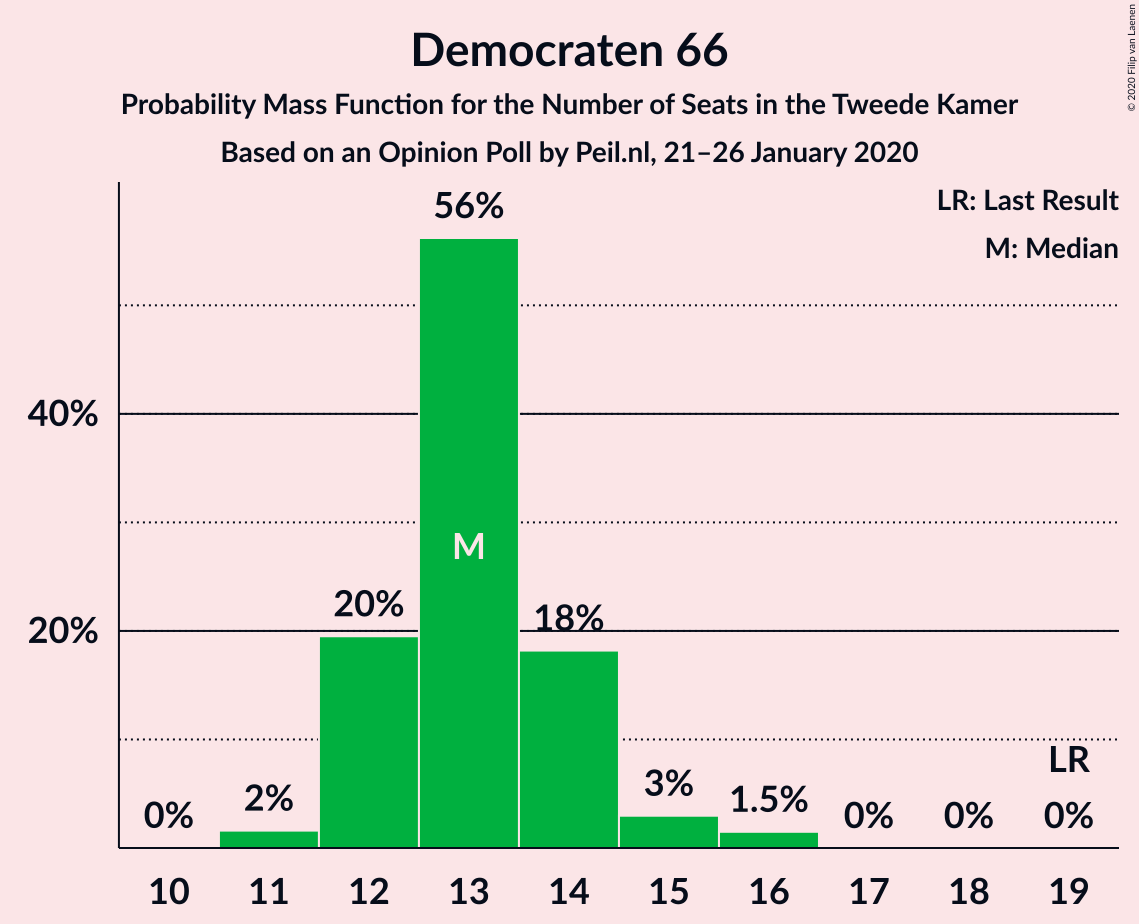
| Number of Seats | Probability | Accumulated | Special Marks |
|---|---|---|---|
| 11 | 2% | 100% | |
| 12 | 20% | 98% | |
| 13 | 56% | 79% | Median |
| 14 | 18% | 23% | |
| 15 | 3% | 4% | |
| 16 | 1.5% | 1.5% | |
| 17 | 0% | 0% | |
| 18 | 0% | 0% | |
| 19 | 0% | 0% | Last Result |
GroenLinks
For a full overview of the results for this party, see the GroenLinks page.
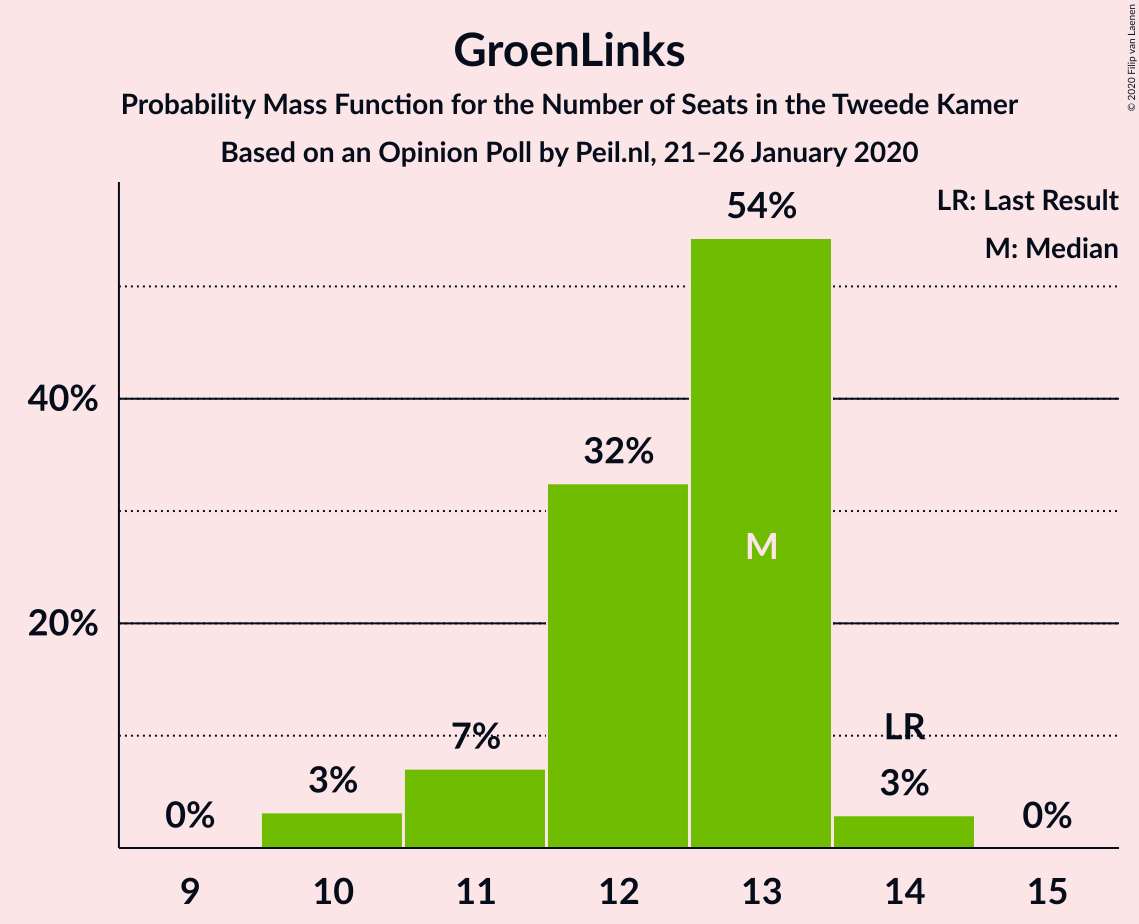
| Number of Seats | Probability | Accumulated | Special Marks |
|---|---|---|---|
| 10 | 3% | 100% | |
| 11 | 7% | 97% | |
| 12 | 32% | 90% | |
| 13 | 54% | 57% | Median |
| 14 | 3% | 3% | Last Result |
| 15 | 0% | 0% |
Socialistische Partij
For a full overview of the results for this party, see the Socialistische Partij page.
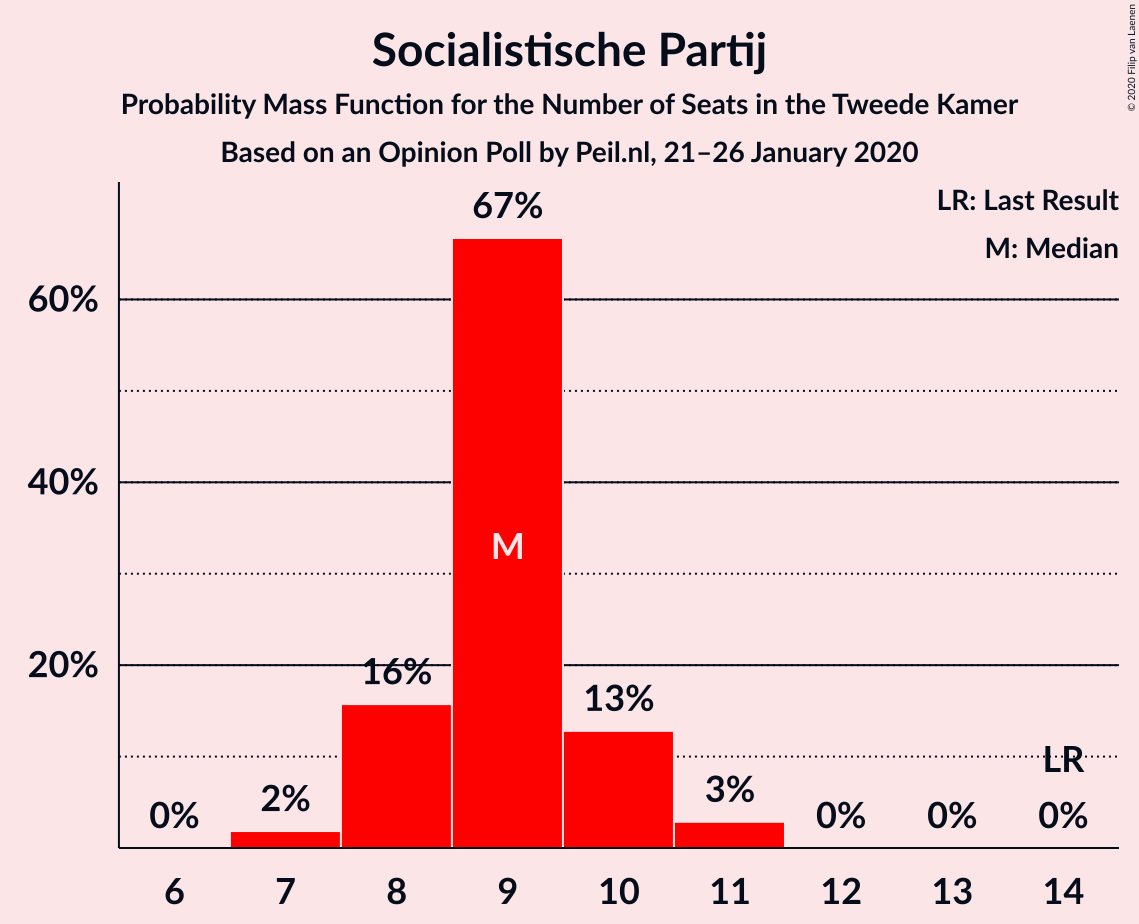
| Number of Seats | Probability | Accumulated | Special Marks |
|---|---|---|---|
| 7 | 2% | 100% | |
| 8 | 16% | 98% | |
| 9 | 67% | 82% | Median |
| 10 | 13% | 16% | |
| 11 | 3% | 3% | |
| 12 | 0% | 0% | |
| 13 | 0% | 0% | |
| 14 | 0% | 0% | Last Result |
50Plus
For a full overview of the results for this party, see the 50Plus page.
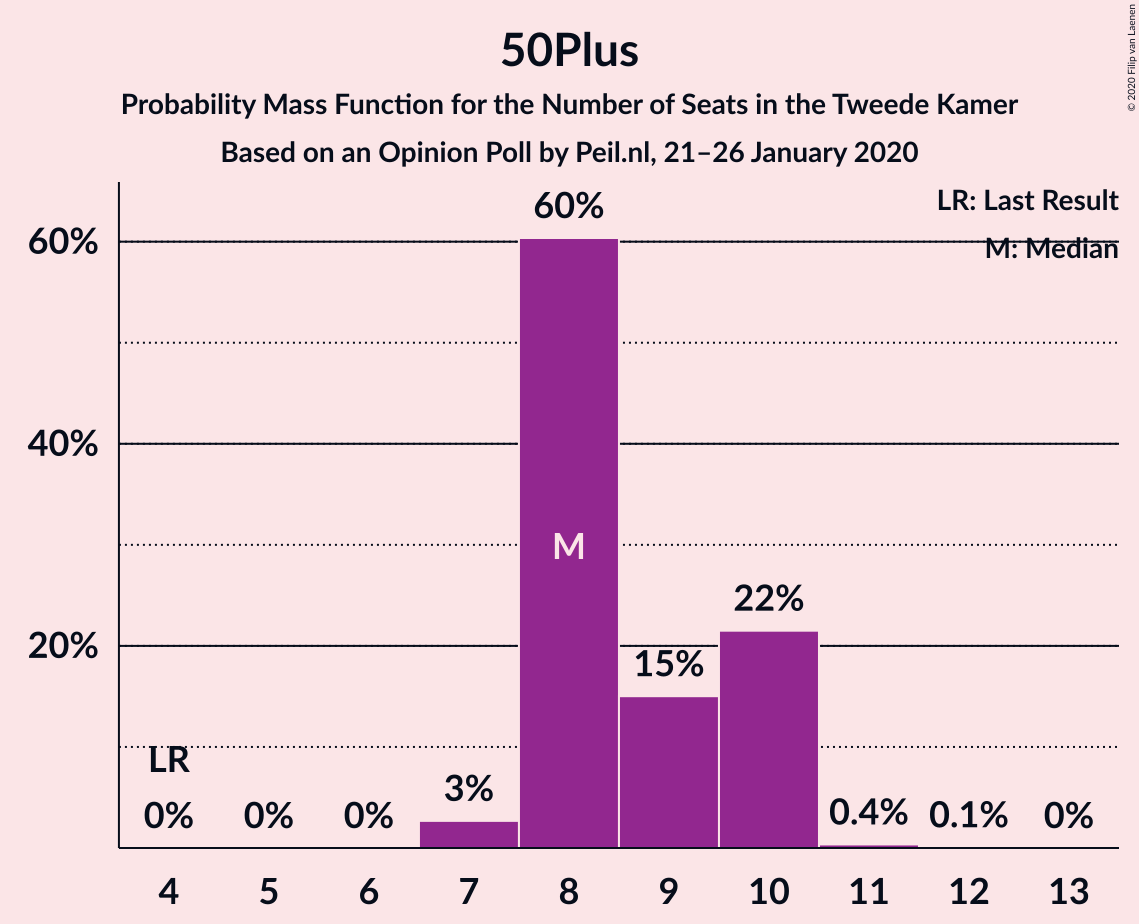
| Number of Seats | Probability | Accumulated | Special Marks |
|---|---|---|---|
| 4 | 0% | 100% | Last Result |
| 5 | 0% | 100% | |
| 6 | 0% | 100% | |
| 7 | 3% | 100% | |
| 8 | 60% | 97% | Median |
| 9 | 15% | 37% | |
| 10 | 22% | 22% | |
| 11 | 0.4% | 0.4% | |
| 12 | 0.1% | 0.1% | |
| 13 | 0% | 0% |
ChristenUnie
For a full overview of the results for this party, see the ChristenUnie page.
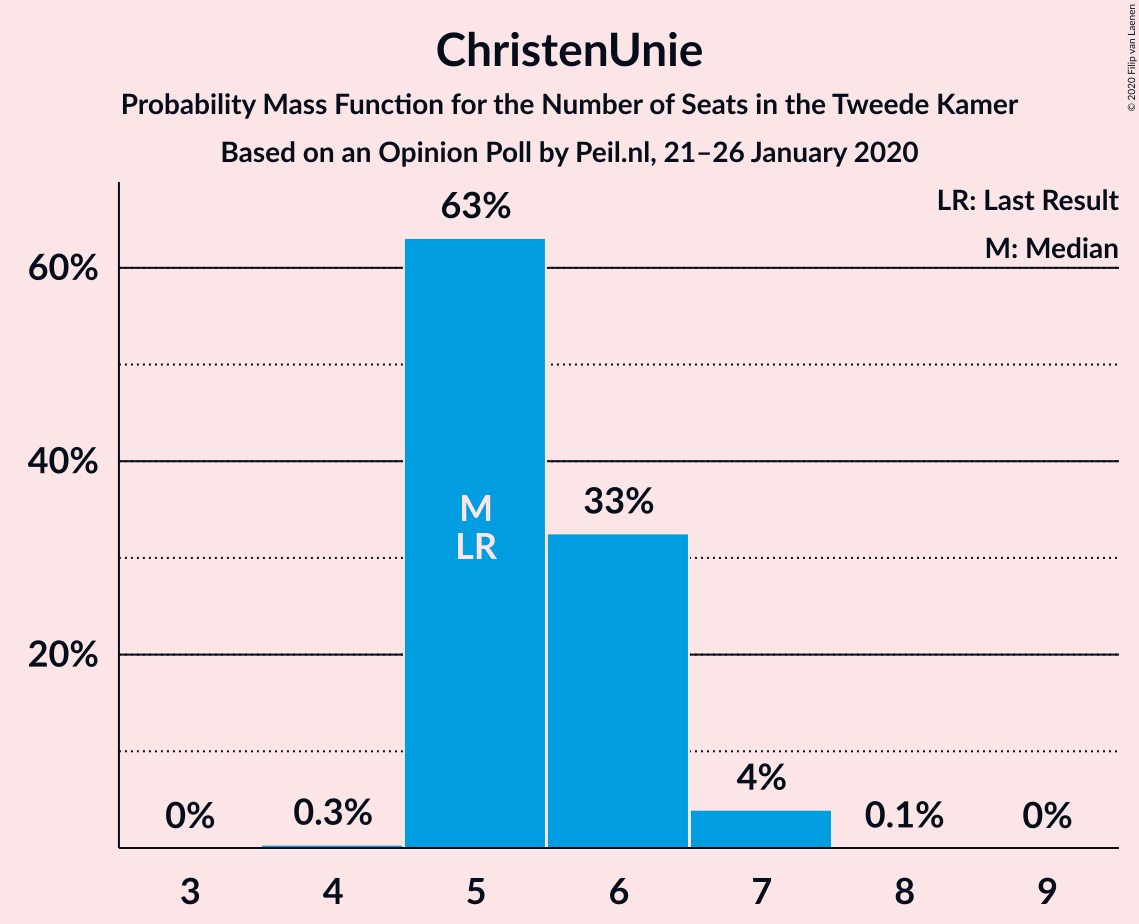
| Number of Seats | Probability | Accumulated | Special Marks |
|---|---|---|---|
| 4 | 0.3% | 100% | |
| 5 | 63% | 99.7% | Last Result, Median |
| 6 | 33% | 37% | |
| 7 | 4% | 4% | |
| 8 | 0.1% | 0.1% | |
| 9 | 0% | 0% |
Partij voor de Dieren
For a full overview of the results for this party, see the Partij voor de Dieren page.
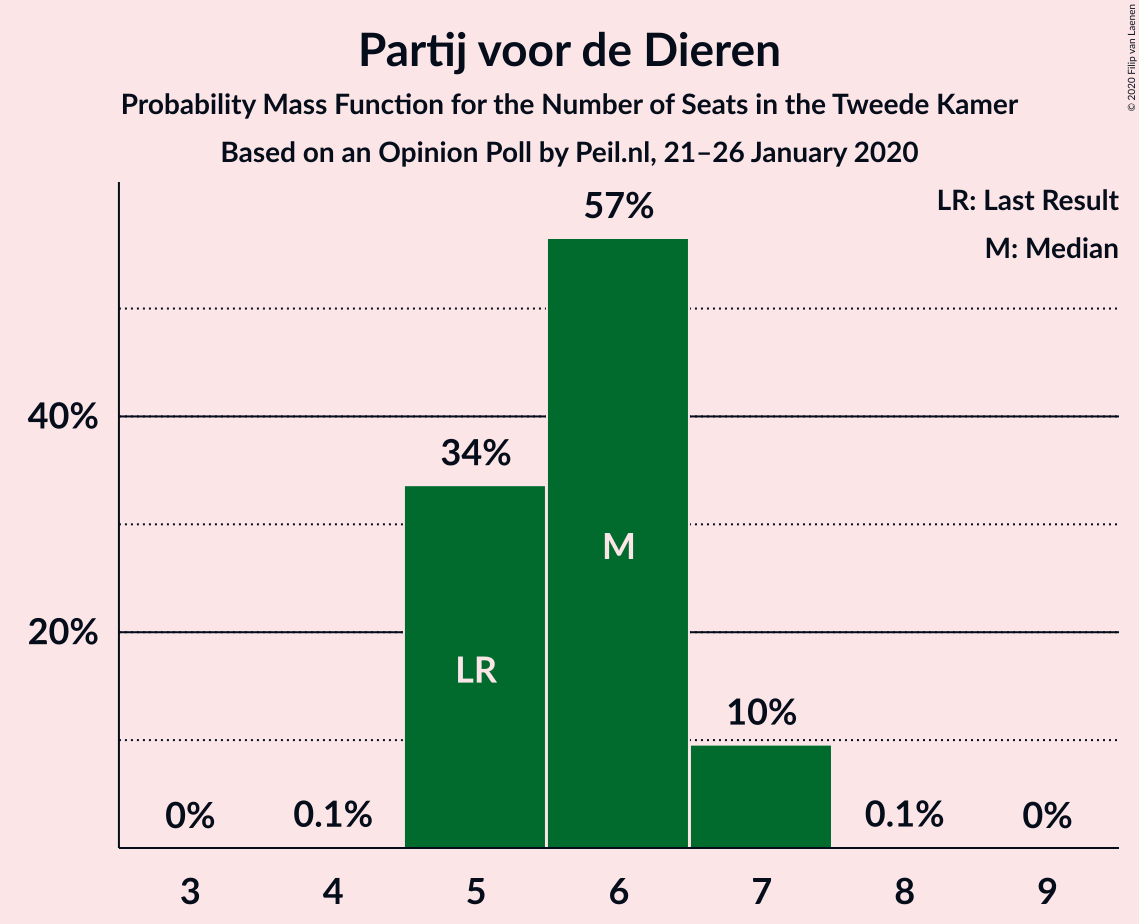
| Number of Seats | Probability | Accumulated | Special Marks |
|---|---|---|---|
| 4 | 0.1% | 100% | |
| 5 | 34% | 99.9% | Last Result |
| 6 | 57% | 66% | Median |
| 7 | 10% | 10% | |
| 8 | 0.1% | 0.1% | |
| 9 | 0% | 0% |
Staatkundig Gereformeerde Partij
For a full overview of the results for this party, see the Staatkundig Gereformeerde Partij page.
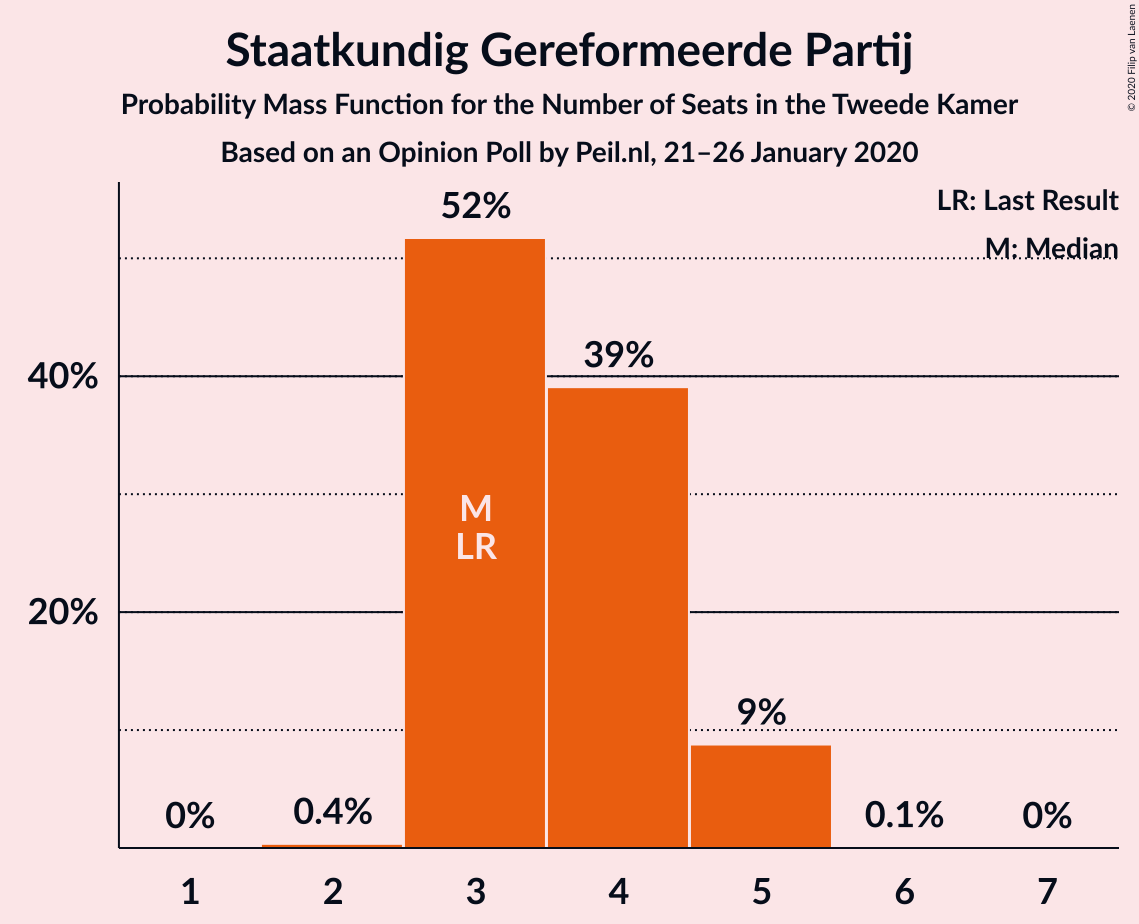
| Number of Seats | Probability | Accumulated | Special Marks |
|---|---|---|---|
| 2 | 0.4% | 100% | |
| 3 | 52% | 99.6% | Last Result, Median |
| 4 | 39% | 48% | |
| 5 | 9% | 9% | |
| 6 | 0.1% | 0.1% | |
| 7 | 0% | 0% |
DENK
For a full overview of the results for this party, see the DENK page.
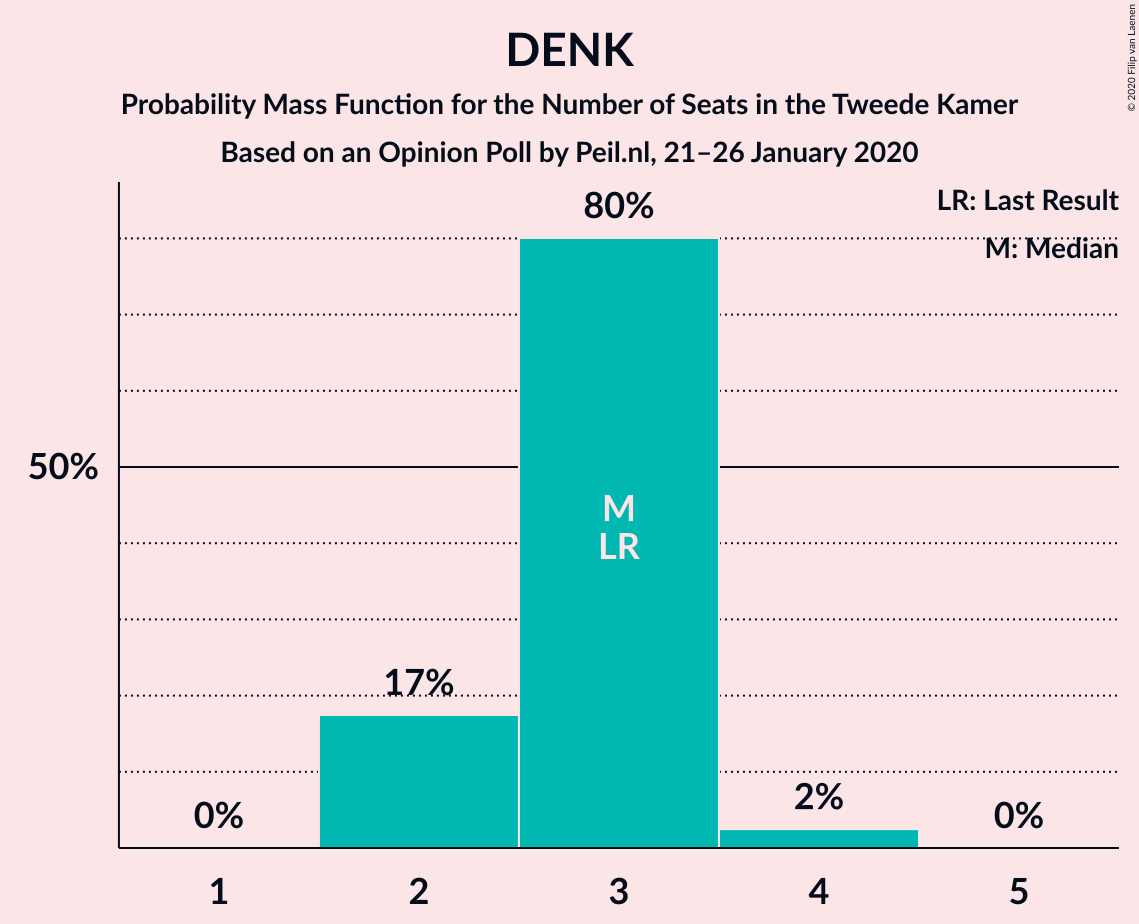
| Number of Seats | Probability | Accumulated | Special Marks |
|---|---|---|---|
| 2 | 17% | 100% | |
| 3 | 80% | 83% | Last Result, Median |
| 4 | 2% | 2% | |
| 5 | 0% | 0% |
Coalitions
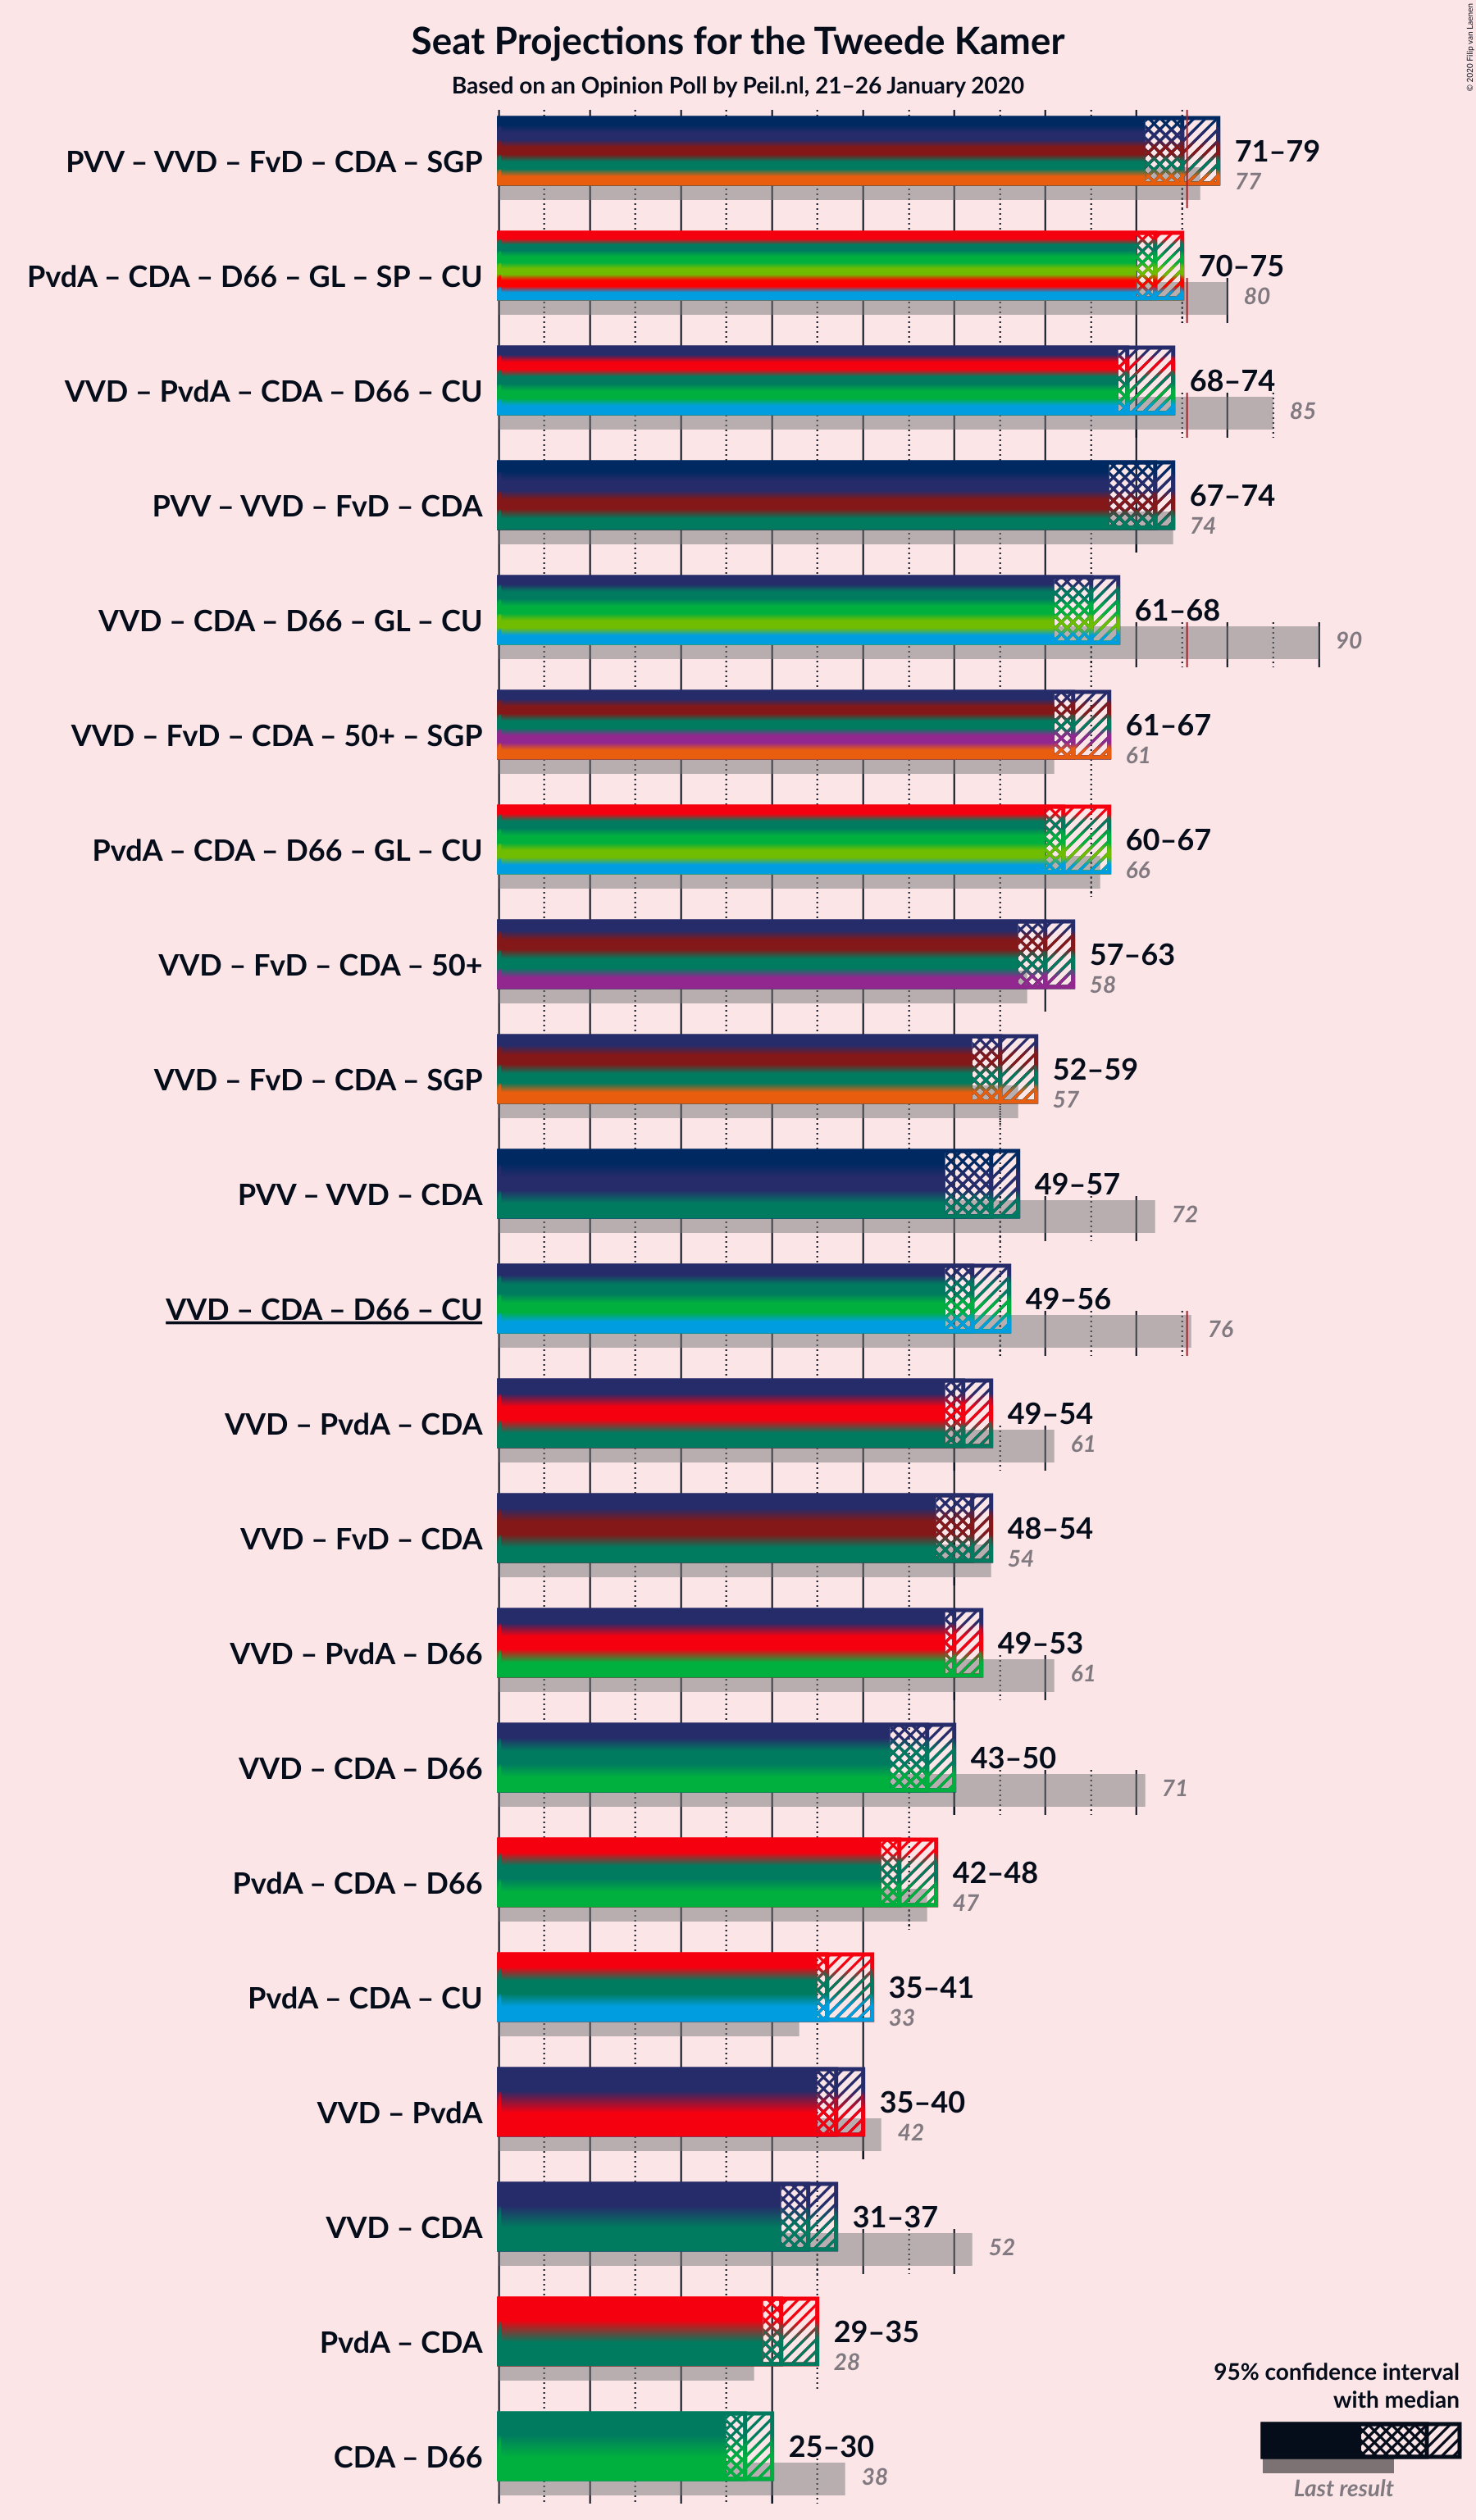
Confidence Intervals
| Coalition | Last Result | Median | Majority? | 80% Confidence Interval | 90% Confidence Interval | 95% Confidence Interval | 99% Confidence Interval |
|---|---|---|---|---|---|---|---|
| Partij voor de Vrijheid – Volkspartij voor Vrijheid en Democratie – Forum voor Democratie – Christen-Democratisch Appèl – Staatkundig Gereformeerde Partij | 77 | 75 | 12% | 72–76 | 71–77 | 71–79 | 69–79 |
| Partij van de Arbeid – Christen-Democratisch Appèl – Democraten 66 – GroenLinks – Socialistische Partij – ChristenUnie | 80 | 72 | 2% | 71–73 | 70–75 | 70–75 | 69–76 |
| Volkspartij voor Vrijheid en Democratie – Partij van de Arbeid – Christen-Democratisch Appèl – Democraten 66 – ChristenUnie | 85 | 69 | 0% | 69–73 | 68–73 | 68–74 | 67–75 |
| Partij voor de Vrijheid – Volkspartij voor Vrijheid en Democratie – Forum voor Democratie – Christen-Democratisch Appèl | 74 | 72 | 0% | 68–72 | 67–74 | 67–74 | 65–74 |
| Volkspartij voor Vrijheid en Democratie – Christen-Democratisch Appèl – Democraten 66 – GroenLinks – ChristenUnie | 90 | 65 | 0% | 63–67 | 61–68 | 61–68 | 61–68 |
| Volkspartij voor Vrijheid en Democratie – Forum voor Democratie – Christen-Democratisch Appèl – 50Plus – Staatkundig Gereformeerde Partij | 61 | 63 | 0% | 62–66 | 61–67 | 61–67 | 60–67 |
| Partij van de Arbeid – Christen-Democratisch Appèl – Democraten 66 – GroenLinks – ChristenUnie | 66 | 62 | 0% | 62–65 | 61–66 | 60–67 | 60–67 |
| Volkspartij voor Vrijheid en Democratie – Forum voor Democratie – Christen-Democratisch Appèl – 50Plus | 58 | 60 | 0% | 58–62 | 57–62 | 57–63 | 57–63 |
| Volkspartij voor Vrijheid en Democratie – Forum voor Democratie – Christen-Democratisch Appèl – Staatkundig Gereformeerde Partij | 57 | 55 | 0% | 53–56 | 52–58 | 52–59 | 51–59 |
| Partij voor de Vrijheid – Volkspartij voor Vrijheid en Democratie – Christen-Democratisch Appèl | 72 | 54 | 0% | 51–55 | 50–56 | 49–57 | 47–57 |
| Volkspartij voor Vrijheid en Democratie – Christen-Democratisch Appèl – Democraten 66 – ChristenUnie | 76 | 52 | 0% | 51–55 | 50–55 | 49–56 | 48–56 |
| Volkspartij voor Vrijheid en Democratie – Partij van de Arbeid – Christen-Democratisch Appèl | 61 | 51 | 0% | 50–54 | 49–54 | 49–54 | 49–55 |
| Volkspartij voor Vrijheid en Democratie – Forum voor Democratie – Christen-Democratisch Appèl | 54 | 52 | 0% | 49–53 | 49–54 | 48–54 | 48–54 |
| Volkspartij voor Vrijheid en Democratie – Partij van de Arbeid – Democraten 66 | 61 | 50 | 0% | 49–52 | 49–53 | 49–53 | 47–55 |
| Volkspartij voor Vrijheid en Democratie – Christen-Democratisch Appèl – Democraten 66 | 71 | 47 | 0% | 46–49 | 44–50 | 43–50 | 43–50 |
| Partij van de Arbeid – Christen-Democratisch Appèl – Democraten 66 | 47 | 44 | 0% | 44–47 | 43–48 | 42–48 | 41–49 |
| Partij van de Arbeid – Christen-Democratisch Appèl – ChristenUnie | 33 | 36 | 0% | 36–40 | 35–40 | 35–41 | 35–41 |
| Volkspartij voor Vrijheid en Democratie – Partij van de Arbeid | 42 | 37 | 0% | 37–39 | 36–40 | 35–40 | 35–41 |
| Volkspartij voor Vrijheid en Democratie – Christen-Democratisch Appèl | 52 | 34 | 0% | 32–35 | 32–37 | 31–37 | 30–37 |
| Partij van de Arbeid – Christen-Democratisch Appèl | 28 | 31 | 0% | 31–35 | 29–35 | 29–35 | 29–35 |
| Christen-Democratisch Appèl – Democraten 66 | 38 | 27 | 0% | 26–29 | 25–30 | 25–30 | 25–30 |
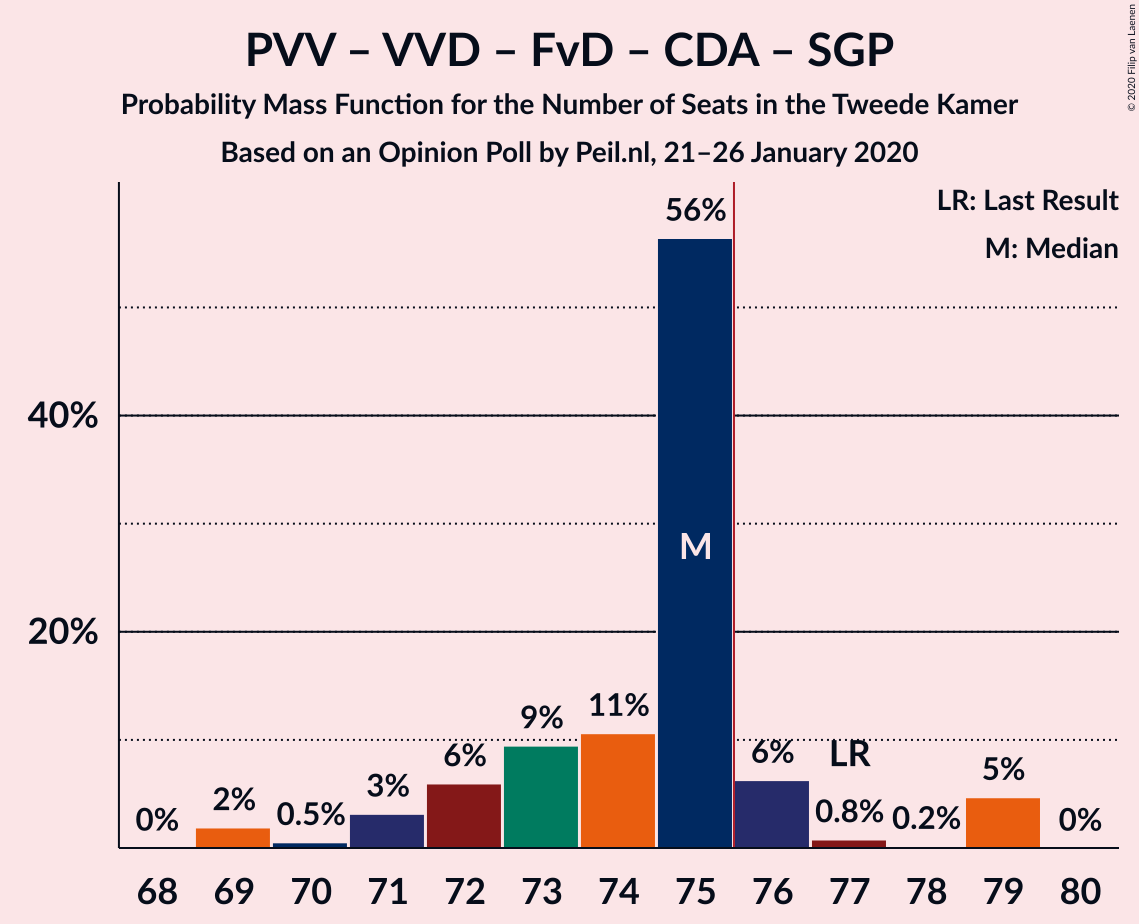
Partij voor de Vrijheid – Volkspartij voor Vrijheid en Democratie – Forum voor Democratie – Christen-Democratisch Appèl – Staatkundig Gereformeerde Partij
| Number of Seats | Probability | Accumulated | Special Marks |
|---|---|---|---|
| 69 | 2% | 100% | |
| 70 | 0.5% | 98% | |
| 71 | 3% | 98% | |
| 72 | 6% | 94% | |
| 73 | 9% | 88% | |
| 74 | 11% | 79% | |
| 75 | 56% | 68% | Median |
| 76 | 6% | 12% | Majority |
| 77 | 0.8% | 6% | Last Result |
| 78 | 0.2% | 5% | |
| 79 | 5% | 5% | |
| 80 | 0% | 0% |
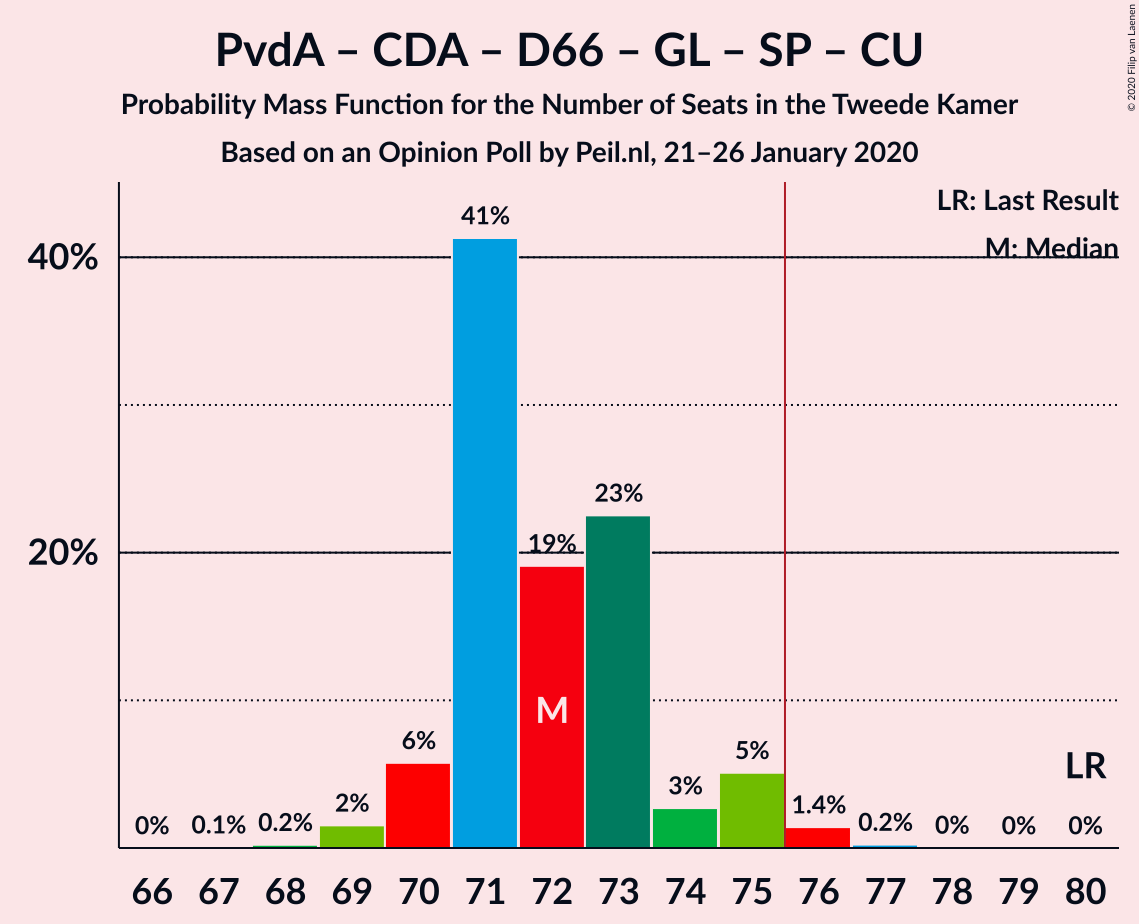
Partij van de Arbeid – Christen-Democratisch Appèl – Democraten 66 – GroenLinks – Socialistische Partij – ChristenUnie
| Number of Seats | Probability | Accumulated | Special Marks |
|---|---|---|---|
| 67 | 0.1% | 100% | |
| 68 | 0.2% | 99.9% | |
| 69 | 2% | 99.7% | |
| 70 | 6% | 98% | |
| 71 | 41% | 92% | Median |
| 72 | 19% | 51% | |
| 73 | 23% | 32% | |
| 74 | 3% | 9% | |
| 75 | 5% | 7% | |
| 76 | 1.4% | 2% | Majority |
| 77 | 0.2% | 0.3% | |
| 78 | 0% | 0% | |
| 79 | 0% | 0% | |
| 80 | 0% | 0% | Last Result |
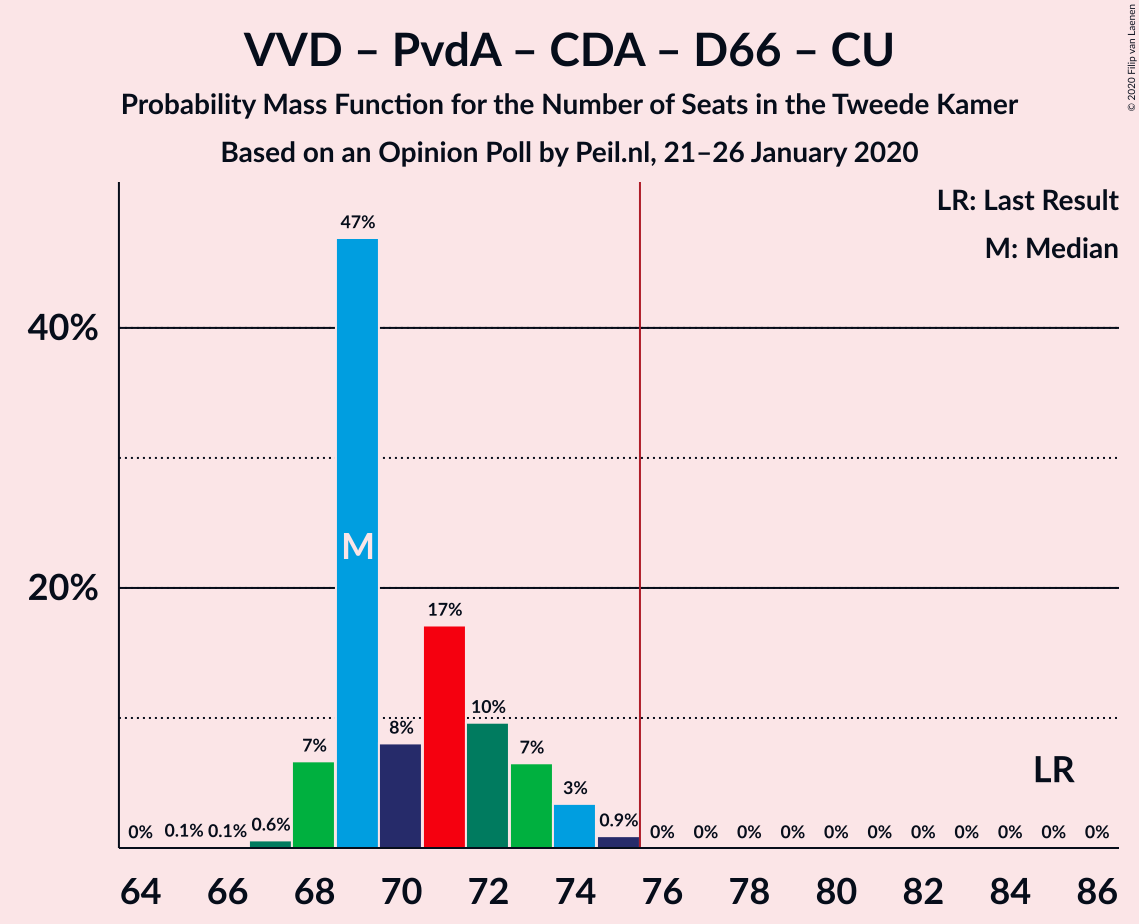
Volkspartij voor Vrijheid en Democratie – Partij van de Arbeid – Christen-Democratisch Appèl – Democraten 66 – ChristenUnie
| Number of Seats | Probability | Accumulated | Special Marks |
|---|---|---|---|
| 65 | 0.1% | 100% | |
| 66 | 0.1% | 99.9% | |
| 67 | 0.6% | 99.8% | |
| 68 | 7% | 99.2% | |
| 69 | 47% | 93% | Median |
| 70 | 8% | 46% | |
| 71 | 17% | 38% | |
| 72 | 10% | 20% | |
| 73 | 7% | 11% | |
| 74 | 3% | 4% | |
| 75 | 0.9% | 0.9% | |
| 76 | 0% | 0% | Majority |
| 77 | 0% | 0% | |
| 78 | 0% | 0% | |
| 79 | 0% | 0% | |
| 80 | 0% | 0% | |
| 81 | 0% | 0% | |
| 82 | 0% | 0% | |
| 83 | 0% | 0% | |
| 84 | 0% | 0% | |
| 85 | 0% | 0% | Last Result |
Partij voor de Vrijheid – Volkspartij voor Vrijheid en Democratie – Forum voor Democratie – Christen-Democratisch Appèl
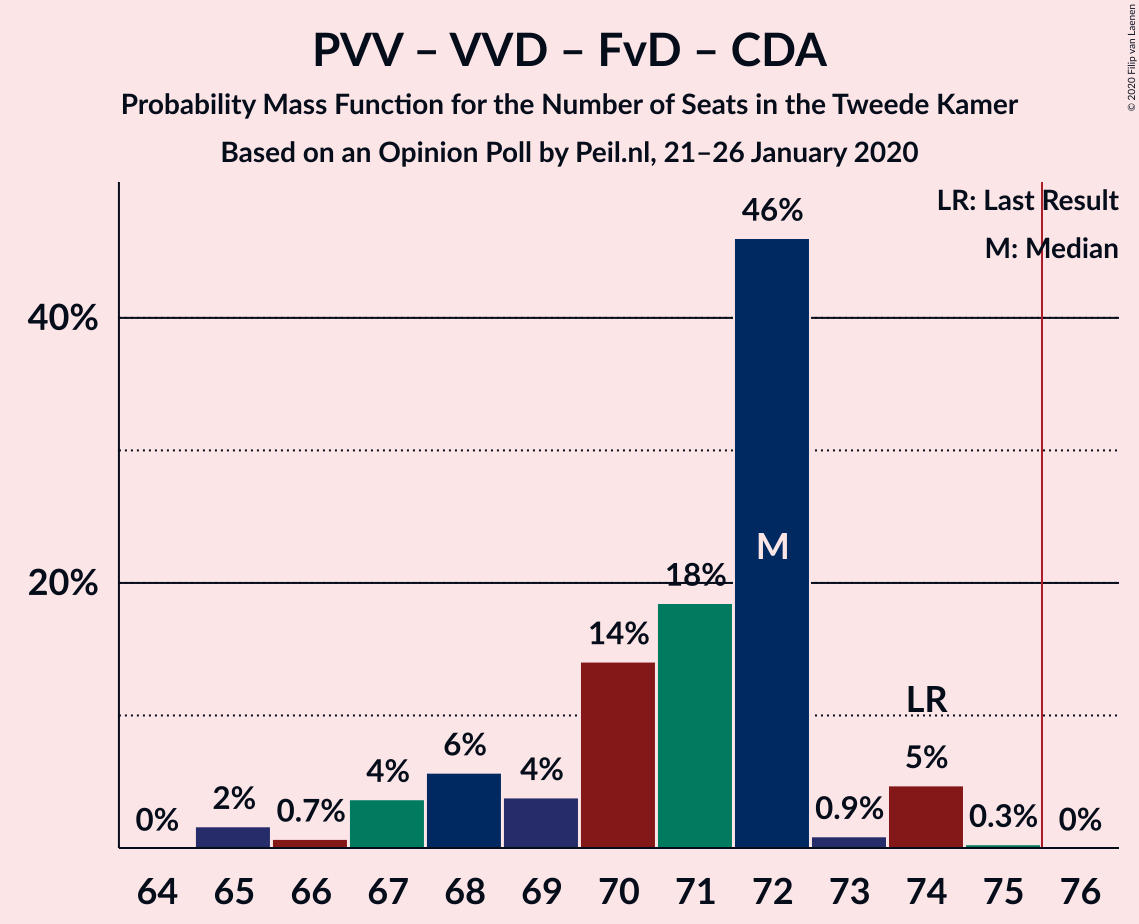
| Number of Seats | Probability | Accumulated | Special Marks |
|---|---|---|---|
| 65 | 2% | 100% | |
| 66 | 0.7% | 98% | |
| 67 | 4% | 98% | |
| 68 | 6% | 94% | |
| 69 | 4% | 88% | |
| 70 | 14% | 84% | |
| 71 | 18% | 70% | |
| 72 | 46% | 52% | Median |
| 73 | 0.9% | 6% | |
| 74 | 5% | 5% | Last Result |
| 75 | 0.3% | 0.3% | |
| 76 | 0% | 0% | Majority |
Volkspartij voor Vrijheid en Democratie – Christen-Democratisch Appèl – Democraten 66 – GroenLinks – ChristenUnie
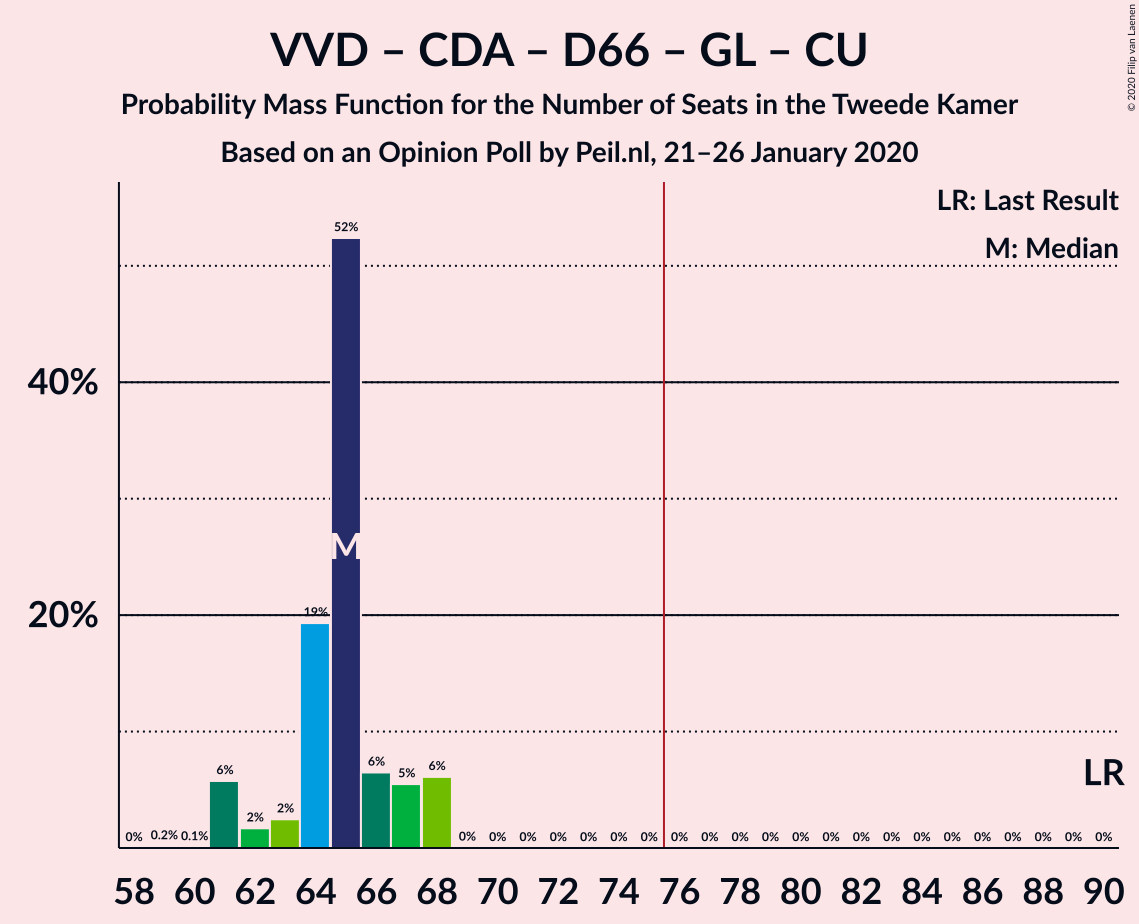
| Number of Seats | Probability | Accumulated | Special Marks |
|---|---|---|---|
| 59 | 0.2% | 100% | |
| 60 | 0.1% | 99.8% | |
| 61 | 6% | 99.8% | |
| 62 | 2% | 94% | |
| 63 | 2% | 92% | |
| 64 | 19% | 90% | |
| 65 | 52% | 71% | Median |
| 66 | 6% | 18% | |
| 67 | 5% | 12% | |
| 68 | 6% | 6% | |
| 69 | 0% | 0.1% | |
| 70 | 0% | 0% | |
| 71 | 0% | 0% | |
| 72 | 0% | 0% | |
| 73 | 0% | 0% | |
| 74 | 0% | 0% | |
| 75 | 0% | 0% | |
| 76 | 0% | 0% | Majority |
| 77 | 0% | 0% | |
| 78 | 0% | 0% | |
| 79 | 0% | 0% | |
| 80 | 0% | 0% | |
| 81 | 0% | 0% | |
| 82 | 0% | 0% | |
| 83 | 0% | 0% | |
| 84 | 0% | 0% | |
| 85 | 0% | 0% | |
| 86 | 0% | 0% | |
| 87 | 0% | 0% | |
| 88 | 0% | 0% | |
| 89 | 0% | 0% | |
| 90 | 0% | 0% | Last Result |
Volkspartij voor Vrijheid en Democratie – Forum voor Democratie – Christen-Democratisch Appèl – 50Plus – Staatkundig Gereformeerde Partij
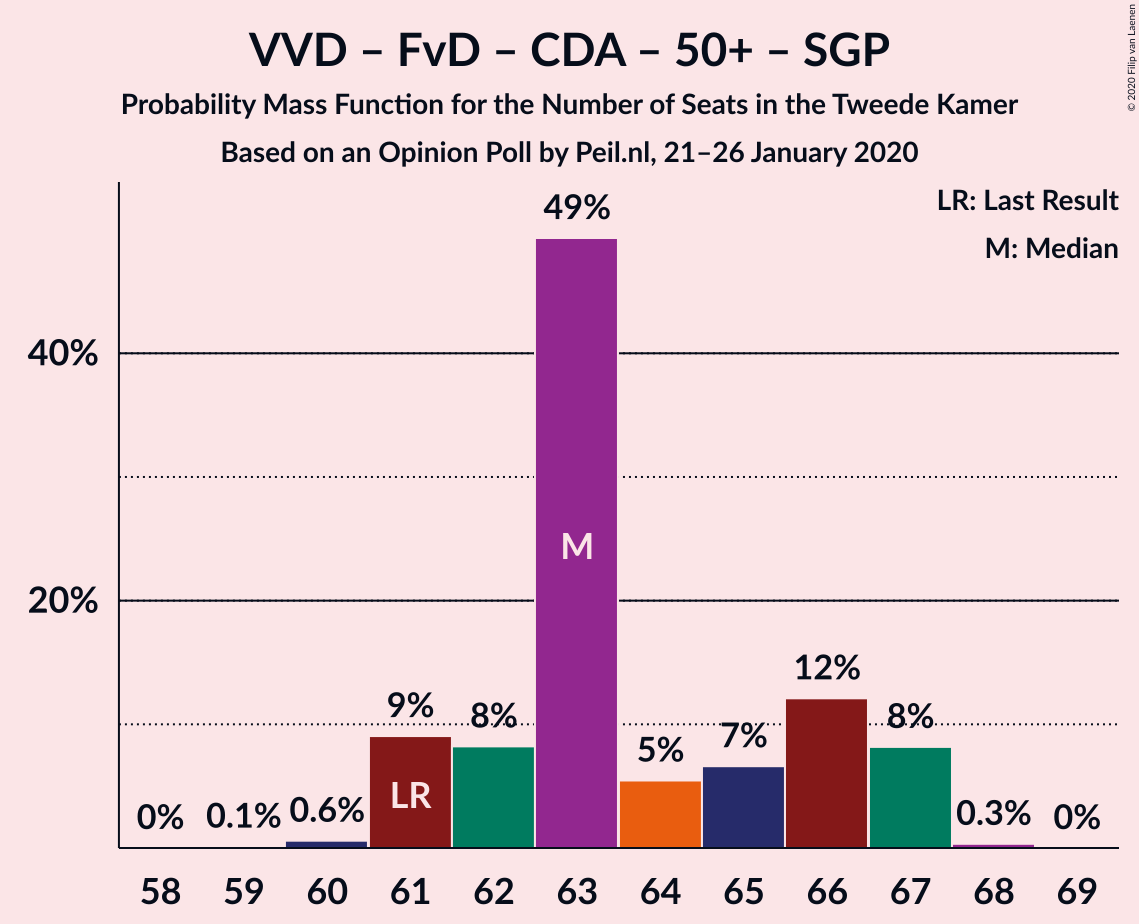
| Number of Seats | Probability | Accumulated | Special Marks |
|---|---|---|---|
| 59 | 0.1% | 100% | |
| 60 | 0.6% | 99.9% | |
| 61 | 9% | 99.3% | Last Result |
| 62 | 8% | 90% | |
| 63 | 49% | 82% | Median |
| 64 | 5% | 33% | |
| 65 | 7% | 27% | |
| 66 | 12% | 21% | |
| 67 | 8% | 9% | |
| 68 | 0.3% | 0.3% | |
| 69 | 0% | 0% |
Partij van de Arbeid – Christen-Democratisch Appèl – Democraten 66 – GroenLinks – ChristenUnie
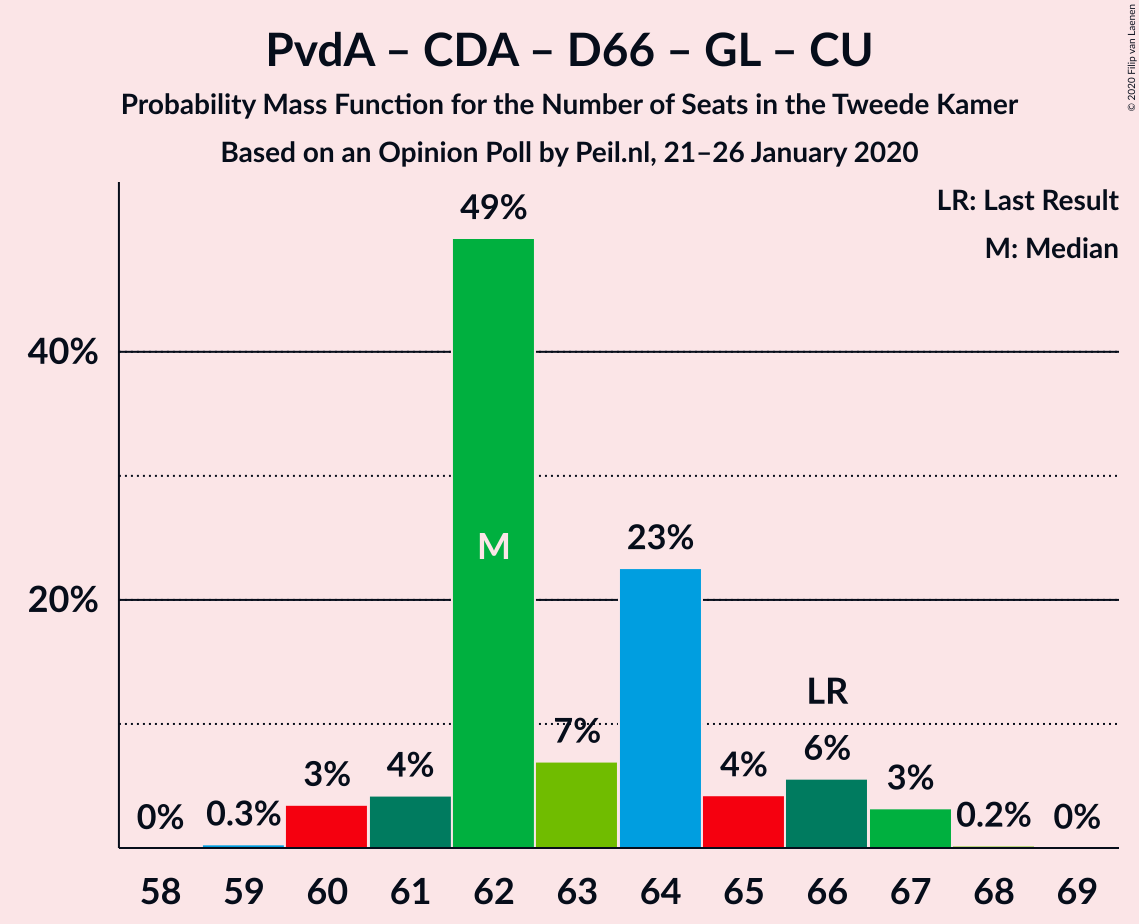
| Number of Seats | Probability | Accumulated | Special Marks |
|---|---|---|---|
| 59 | 0.3% | 100% | |
| 60 | 3% | 99.7% | |
| 61 | 4% | 96% | |
| 62 | 49% | 92% | Median |
| 63 | 7% | 43% | |
| 64 | 23% | 36% | |
| 65 | 4% | 13% | |
| 66 | 6% | 9% | Last Result |
| 67 | 3% | 3% | |
| 68 | 0.2% | 0.2% | |
| 69 | 0% | 0% |
Volkspartij voor Vrijheid en Democratie – Forum voor Democratie – Christen-Democratisch Appèl – 50Plus
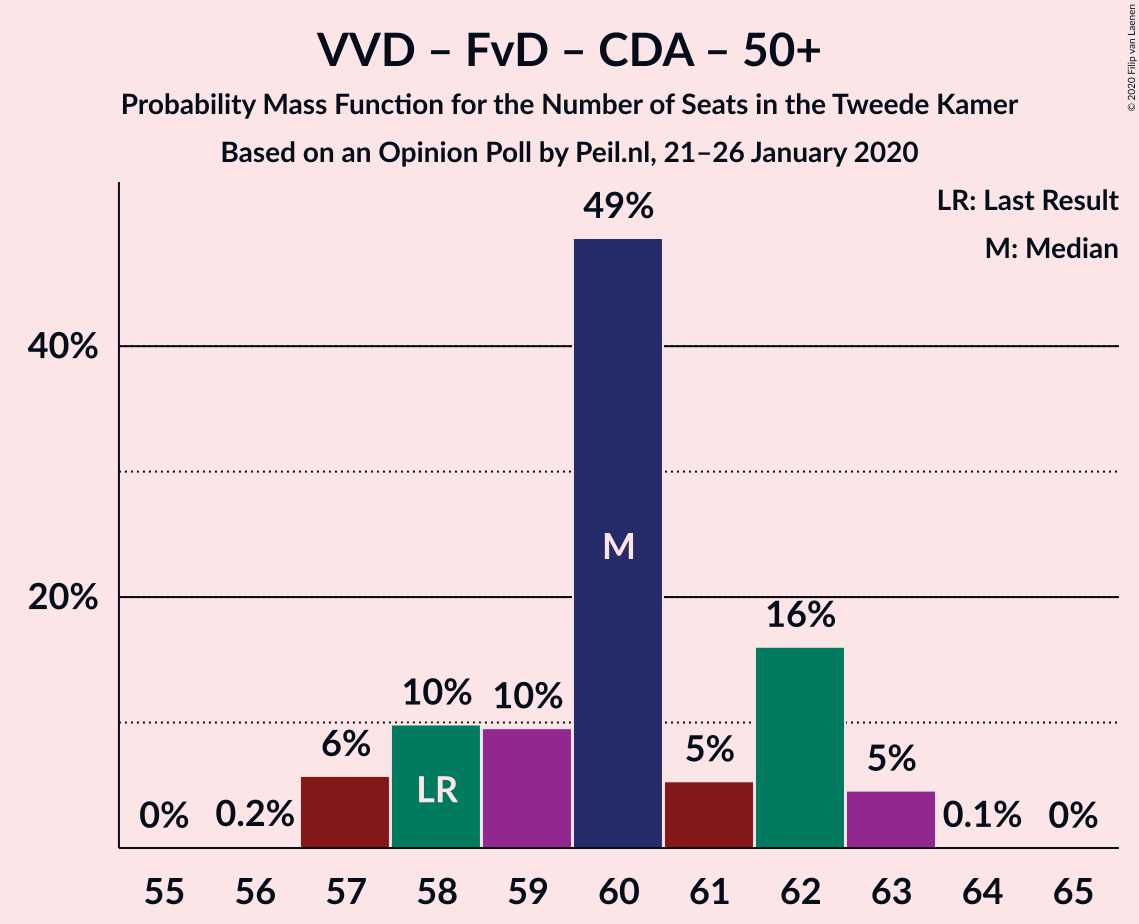
| Number of Seats | Probability | Accumulated | Special Marks |
|---|---|---|---|
| 56 | 0.2% | 100% | |
| 57 | 6% | 99.8% | |
| 58 | 10% | 94% | Last Result |
| 59 | 10% | 84% | |
| 60 | 49% | 75% | Median |
| 61 | 5% | 26% | |
| 62 | 16% | 21% | |
| 63 | 5% | 5% | |
| 64 | 0.1% | 0.1% | |
| 65 | 0% | 0% |
Volkspartij voor Vrijheid en Democratie – Forum voor Democratie – Christen-Democratisch Appèl – Staatkundig Gereformeerde Partij
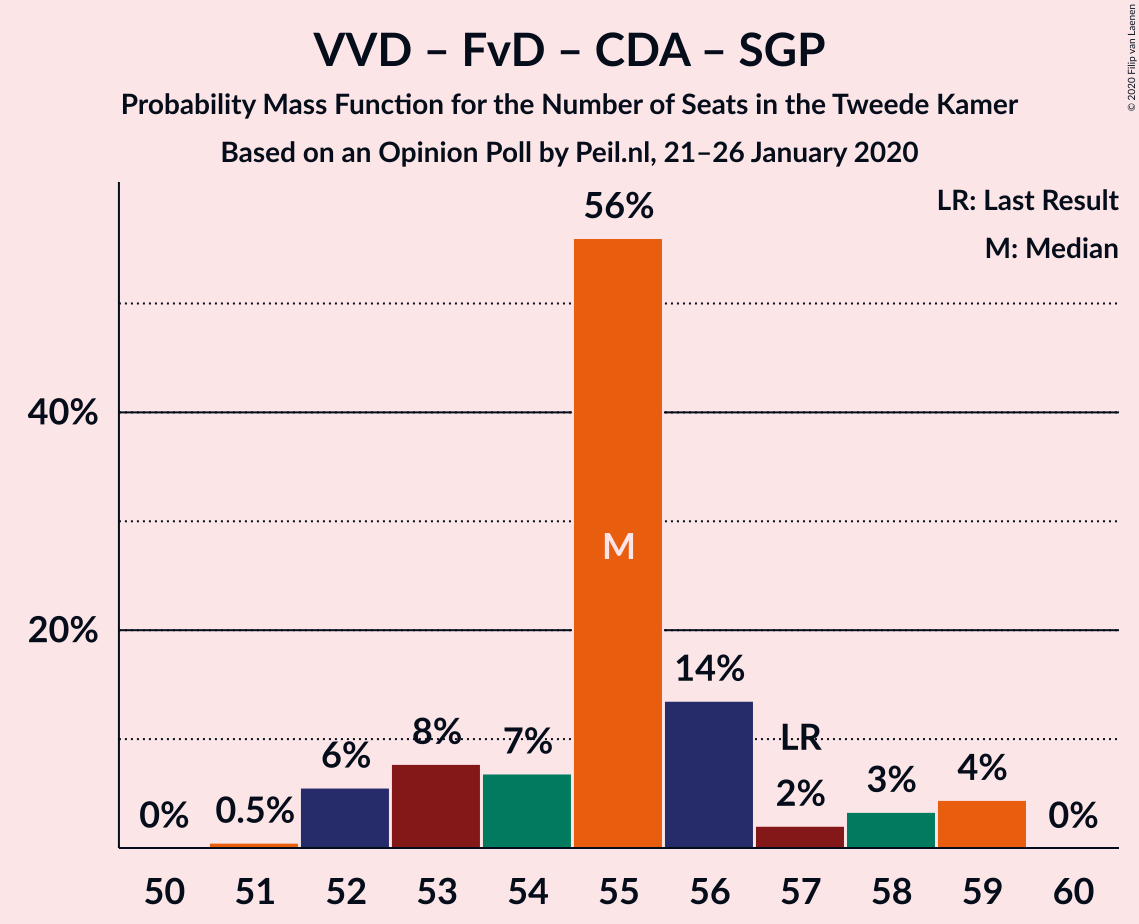
| Number of Seats | Probability | Accumulated | Special Marks |
|---|---|---|---|
| 50 | 0% | 100% | |
| 51 | 0.5% | 99.9% | |
| 52 | 6% | 99.5% | |
| 53 | 8% | 94% | |
| 54 | 7% | 86% | |
| 55 | 56% | 79% | Median |
| 56 | 14% | 23% | |
| 57 | 2% | 10% | Last Result |
| 58 | 3% | 8% | |
| 59 | 4% | 4% | |
| 60 | 0% | 0% |
Partij voor de Vrijheid – Volkspartij voor Vrijheid en Democratie – Christen-Democratisch Appèl
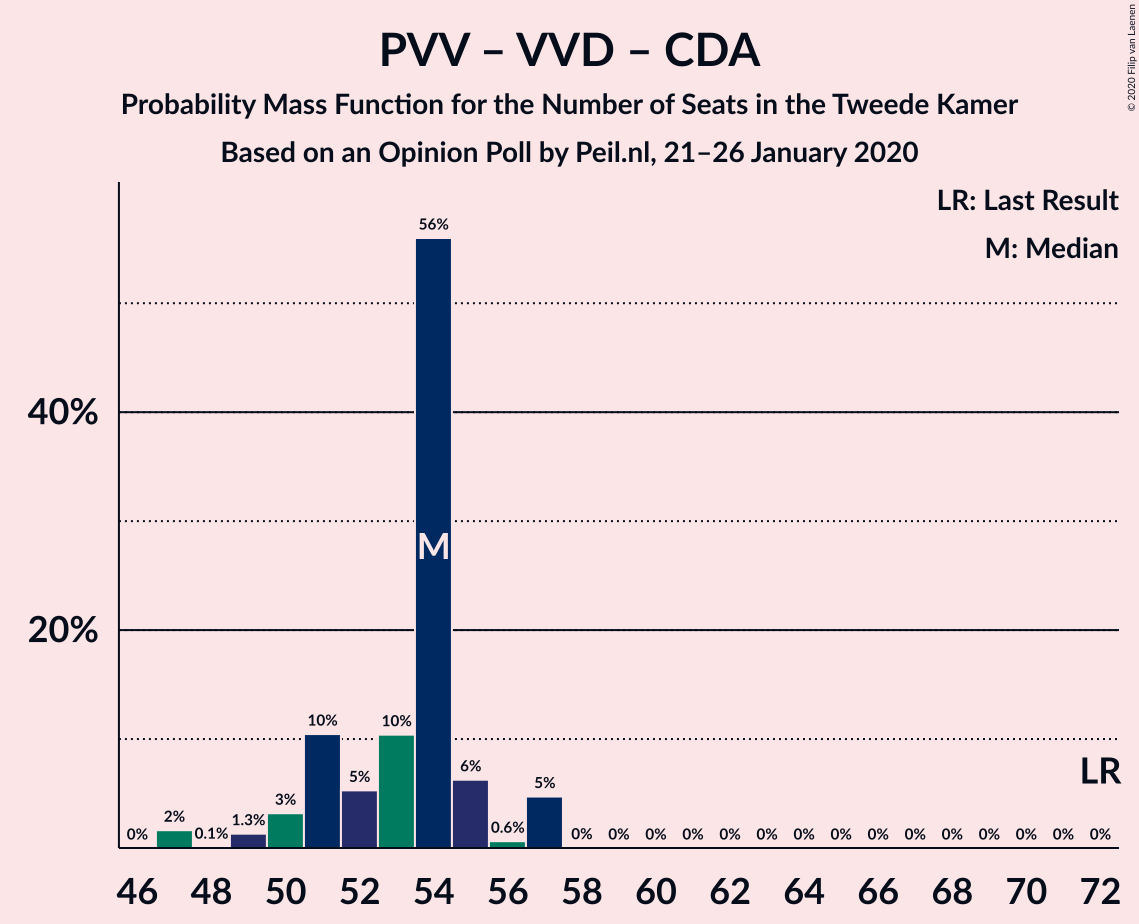
| Number of Seats | Probability | Accumulated | Special Marks |
|---|---|---|---|
| 47 | 2% | 100% | |
| 48 | 0.1% | 98% | |
| 49 | 1.3% | 98% | |
| 50 | 3% | 97% | |
| 51 | 10% | 94% | |
| 52 | 5% | 83% | |
| 53 | 10% | 78% | |
| 54 | 56% | 68% | Median |
| 55 | 6% | 12% | |
| 56 | 0.6% | 5% | |
| 57 | 5% | 5% | |
| 58 | 0% | 0% | |
| 59 | 0% | 0% | |
| 60 | 0% | 0% | |
| 61 | 0% | 0% | |
| 62 | 0% | 0% | |
| 63 | 0% | 0% | |
| 64 | 0% | 0% | |
| 65 | 0% | 0% | |
| 66 | 0% | 0% | |
| 67 | 0% | 0% | |
| 68 | 0% | 0% | |
| 69 | 0% | 0% | |
| 70 | 0% | 0% | |
| 71 | 0% | 0% | |
| 72 | 0% | 0% | Last Result |
Volkspartij voor Vrijheid en Democratie – Christen-Democratisch Appèl – Democraten 66 – ChristenUnie
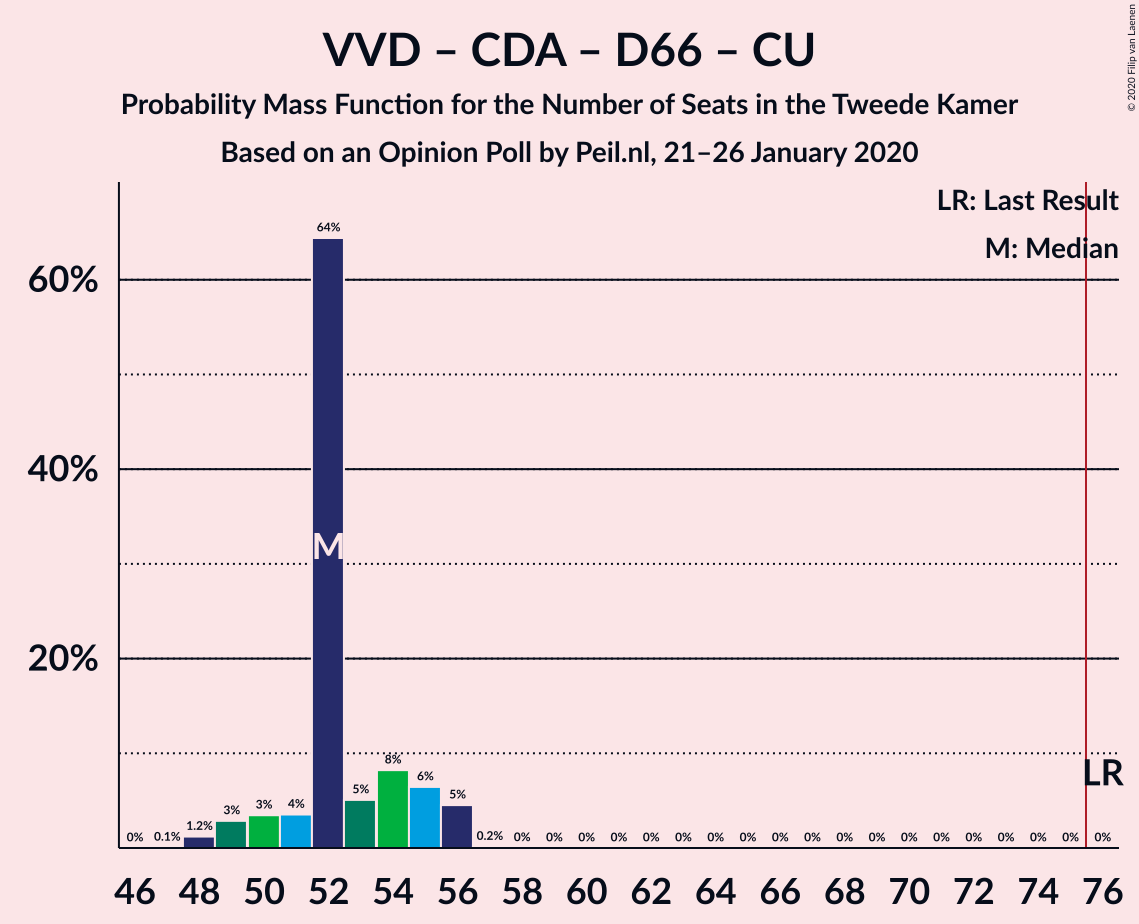
| Number of Seats | Probability | Accumulated | Special Marks |
|---|---|---|---|
| 47 | 0.1% | 100% | |
| 48 | 1.2% | 99.9% | |
| 49 | 3% | 98.7% | |
| 50 | 3% | 96% | |
| 51 | 4% | 92% | |
| 52 | 64% | 89% | Median |
| 53 | 5% | 24% | |
| 54 | 8% | 19% | |
| 55 | 6% | 11% | |
| 56 | 5% | 5% | |
| 57 | 0.2% | 0.2% | |
| 58 | 0% | 0% | |
| 59 | 0% | 0% | |
| 60 | 0% | 0% | |
| 61 | 0% | 0% | |
| 62 | 0% | 0% | |
| 63 | 0% | 0% | |
| 64 | 0% | 0% | |
| 65 | 0% | 0% | |
| 66 | 0% | 0% | |
| 67 | 0% | 0% | |
| 68 | 0% | 0% | |
| 69 | 0% | 0% | |
| 70 | 0% | 0% | |
| 71 | 0% | 0% | |
| 72 | 0% | 0% | |
| 73 | 0% | 0% | |
| 74 | 0% | 0% | |
| 75 | 0% | 0% | |
| 76 | 0% | 0% | Last Result, Majority |
Volkspartij voor Vrijheid en Democratie – Partij van de Arbeid – Christen-Democratisch Appèl
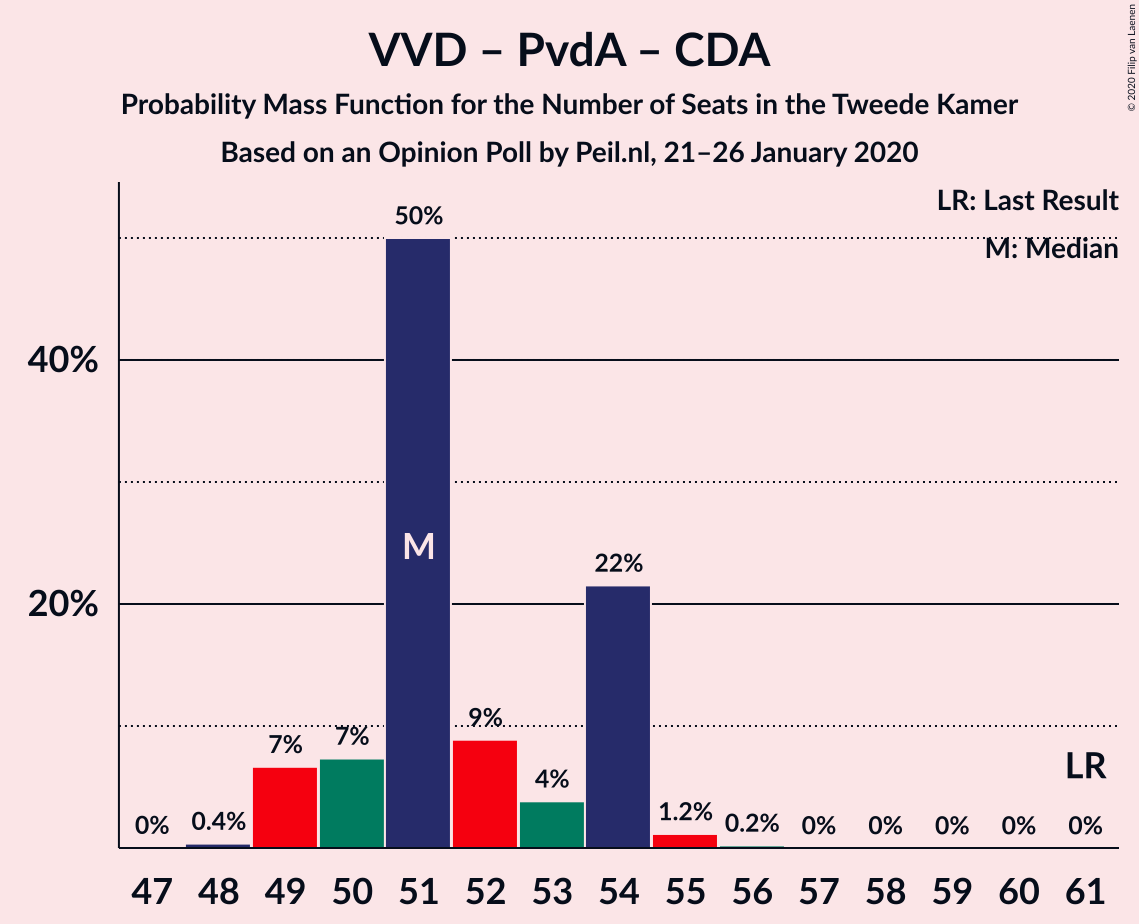
| Number of Seats | Probability | Accumulated | Special Marks |
|---|---|---|---|
| 48 | 0.4% | 100% | |
| 49 | 7% | 99.6% | |
| 50 | 7% | 93% | |
| 51 | 50% | 86% | Median |
| 52 | 9% | 36% | |
| 53 | 4% | 27% | |
| 54 | 22% | 23% | |
| 55 | 1.2% | 1.4% | |
| 56 | 0.2% | 0.2% | |
| 57 | 0% | 0% | |
| 58 | 0% | 0% | |
| 59 | 0% | 0% | |
| 60 | 0% | 0% | |
| 61 | 0% | 0% | Last Result |
Volkspartij voor Vrijheid en Democratie – Forum voor Democratie – Christen-Democratisch Appèl
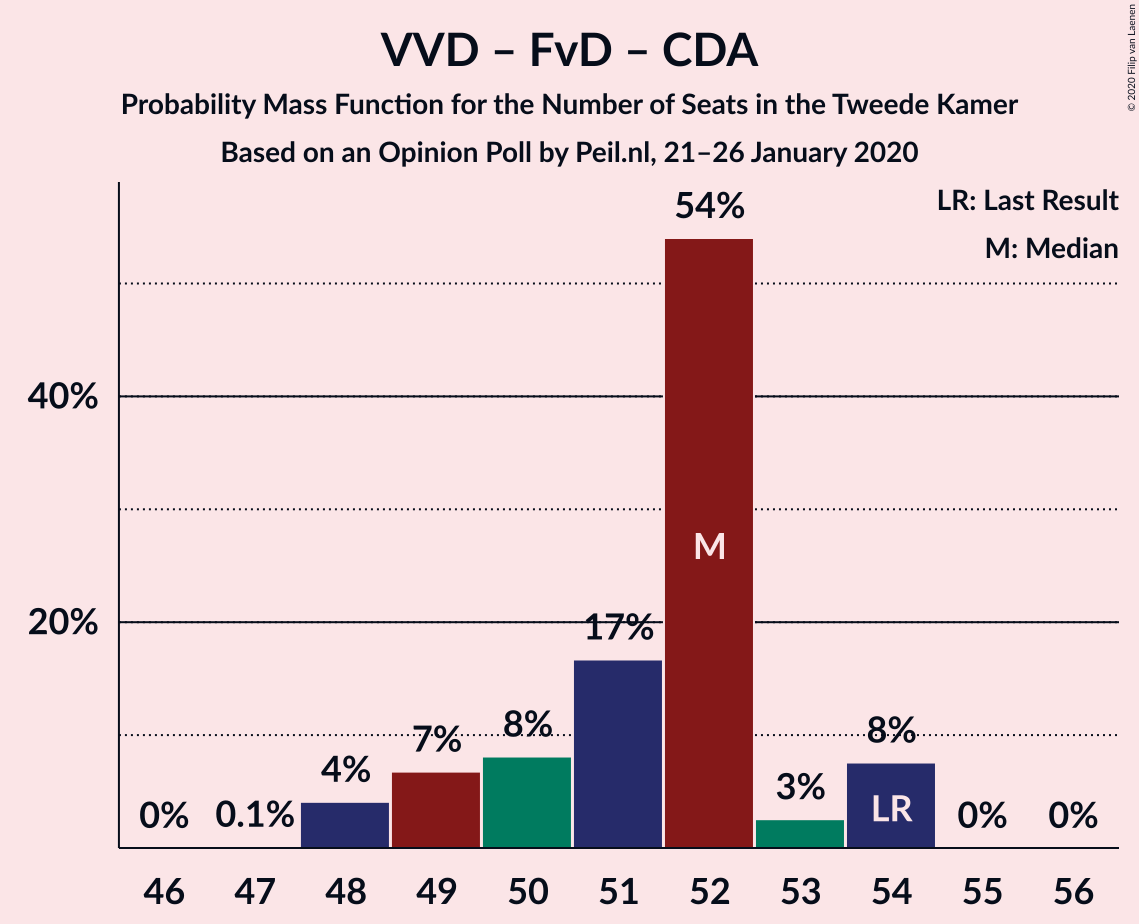
| Number of Seats | Probability | Accumulated | Special Marks |
|---|---|---|---|
| 47 | 0.1% | 100% | |
| 48 | 4% | 99.9% | |
| 49 | 7% | 96% | |
| 50 | 8% | 89% | |
| 51 | 17% | 81% | |
| 52 | 54% | 64% | Median |
| 53 | 3% | 10% | |
| 54 | 8% | 8% | Last Result |
| 55 | 0% | 0.1% | |
| 56 | 0% | 0% |
Volkspartij voor Vrijheid en Democratie – Partij van de Arbeid – Democraten 66
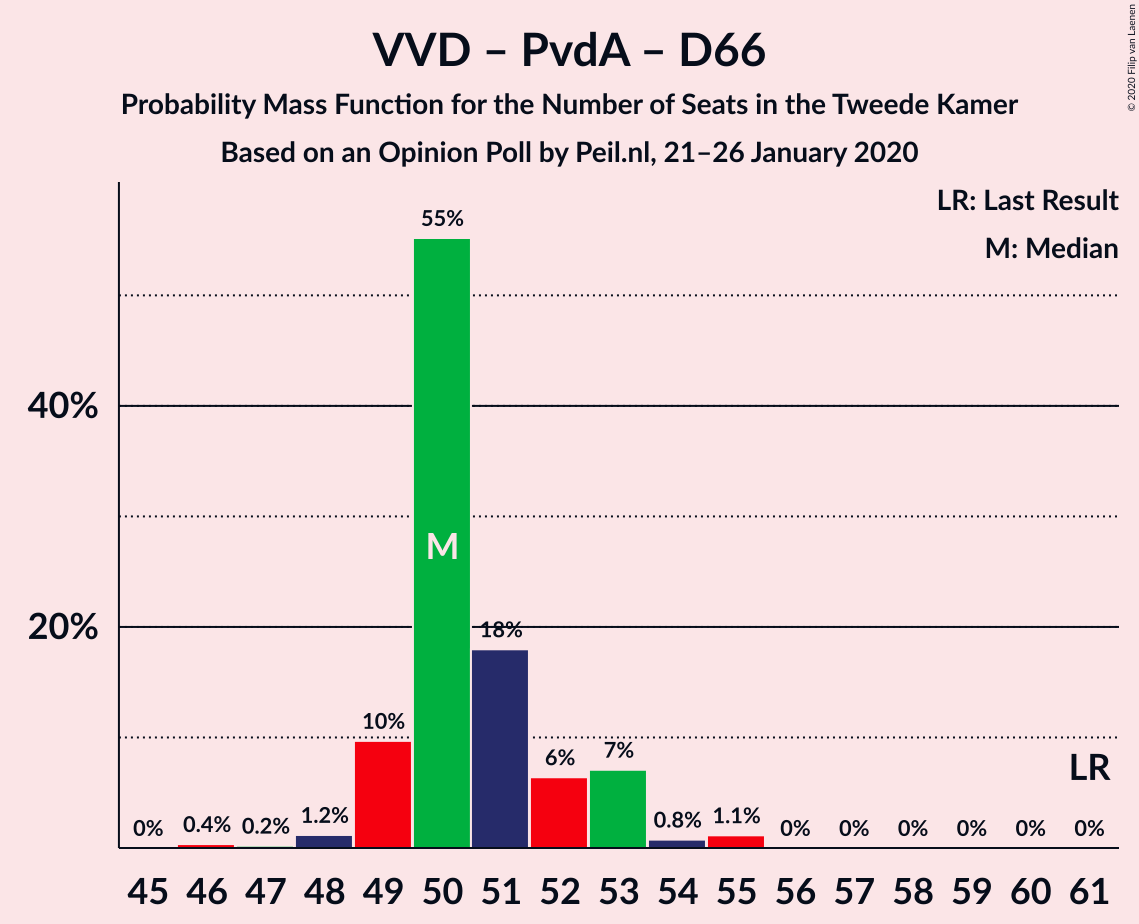
| Number of Seats | Probability | Accumulated | Special Marks |
|---|---|---|---|
| 46 | 0.4% | 100% | |
| 47 | 0.2% | 99.6% | |
| 48 | 1.2% | 99.4% | |
| 49 | 10% | 98% | |
| 50 | 55% | 89% | Median |
| 51 | 18% | 33% | |
| 52 | 6% | 15% | |
| 53 | 7% | 9% | |
| 54 | 0.8% | 2% | |
| 55 | 1.1% | 1.2% | |
| 56 | 0% | 0% | |
| 57 | 0% | 0% | |
| 58 | 0% | 0% | |
| 59 | 0% | 0% | |
| 60 | 0% | 0% | |
| 61 | 0% | 0% | Last Result |
Volkspartij voor Vrijheid en Democratie – Christen-Democratisch Appèl – Democraten 66
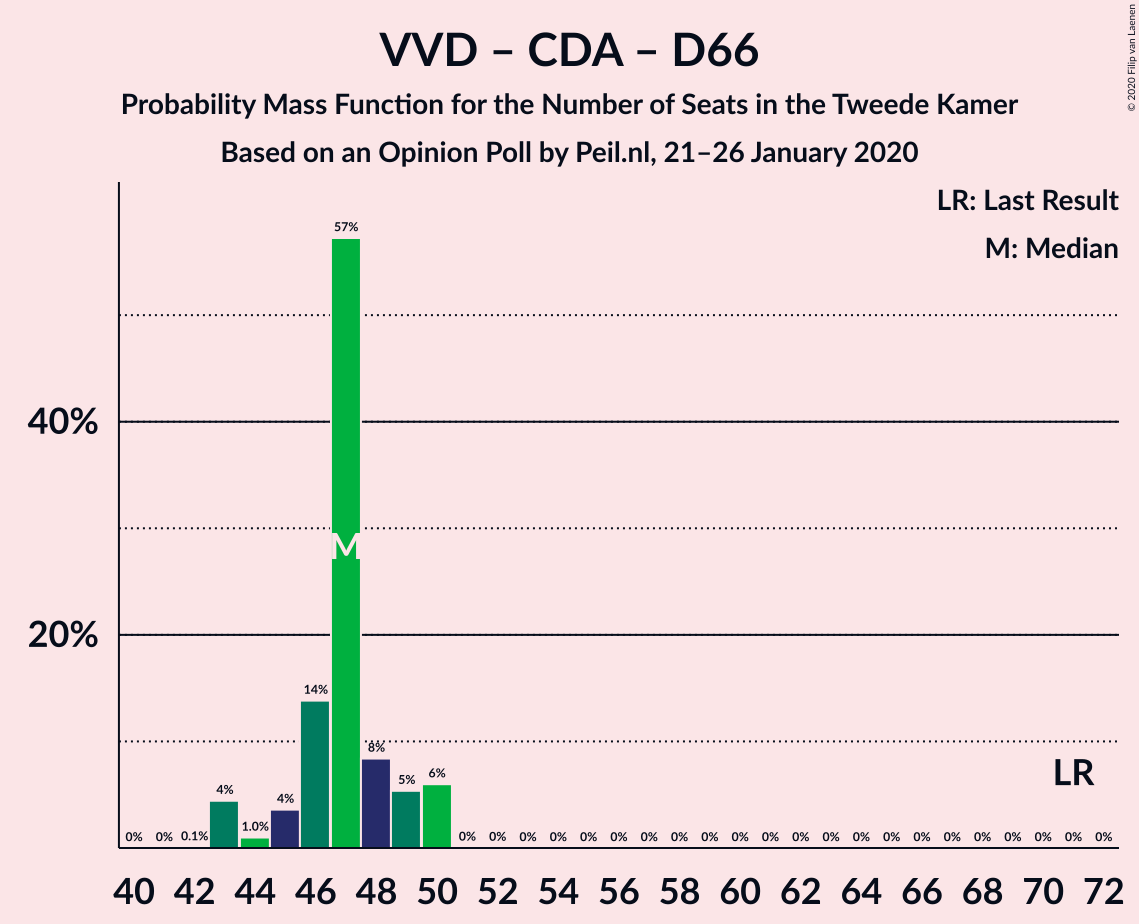
| Number of Seats | Probability | Accumulated | Special Marks |
|---|---|---|---|
| 42 | 0.1% | 100% | |
| 43 | 4% | 99.9% | |
| 44 | 1.0% | 95% | |
| 45 | 4% | 94% | |
| 46 | 14% | 91% | |
| 47 | 57% | 77% | Median |
| 48 | 8% | 20% | |
| 49 | 5% | 11% | |
| 50 | 6% | 6% | |
| 51 | 0% | 0.1% | |
| 52 | 0% | 0% | |
| 53 | 0% | 0% | |
| 54 | 0% | 0% | |
| 55 | 0% | 0% | |
| 56 | 0% | 0% | |
| 57 | 0% | 0% | |
| 58 | 0% | 0% | |
| 59 | 0% | 0% | |
| 60 | 0% | 0% | |
| 61 | 0% | 0% | |
| 62 | 0% | 0% | |
| 63 | 0% | 0% | |
| 64 | 0% | 0% | |
| 65 | 0% | 0% | |
| 66 | 0% | 0% | |
| 67 | 0% | 0% | |
| 68 | 0% | 0% | |
| 69 | 0% | 0% | |
| 70 | 0% | 0% | |
| 71 | 0% | 0% | Last Result |
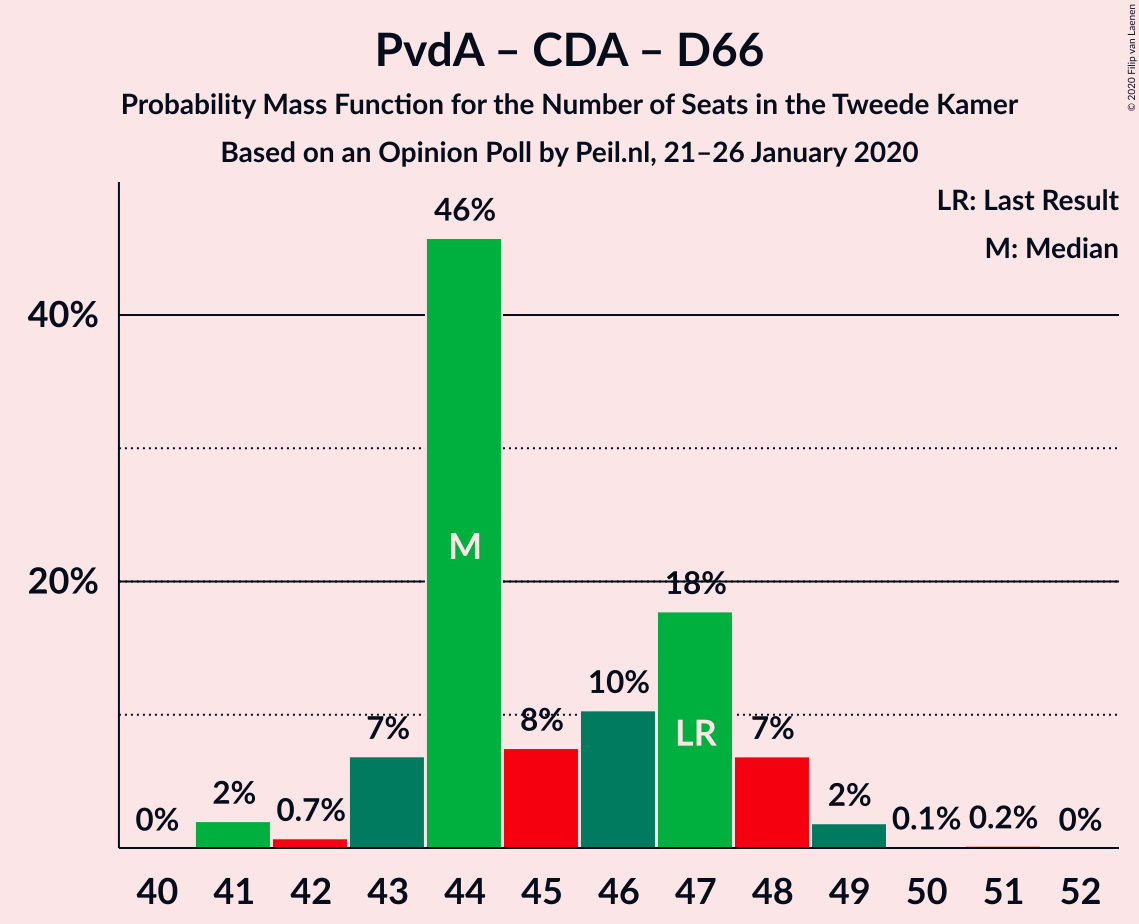
Partij van de Arbeid – Christen-Democratisch Appèl – Democraten 66
| Number of Seats | Probability | Accumulated | Special Marks |
|---|---|---|---|
| 41 | 2% | 100% | |
| 42 | 0.7% | 98% | |
| 43 | 7% | 97% | |
| 44 | 46% | 90% | Median |
| 45 | 8% | 45% | |
| 46 | 10% | 37% | |
| 47 | 18% | 27% | Last Result |
| 48 | 7% | 9% | |
| 49 | 2% | 2% | |
| 50 | 0.1% | 0.3% | |
| 51 | 0.2% | 0.2% | |
| 52 | 0% | 0% |
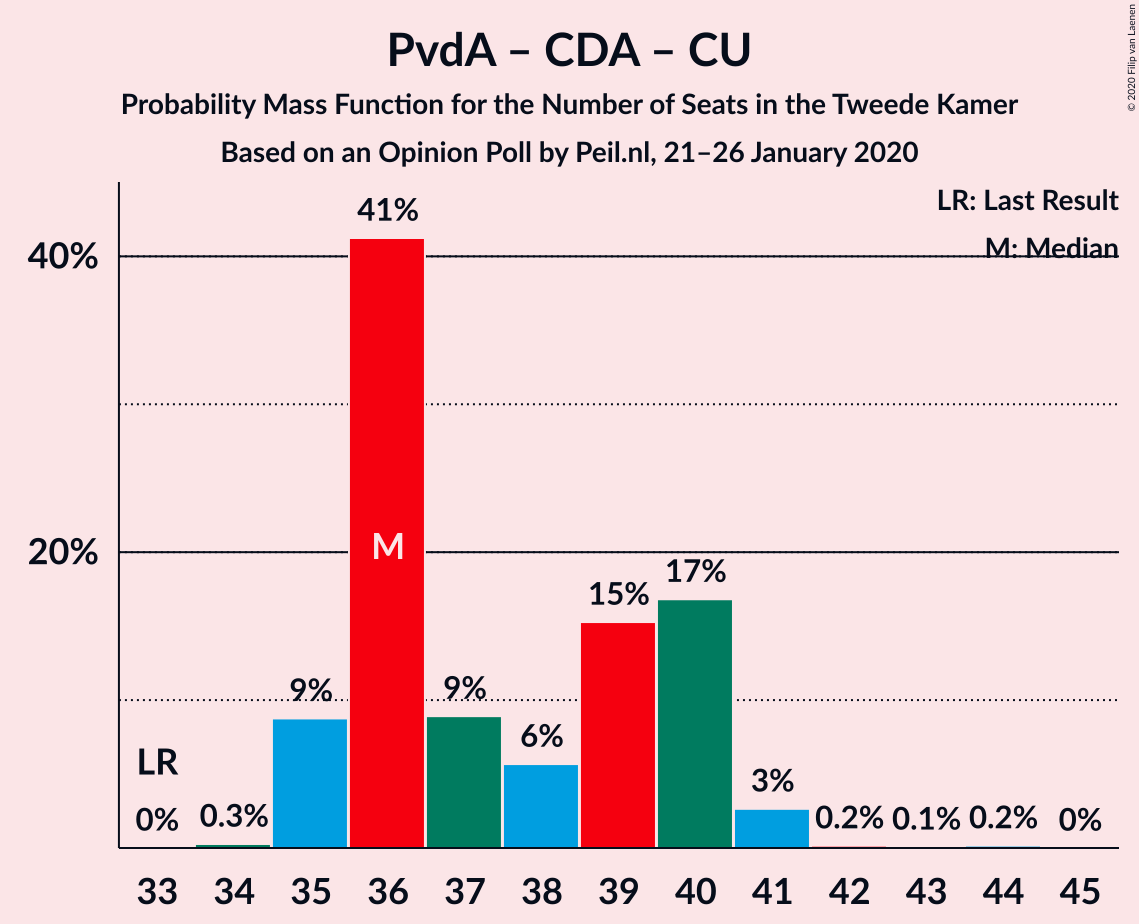
Partij van de Arbeid – Christen-Democratisch Appèl – ChristenUnie
| Number of Seats | Probability | Accumulated | Special Marks |
|---|---|---|---|
| 33 | 0% | 100% | Last Result |
| 34 | 0.3% | 100% | |
| 35 | 9% | 99.7% | |
| 36 | 41% | 91% | Median |
| 37 | 9% | 50% | |
| 38 | 6% | 41% | |
| 39 | 15% | 35% | |
| 40 | 17% | 20% | |
| 41 | 3% | 3% | |
| 42 | 0.2% | 0.4% | |
| 43 | 0.1% | 0.2% | |
| 44 | 0.2% | 0.2% | |
| 45 | 0% | 0% |
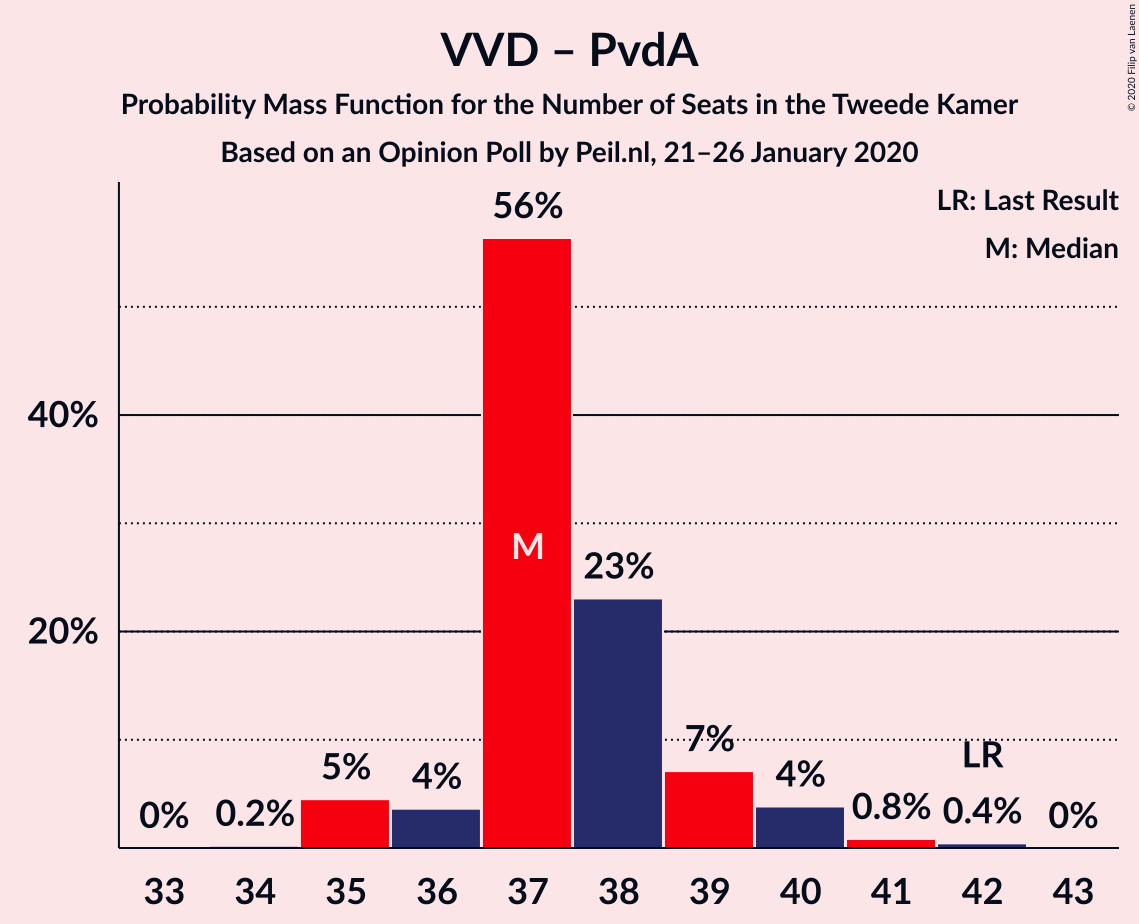
Volkspartij voor Vrijheid en Democratie – Partij van de Arbeid
| Number of Seats | Probability | Accumulated | Special Marks |
|---|---|---|---|
| 34 | 0.2% | 100% | |
| 35 | 5% | 99.8% | |
| 36 | 4% | 95% | |
| 37 | 56% | 92% | Median |
| 38 | 23% | 35% | |
| 39 | 7% | 12% | |
| 40 | 4% | 5% | |
| 41 | 0.8% | 1.3% | |
| 42 | 0.4% | 0.4% | Last Result |
| 43 | 0% | 0% |
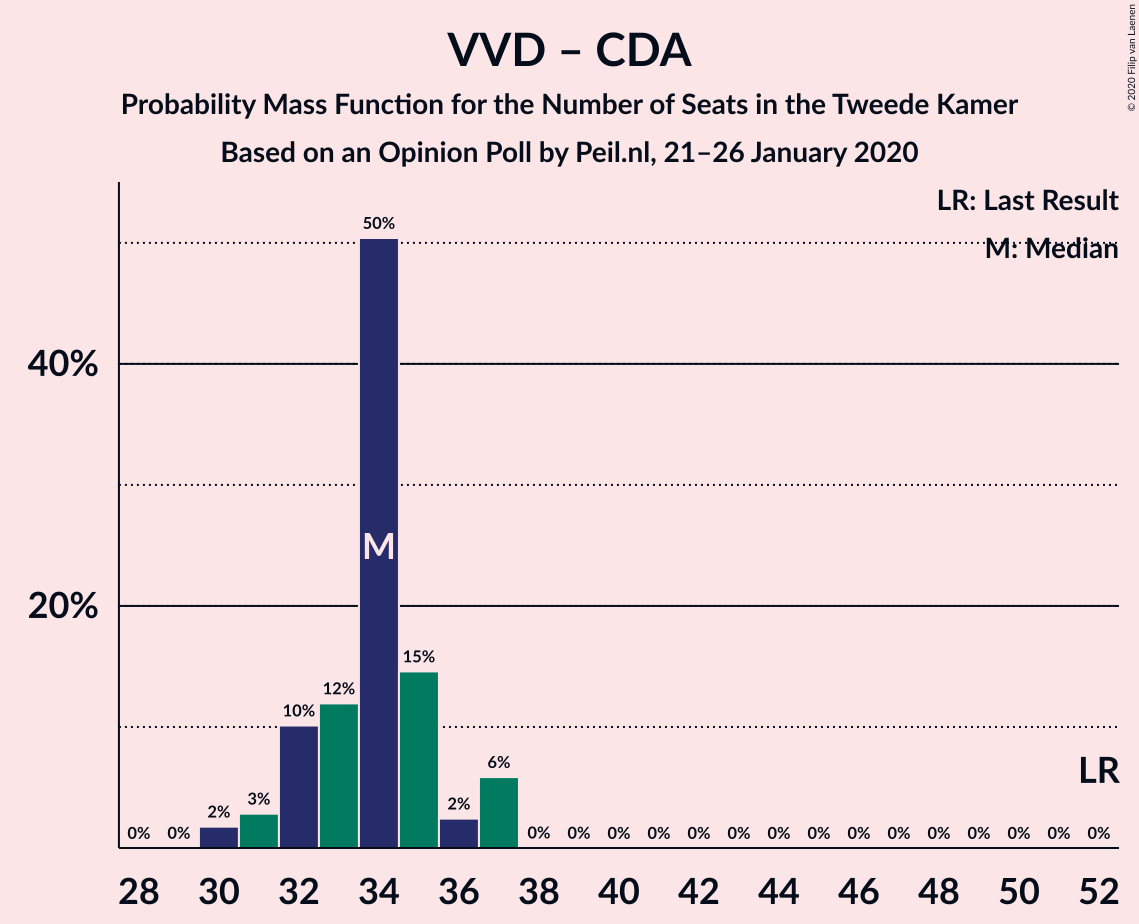
Volkspartij voor Vrijheid en Democratie – Christen-Democratisch Appèl
| Number of Seats | Probability | Accumulated | Special Marks |
|---|---|---|---|
| 30 | 2% | 100% | |
| 31 | 3% | 98% | |
| 32 | 10% | 95% | |
| 33 | 12% | 85% | |
| 34 | 50% | 73% | Median |
| 35 | 15% | 23% | |
| 36 | 2% | 8% | |
| 37 | 6% | 6% | |
| 38 | 0% | 0% | |
| 39 | 0% | 0% | |
| 40 | 0% | 0% | |
| 41 | 0% | 0% | |
| 42 | 0% | 0% | |
| 43 | 0% | 0% | |
| 44 | 0% | 0% | |
| 45 | 0% | 0% | |
| 46 | 0% | 0% | |
| 47 | 0% | 0% | |
| 48 | 0% | 0% | |
| 49 | 0% | 0% | |
| 50 | 0% | 0% | |
| 51 | 0% | 0% | |
| 52 | 0% | 0% | Last Result |
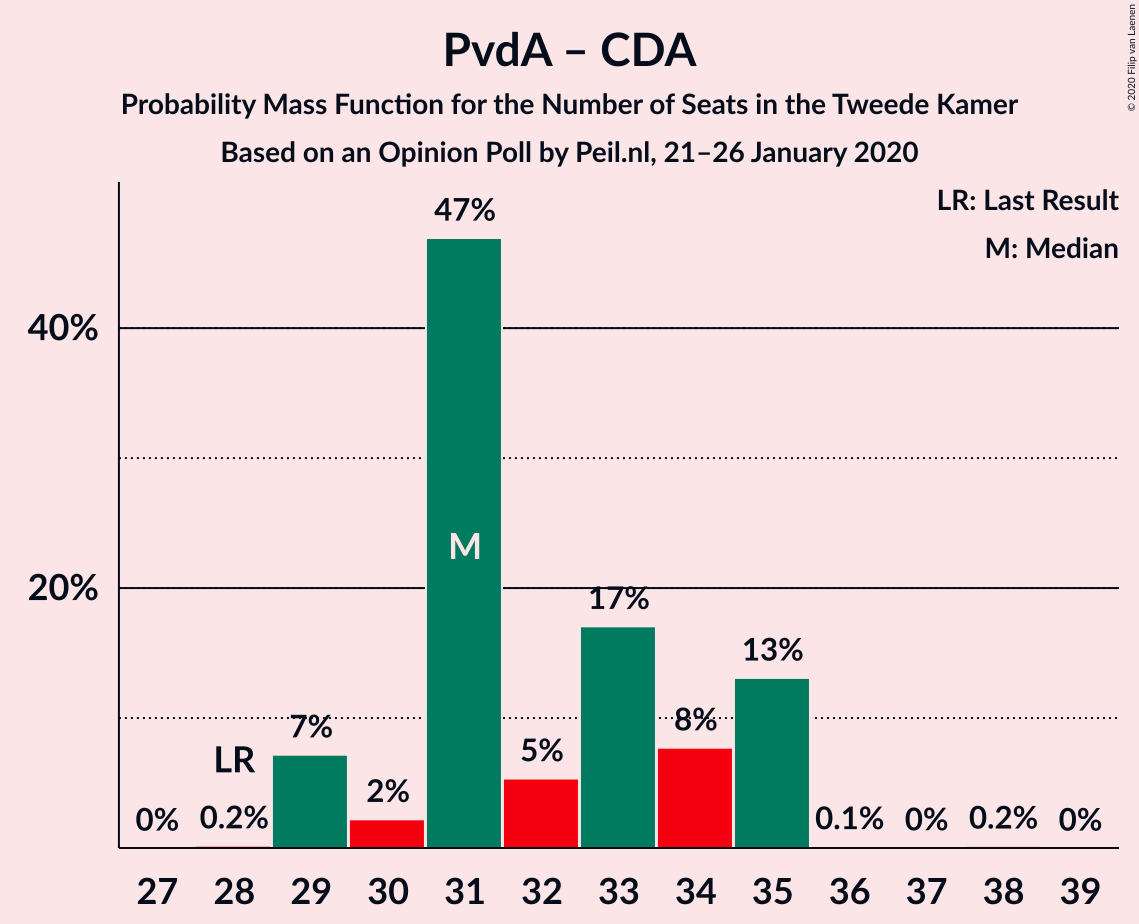
Partij van de Arbeid – Christen-Democratisch Appèl
| Number of Seats | Probability | Accumulated | Special Marks |
|---|---|---|---|
| 28 | 0.2% | 100% | Last Result |
| 29 | 7% | 99.8% | |
| 30 | 2% | 93% | |
| 31 | 47% | 90% | Median |
| 32 | 5% | 44% | |
| 33 | 17% | 38% | |
| 34 | 8% | 21% | |
| 35 | 13% | 13% | |
| 36 | 0.1% | 0.3% | |
| 37 | 0% | 0.2% | |
| 38 | 0.2% | 0.2% | |
| 39 | 0% | 0% |
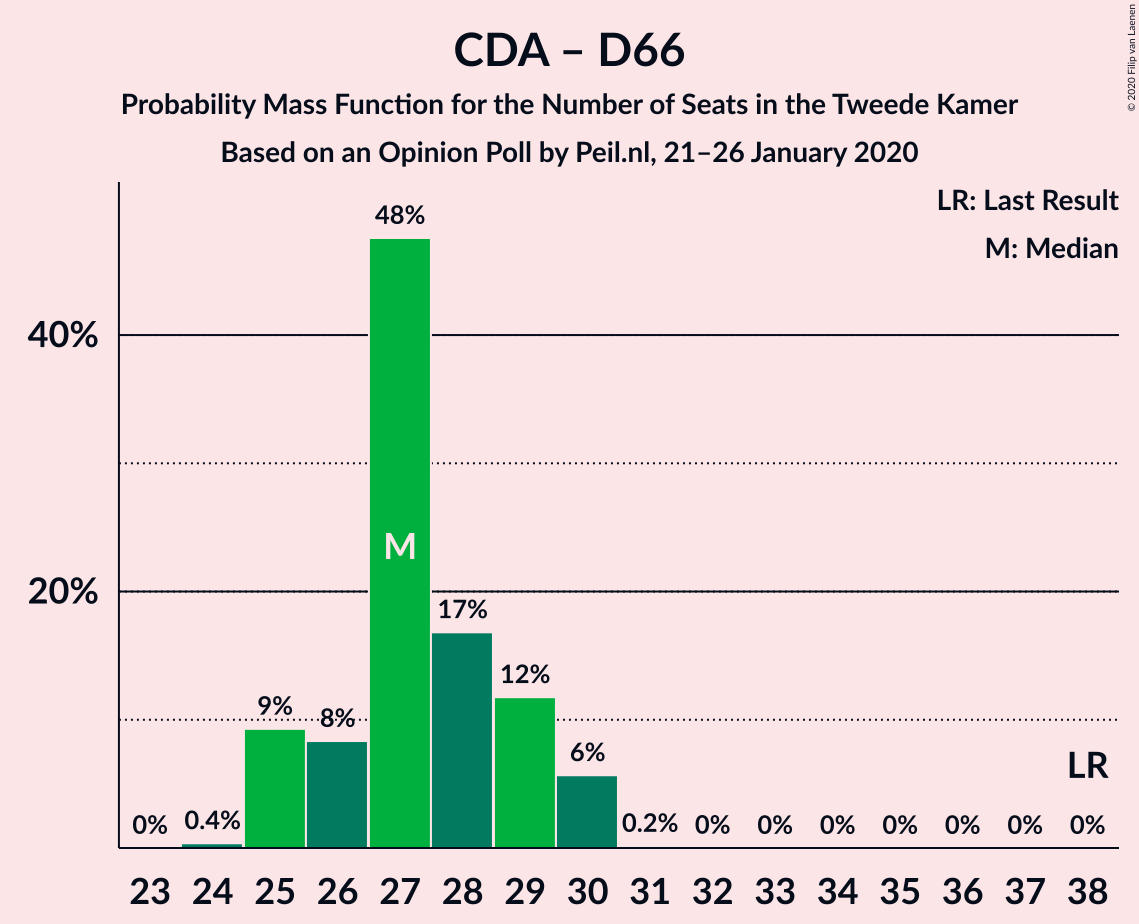
Christen-Democratisch Appèl – Democraten 66
| Number of Seats | Probability | Accumulated | Special Marks |
|---|---|---|---|
| 24 | 0.4% | 100% | |
| 25 | 9% | 99.6% | |
| 26 | 8% | 90% | |
| 27 | 48% | 82% | Median |
| 28 | 17% | 34% | |
| 29 | 12% | 18% | |
| 30 | 6% | 6% | |
| 31 | 0.2% | 0.2% | |
| 32 | 0% | 0% | |
| 33 | 0% | 0% | |
| 34 | 0% | 0% | |
| 35 | 0% | 0% | |
| 36 | 0% | 0% | |
| 37 | 0% | 0% | |
| 38 | 0% | 0% | Last Result |
Technical Information
Opinion Poll
- Polling firm: Peil.nl
- Commissioner(s): —
- Fieldwork period: 21–26 January 2020
Calculations
- Sample size: 3000
- Simulations done: 1,048,576
- Error estimate: 1.27%