Open Vlaamse Liberalen en Democraten
Voting Intentions
Last result: 8.3% (General Election of 9 June 2024)
Confidence Intervals
| Period | Polling firm/Commissioner(s) | Median | 80% Confidence Interval | 90% Confidence Interval | 95% Confidence Interval | 99% Confidence Interval |
|---|---|---|---|---|---|---|
| N/A | Poll Average | 7.2% | 6.2–8.3% | 5.9–8.6% | 5.7–8.9% | 5.3–9.4% |
| 1–9 December 2025 | Ipsos Het Laatste Nieuws, Le Soir, RTL TVi and VTM |
7.1% | 6.2–8.3% | 5.9–8.6% | 5.7–8.9% | 5.2–9.4% |
| 16–23 September 2025 | Ipsos Het Laatste Nieuws, Le Soir, RTL TVi and VTM |
5.7% | 4.9–6.8% | 4.6–7.1% | 4.4–7.3% | 4.1–7.9% |
| 27 May–3 June 2025 | Ipsos Het Laatste Nieuws, Le Soir, RTL TVi and VTM |
6.1% | 5.2–7.2% | 5.0–7.5% | 4.8–7.8% | 4.4–8.3% |
| 3–24 March 2025 | Bpact and Universiteit Antwerpen & ULB De Standaard, RTBF and VRT |
5.7% | 5.1–6.4% | 4.9–6.6% | 4.8–6.8% | 4.5–7.1% |
| 4–11 March 2025 | Ipsos Het Laatste Nieuws, Le Soir, RTL TVi and VTM |
6.0% | 5.1–7.1% | 4.9–7.4% | 4.7–7.7% | 4.3–8.2% |
| 18–21 November 2024 | Ipsos Het Laatste Nieuws, Le Soir, RTL TVi and VTM |
7.2% | 6.2–8.4% | 6.0–8.7% | 5.7–9.0% | 5.3–9.6% |
| 11–17 September 2024 | Ipsos Het Laatste Nieuws, Le Soir, RTL TVi and VTM |
6.8% | 5.9–7.9% | 5.6–8.3% | 5.4–8.5% | 5.0–9.1% |
Probability Mass Function
The following table shows the probability mass function per percentage block of voting intentions for the poll average for Open Vlaamse Liberalen en Democraten.
| Voting Intentions | Probability | Accumulated | Special Marks |
|---|---|---|---|
| 3.5–4.5% | 0% | 100% | |
| 4.5–5.5% | 2% | 100% | |
| 5.5–6.5% | 21% | 98% | |
| 6.5–7.5% | 46% | 78% | Median |
| 7.5–8.5% | 27% | 32% | Last Result |
| 8.5–9.5% | 5% | 5% | |
| 9.5–10.5% | 0.3% | 0.4% | |
| 10.5–11.5% | 0% | 0% |
Seats
Last result: 9 seats (General Election of 9 June 2024)
Confidence Intervals
| Period | Polling firm/Commissioner(s) | Median | 80% Confidence Interval | 90% Confidence Interval | 95% Confidence Interval | 99% Confidence Interval |
|---|---|---|---|---|---|---|
| N/A | Poll Average | 6 | 5–10 | 5–11 | 4–11 | 2–12 |
| 1–9 December 2025 | Ipsos Het Laatste Nieuws, Le Soir, RTL TVi and VTM |
6 | 5–10 | 5–11 | 4–11 | 2–12 |
| 16–23 September 2025 | Ipsos Het Laatste Nieuws, Le Soir, RTL TVi and VTM |
5 | 2–6 | 2–7 | 2–8 | 1–8 |
| 27 May–3 June 2025 | Ipsos Het Laatste Nieuws, Le Soir, RTL TVi and VTM |
5 | 2–7 | 2–8 | 2–8 | 2–10 |
| 3–24 March 2025 | Bpact and Universiteit Antwerpen & ULB De Standaard, RTBF and VRT |
5 | 2–6 | 2–6 | 2–7 | 2–7 |
| 4–11 March 2025 | Ipsos Het Laatste Nieuws, Le Soir, RTL TVi and VTM |
5 | 2–7 | 2–7 | 2–8 | 1–10 |
| 18–21 November 2024 | Ipsos Het Laatste Nieuws, Le Soir, RTL TVi and VTM |
7 | 5–10 | 5–11 | 4–12 | 3–12 |
| 11–17 September 2024 | Ipsos Het Laatste Nieuws, Le Soir, RTL TVi and VTM |
6 | 5–9 | 4–10 | 3–11 | 2–12 |
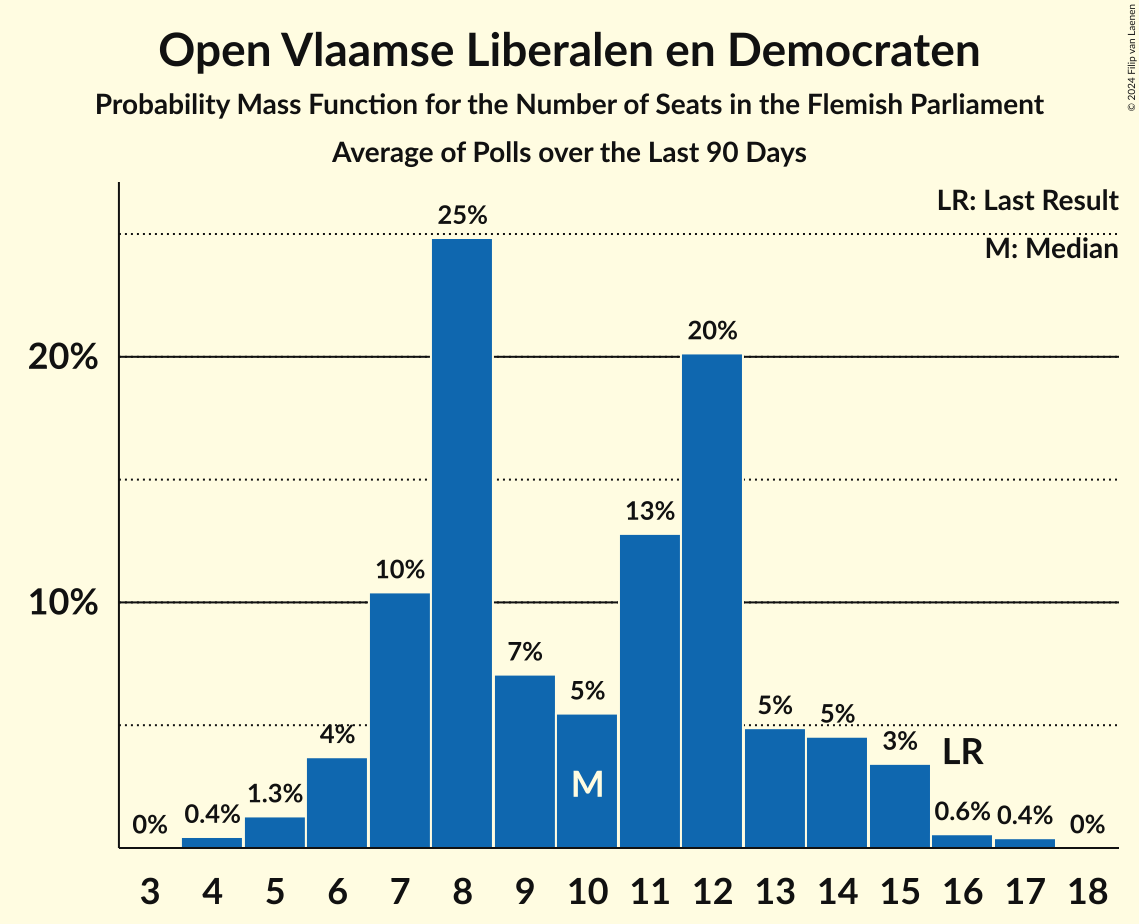
Probability Mass Function

The following table shows the probability mass function per seat for the poll average for Open Vlaamse Liberalen en Democraten.
| Number of Seats | Probability | Accumulated | Special Marks |
|---|---|---|---|
| 2 | 0.7% | 100% | |
| 3 | 1.4% | 99.3% | |
| 4 | 0.7% | 98% | |
| 5 | 19% | 97% | |
| 6 | 31% | 78% | Median |
| 7 | 14% | 47% | |
| 8 | 12% | 32% | |
| 9 | 8% | 21% | Last Result |
| 10 | 7% | 13% | |
| 11 | 4% | 6% | |
| 12 | 2% | 2% | |
| 13 | 0% | 0% |