Poll Average
Voting Intentions | Seats | Coalitions | Technical Information
Summary
The table below lists the polls on which the average is based. They are the most recent polls (less than 90 days old) registered and analyzed so far.
| Period | Polling firm/Commissioner(s) | N-VA | VB | VOORUIT | CD&V | Anders | PVDA | GROEN | TFA |
|---|---|---|---|---|---|---|---|---|---|
| 9 June 2024 | General Election | 23.9% 31 |
22.7% 31 |
13.8% 18 |
13.0% 16 |
8.3% 9 |
8.3% 9 |
7.3% 9 |
0.3% 1 |
| N/A | Poll Average | 23–28% 30–39 |
21–27% 27–36 |
10–14% 11–17 |
12–16% 14–20 |
6–9% 4–11 |
8–12% 10–15 |
6–9% 5–12 |
0–1% 0–3 |
| 1–9 December 2025 | Ipsos Het Laatste Nieuws, Le Soir, RTL TVi and VTM |
23–28% 30–39 |
21–27% 27–36 |
10–14% 11–17 |
12–16% 14–20 |
6–9% 4–11 |
8–12% 10–15 |
6–9% 5–12 |
0–1% 0–3 |
| 9 June 2024 | General Election | 23.9% 31 |
22.7% 31 |
13.8% 18 |
13.0% 16 |
8.3% 9 |
8.3% 9 |
7.3% 9 |
0.3% 1 |
Only polls for which at least the sample size has been published are included in the table above.
Legend:
- Top half of each row: Voting intentions (95% confidence interval)
- Bottom half of each row: Seat projections for the Flemish Parliament (95% confidence interval)
- N-VA: Nieuw-Vlaamse Alliantie
- VB: Vlaams Belang
- VOORUIT: Vooruit
- CD&V: Christen-Democratisch en Vlaams
- Anders: Anders
- PVDA: Partij van de Arbeid van België
- GROEN: Groen
- TFA: Team Fouad Ahidar
- N/A (single party): Party not included the published results
- N/A (entire row): Calculation for this opinion poll not started yet
Voting Intentions

Confidence Intervals
| Party | Last Result | Median | 80% Confidence Interval | 90% Confidence Interval | 95% Confidence Interval | 99% Confidence Interval |
|---|---|---|---|---|---|---|
| Nieuw-Vlaamse Alliantie | 23.9% | 25.6% | 23.9–27.4% | 23.4–27.9% | 23.0–28.4% | 22.2–29.3% |
| Vlaams Belang | 22.7% | 23.9% | 22.2–25.7% | 21.8–26.2% | 21.4–26.6% | 20.6–27.5% |
| Vooruit | 13.8% | 11.5% | 10.2–12.8% | 9.9–13.2% | 9.6–13.5% | 9.0–14.2% |
| Christen-Democratisch en Vlaams | 13.0% | 14.0% | 12.6–15.4% | 12.2–15.8% | 11.9–16.2% | 11.3–16.9% |
| Anders | 8.3% | 7.2% | 6.2–8.3% | 5.9–8.6% | 5.7–8.9% | 5.3–9.4% |
| Partij van de Arbeid van België | 8.3% | 10.2% | 9.1–11.5% | 8.7–11.9% | 8.5–12.2% | 8.0–12.9% |
| Groen | 7.3% | 7.1% | 6.1–8.1% | 5.8–8.5% | 5.6–8.8% | 5.2–9.3% |
| Team Fouad Ahidar | 0.3% | 0.3% | 0.1–0.5% | 0.1–0.6% | 0.1–0.7% | 0.0–0.9% |
Nieuw-Vlaamse Alliantie
For a full overview of the results for this party, see the Nieuw-Vlaamse Alliantie page.
| Voting Intentions | Probability | Accumulated | Special Marks |
|---|---|---|---|
| 19.5–20.5% | 0% | 100% | |
| 20.5–21.5% | 0.1% | 100% | |
| 21.5–22.5% | 1.0% | 99.9% | |
| 22.5–23.5% | 5% | 98.9% | |
| 23.5–24.5% | 15% | 94% | Last Result |
| 24.5–25.5% | 26% | 78% | |
| 25.5–26.5% | 27% | 53% | Median |
| 26.5–27.5% | 17% | 25% | |
| 27.5–28.5% | 7% | 8% | |
| 28.5–29.5% | 2% | 2% | |
| 29.5–30.5% | 0.3% | 0.3% | |
| 30.5–31.5% | 0% | 0% |
Vlaams Belang
For a full overview of the results for this party, see the Vlaams Belang page.
| Voting Intentions | Probability | Accumulated | Special Marks |
|---|---|---|---|
| 18.5–19.5% | 0% | 100% | |
| 19.5–20.5% | 0.4% | 100% | |
| 20.5–21.5% | 3% | 99.5% | |
| 21.5–22.5% | 12% | 96% | |
| 22.5–23.5% | 24% | 85% | Last Result |
| 23.5–24.5% | 29% | 61% | Median |
| 24.5–25.5% | 20% | 32% | |
| 25.5–26.5% | 9% | 12% | |
| 26.5–27.5% | 2% | 3% | |
| 27.5–28.5% | 0.4% | 0.5% | |
| 28.5–29.5% | 0% | 0.1% | |
| 29.5–30.5% | 0% | 0% |
Vooruit
For a full overview of the results for this party, see the Vooruit page.
| Voting Intentions | Probability | Accumulated | Special Marks |
|---|---|---|---|
| 6.5–7.5% | 0% | 100% | |
| 7.5–8.5% | 0.1% | 100% | |
| 8.5–9.5% | 2% | 99.9% | |
| 9.5–10.5% | 16% | 98% | |
| 10.5–11.5% | 36% | 82% | Median |
| 11.5–12.5% | 31% | 46% | |
| 12.5–13.5% | 12% | 15% | |
| 13.5–14.5% | 2% | 2% | Last Result |
| 14.5–15.5% | 0.2% | 0.2% | |
| 15.5–16.5% | 0% | 0% |
Christen-Democratisch en Vlaams
For a full overview of the results for this party, see the Christen-Democratisch en Vlaams page.
| Voting Intentions | Probability | Accumulated | Special Marks |
|---|---|---|---|
| 9.5–10.5% | 0% | 100% | |
| 10.5–11.5% | 1.0% | 100% | |
| 11.5–12.5% | 8% | 98.9% | |
| 12.5–13.5% | 26% | 91% | Last Result |
| 13.5–14.5% | 35% | 64% | Median |
| 14.5–15.5% | 21% | 29% | |
| 15.5–16.5% | 7% | 8% | |
| 16.5–17.5% | 1.1% | 1.2% | |
| 17.5–18.5% | 0.1% | 0.1% | |
| 18.5–19.5% | 0% | 0% |
Anders
For a full overview of the results for this party, see the Anders page.
| Voting Intentions | Probability | Accumulated | Special Marks |
|---|---|---|---|
| 3.5–4.5% | 0% | 100% | |
| 4.5–5.5% | 2% | 100% | |
| 5.5–6.5% | 21% | 98% | |
| 6.5–7.5% | 46% | 78% | Median |
| 7.5–8.5% | 27% | 32% | Last Result |
| 8.5–9.5% | 5% | 5% | |
| 9.5–10.5% | 0.3% | 0.4% | |
| 10.5–11.5% | 0% | 0% |
Partij van de Arbeid van België
For a full overview of the results for this party, see the Partij van de Arbeid van België page.
| Voting Intentions | Probability | Accumulated | Special Marks |
|---|---|---|---|
| 5.5–6.5% | 0% | 100% | |
| 6.5–7.5% | 0.1% | 100% | |
| 7.5–8.5% | 3% | 99.9% | Last Result |
| 8.5–9.5% | 20% | 97% | |
| 9.5–10.5% | 39% | 77% | Median |
| 10.5–11.5% | 29% | 38% | |
| 11.5–12.5% | 8% | 10% | |
| 12.5–13.5% | 1.1% | 1.2% | |
| 13.5–14.5% | 0.1% | 0.1% | |
| 14.5–15.5% | 0% | 0% |
Groen
For a full overview of the results for this party, see the Groen page.
| Voting Intentions | Probability | Accumulated | Special Marks |
|---|---|---|---|
| 3.5–4.5% | 0% | 100% | |
| 4.5–5.5% | 2% | 100% | |
| 5.5–6.5% | 24% | 98% | |
| 6.5–7.5% | 46% | 74% | Last Result, Median |
| 7.5–8.5% | 24% | 28% | |
| 8.5–9.5% | 4% | 4% | |
| 9.5–10.5% | 0.2% | 0.2% | |
| 10.5–11.5% | 0% | 0% |
Team Fouad Ahidar
For a full overview of the results for this party, see the Team Fouad Ahidar page.
| Voting Intentions | Probability | Accumulated | Special Marks |
|---|---|---|---|
| 0.0–0.5% | 91% | 100% | Last Result, Median |
| 0.5–1.5% | 9% | 9% | |
| 1.5–2.5% | 0% | 0% |
Seats
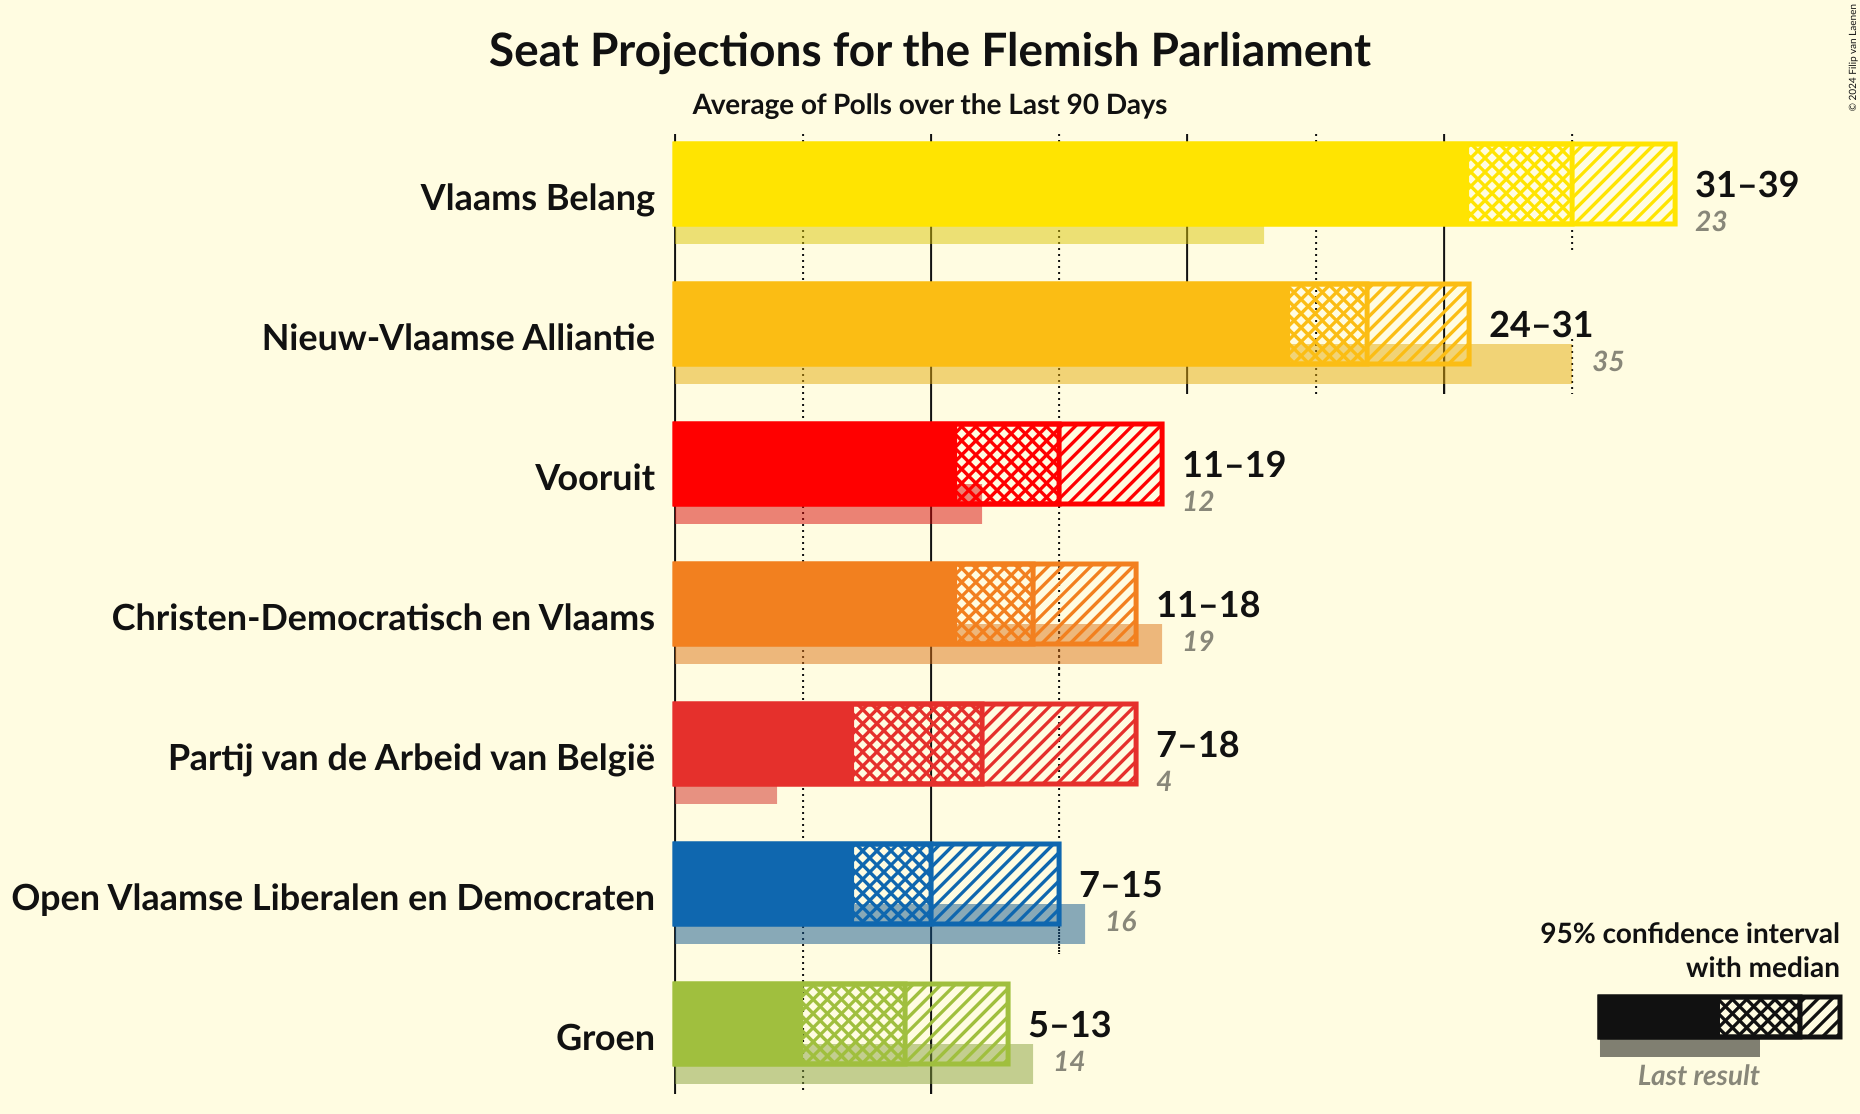
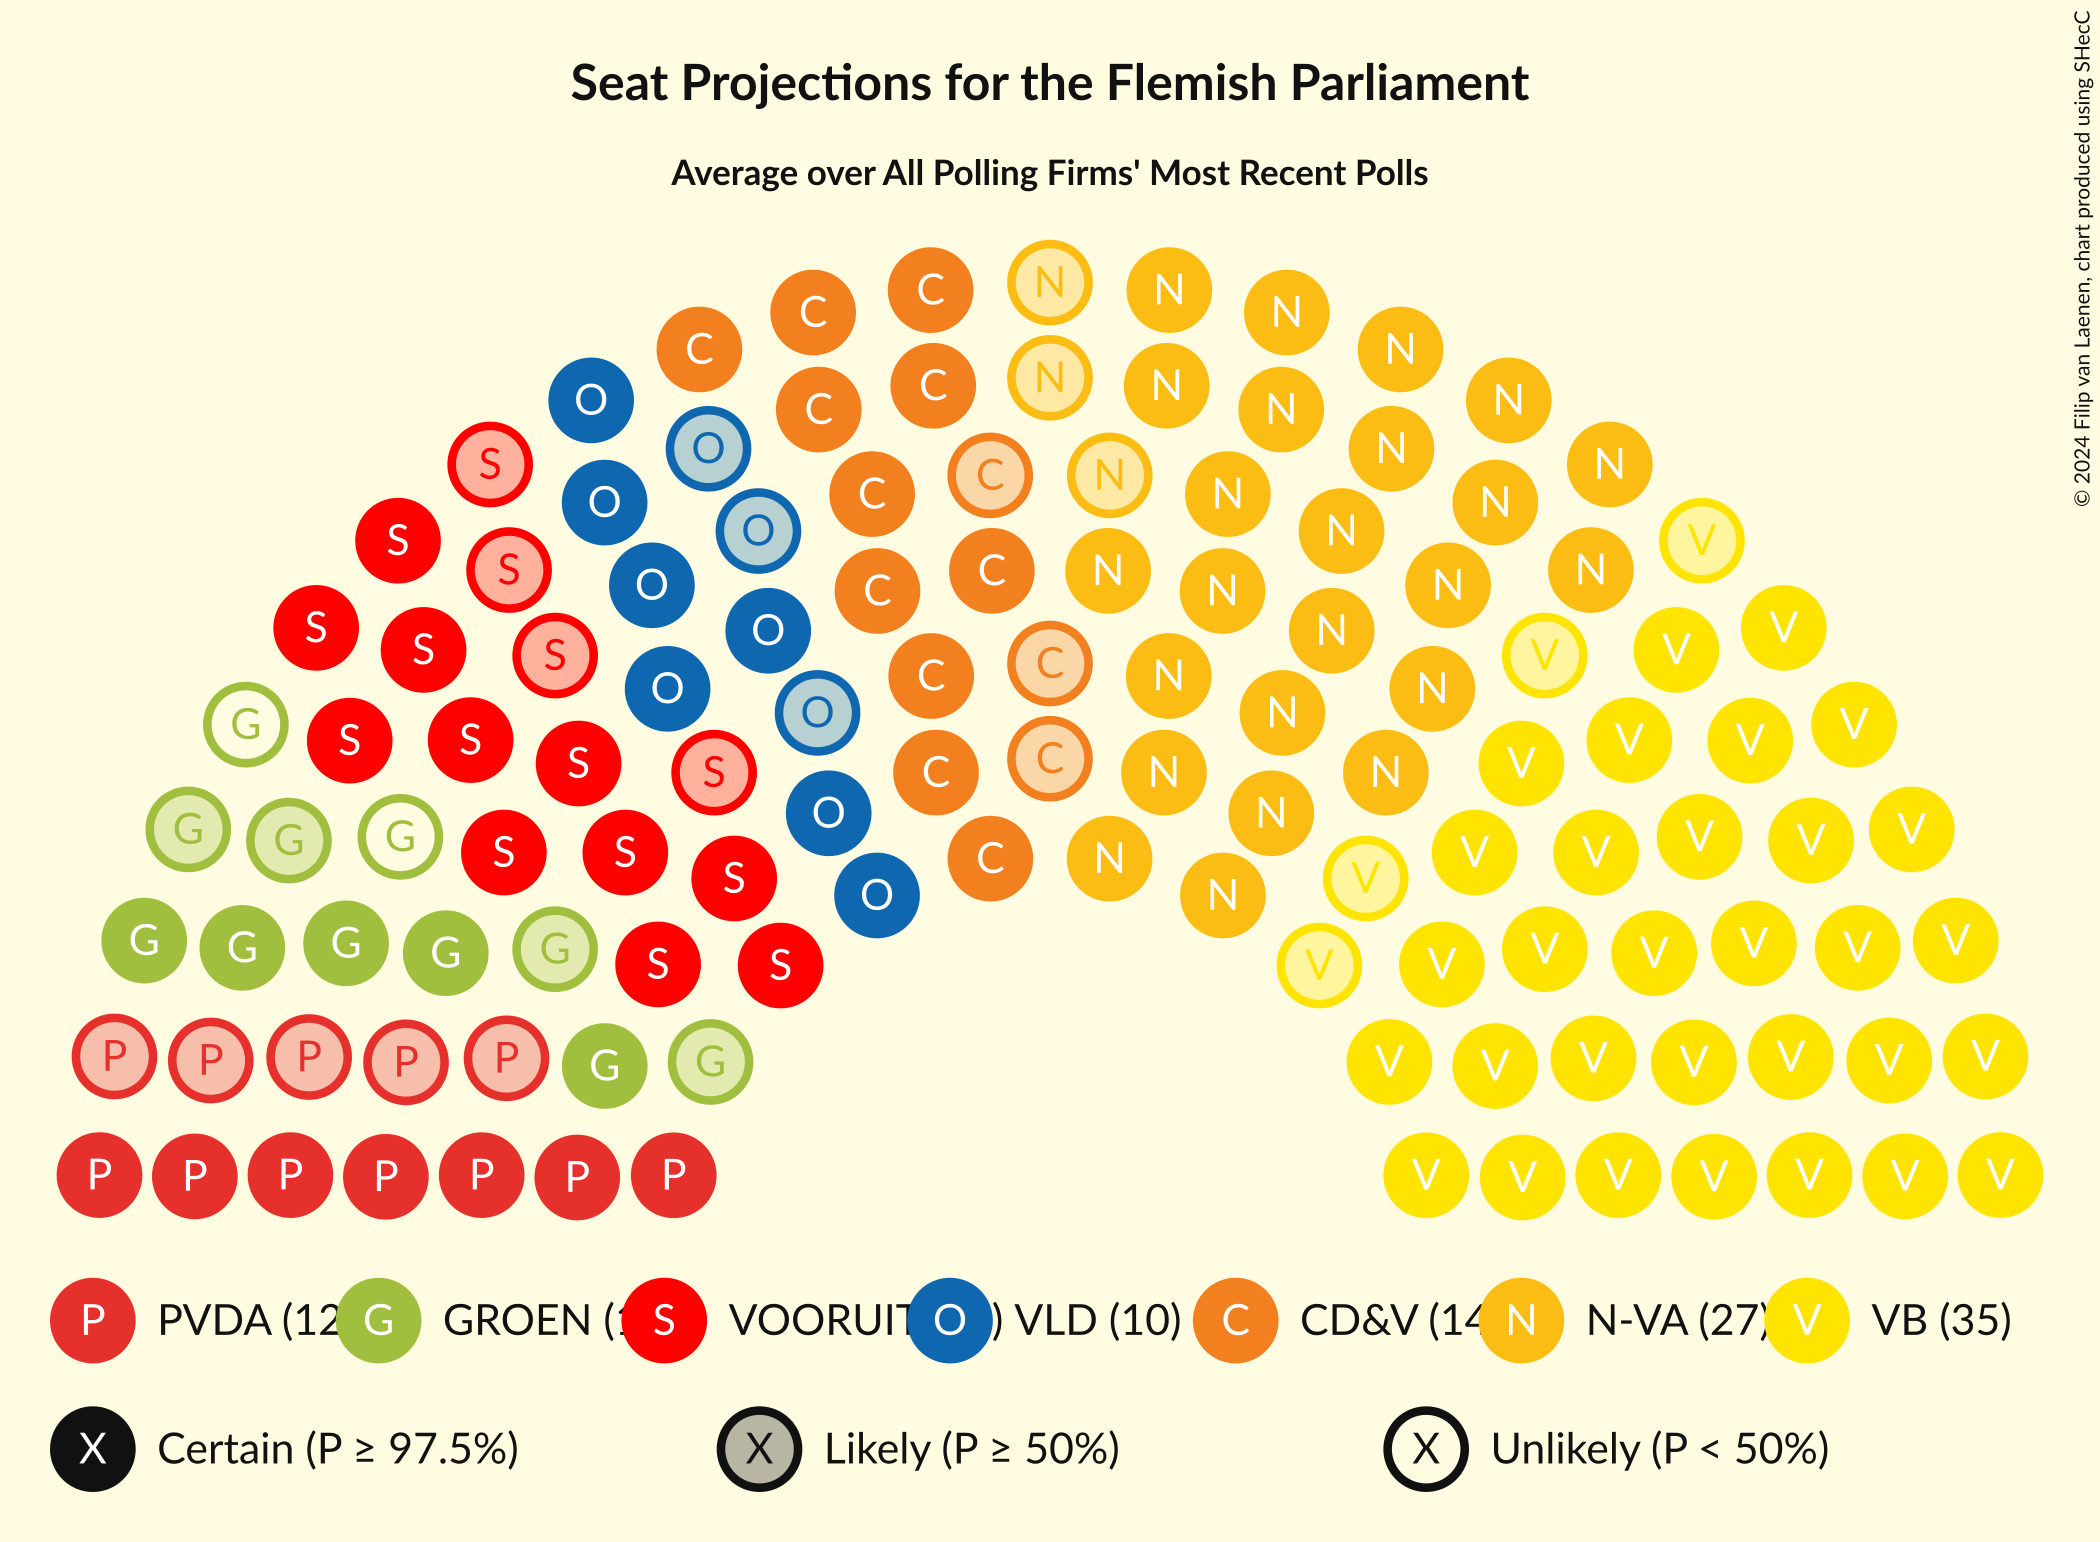
Confidence Intervals
| Party | Last Result | Median | 80% Confidence Interval | 90% Confidence Interval | 95% Confidence Interval | 99% Confidence Interval |
|---|---|---|---|---|---|---|
| Nieuw-Vlaamse Alliantie | 31 | 34 | 31–37 | 30–38 | 30–39 | 29–39 |
| Vlaams Belang | 31 | 31 | 29–34 | 28–35 | 27–36 | 26–36 |
| Vooruit | 18 | 13 | 11–16 | 11–17 | 11–17 | 10–18 |
| Christen-Democratisch en Vlaams | 16 | 17 | 15–19 | 15–19 | 14–20 | 13–21 |
| Anders | 9 | 6 | 5–10 | 5–11 | 4–11 | 2–12 |
| Partij van de Arbeid van België | 9 | 12 | 10–14 | 10–14 | 10–15 | 7–17 |
| Groen | 9 | 9 | 6–11 | 5–11 | 5–12 | 4–12 |
| Team Fouad Ahidar | 1 | 1 | 0–2 | 0–3 | 0–3 | 0–4 |
Nieuw-Vlaamse Alliantie
For a full overview of the results for this party, see the Nieuw-Vlaamse Alliantie page.
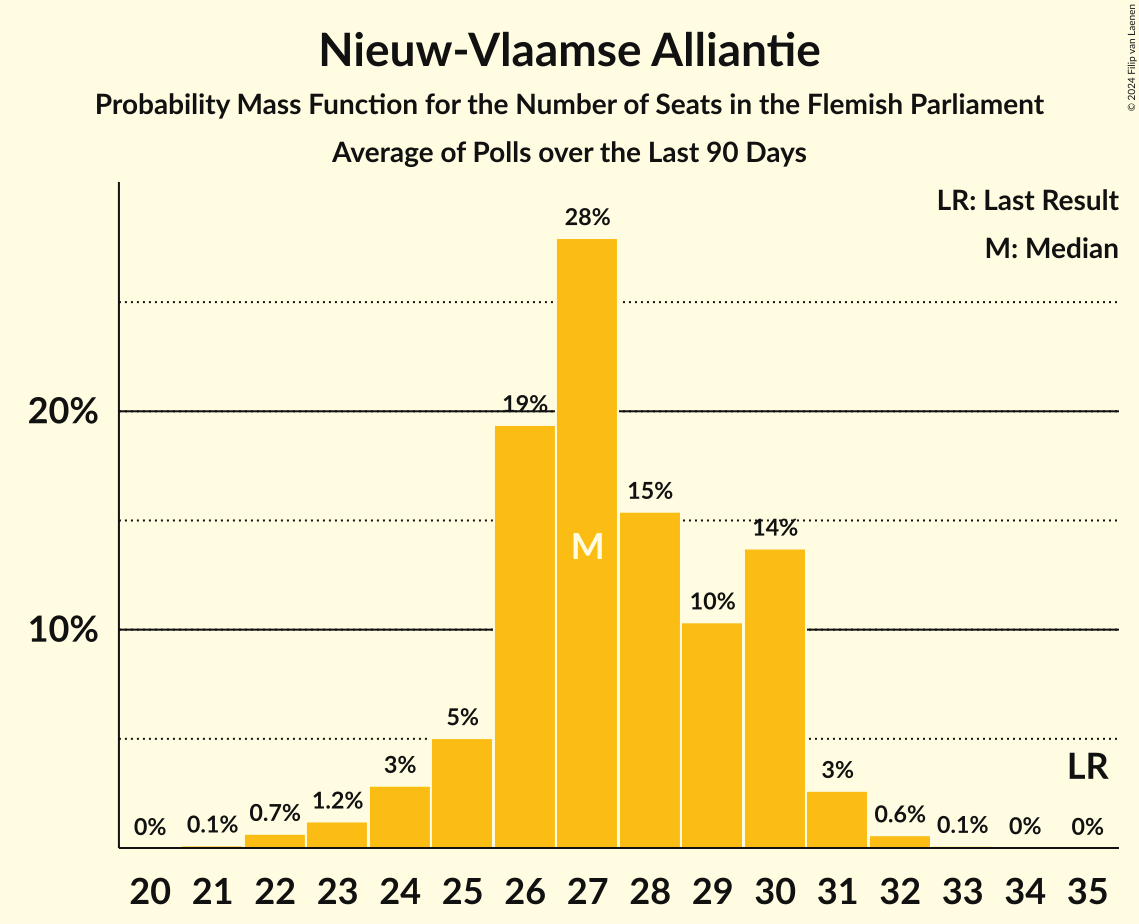
| Number of Seats | Probability | Accumulated | Special Marks |
|---|---|---|---|
| 27 | 0% | 100% | |
| 28 | 0.2% | 99.9% | |
| 29 | 1.2% | 99.7% | |
| 30 | 5% | 98% | |
| 31 | 10% | 94% | Last Result |
| 32 | 14% | 84% | |
| 33 | 17% | 70% | |
| 34 | 16% | 53% | Median |
| 35 | 11% | 37% | |
| 36 | 14% | 26% | |
| 37 | 5% | 12% | |
| 38 | 4% | 7% | |
| 39 | 2% | 3% | |
| 40 | 0.3% | 0.4% | |
| 41 | 0% | 0% |
Vlaams Belang
For a full overview of the results for this party, see the Vlaams Belang page.
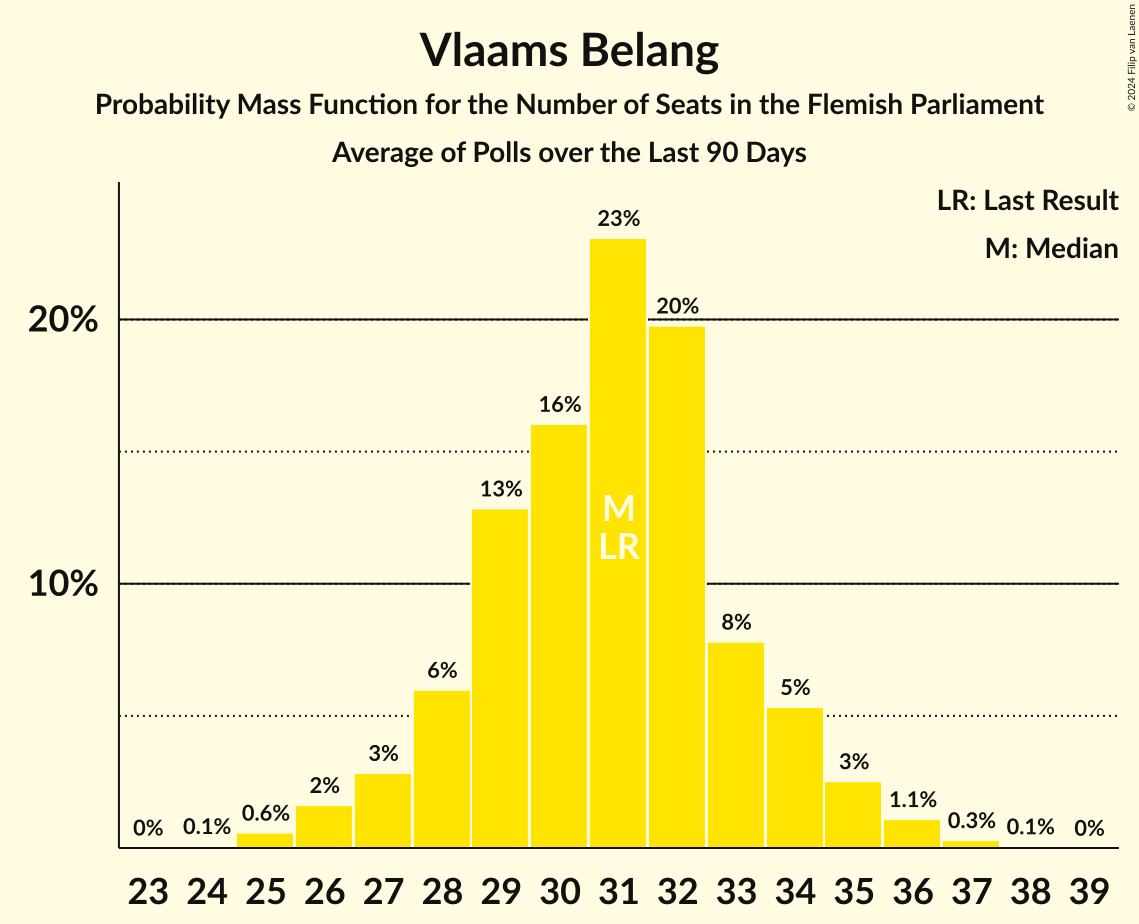
| Number of Seats | Probability | Accumulated | Special Marks |
|---|---|---|---|
| 25 | 0.3% | 100% | |
| 26 | 0.9% | 99.7% | |
| 27 | 2% | 98.8% | |
| 28 | 4% | 97% | |
| 29 | 7% | 93% | |
| 30 | 28% | 86% | |
| 31 | 14% | 58% | Last Result, Median |
| 32 | 19% | 44% | |
| 33 | 7% | 25% | |
| 34 | 9% | 18% | |
| 35 | 6% | 9% | |
| 36 | 3% | 3% | |
| 37 | 0.3% | 0.4% | |
| 38 | 0% | 0.1% | |
| 39 | 0% | 0% |
Vooruit
For a full overview of the results for this party, see the Vooruit page.
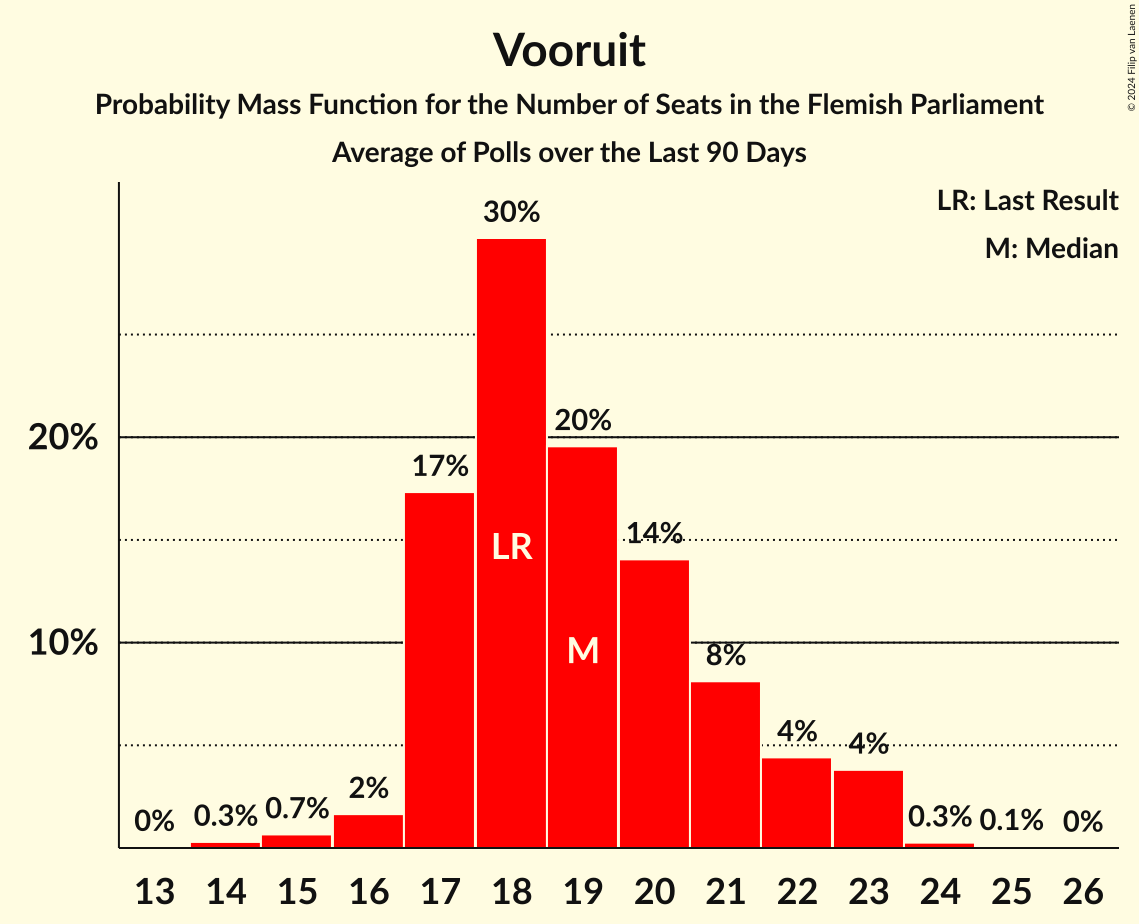
| Number of Seats | Probability | Accumulated | Special Marks |
|---|---|---|---|
| 10 | 2% | 100% | |
| 11 | 26% | 98% | |
| 12 | 11% | 72% | |
| 13 | 13% | 61% | Median |
| 14 | 23% | 48% | |
| 15 | 8% | 25% | |
| 16 | 8% | 17% | |
| 17 | 8% | 9% | |
| 18 | 1.1% | 1.2% | Last Result |
| 19 | 0.1% | 0.1% | |
| 20 | 0% | 0% |
Christen-Democratisch en Vlaams
For a full overview of the results for this party, see the Christen-Democratisch en Vlaams page.
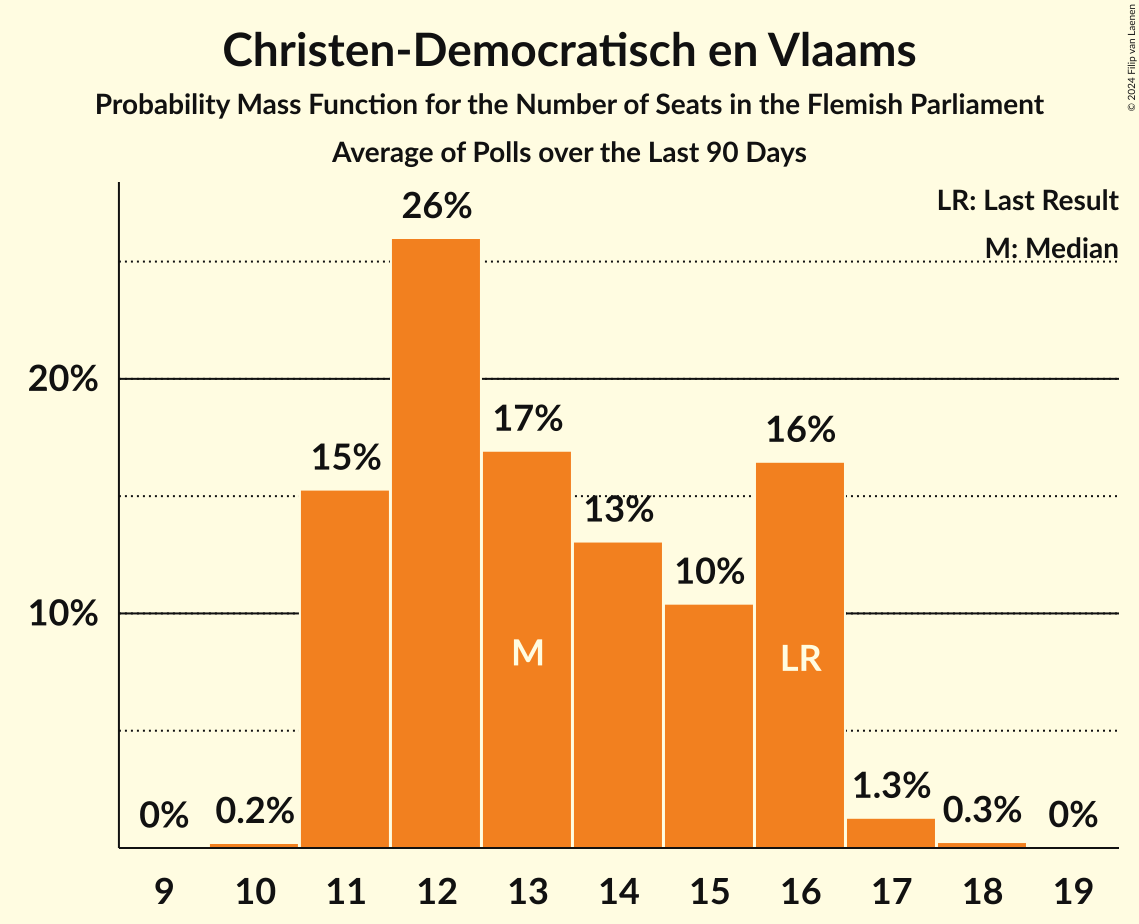
| Number of Seats | Probability | Accumulated | Special Marks |
|---|---|---|---|
| 11 | 0.1% | 100% | |
| 12 | 0.4% | 99.9% | |
| 13 | 1.3% | 99.5% | |
| 14 | 3% | 98% | |
| 15 | 6% | 95% | |
| 16 | 37% | 89% | Last Result |
| 17 | 21% | 53% | Median |
| 18 | 12% | 31% | |
| 19 | 16% | 20% | |
| 20 | 2% | 3% | |
| 21 | 0.9% | 1.3% | |
| 22 | 0.3% | 0.5% | |
| 23 | 0.1% | 0.1% | |
| 24 | 0% | 0% |
Anders
For a full overview of the results for this party, see the Anders page.
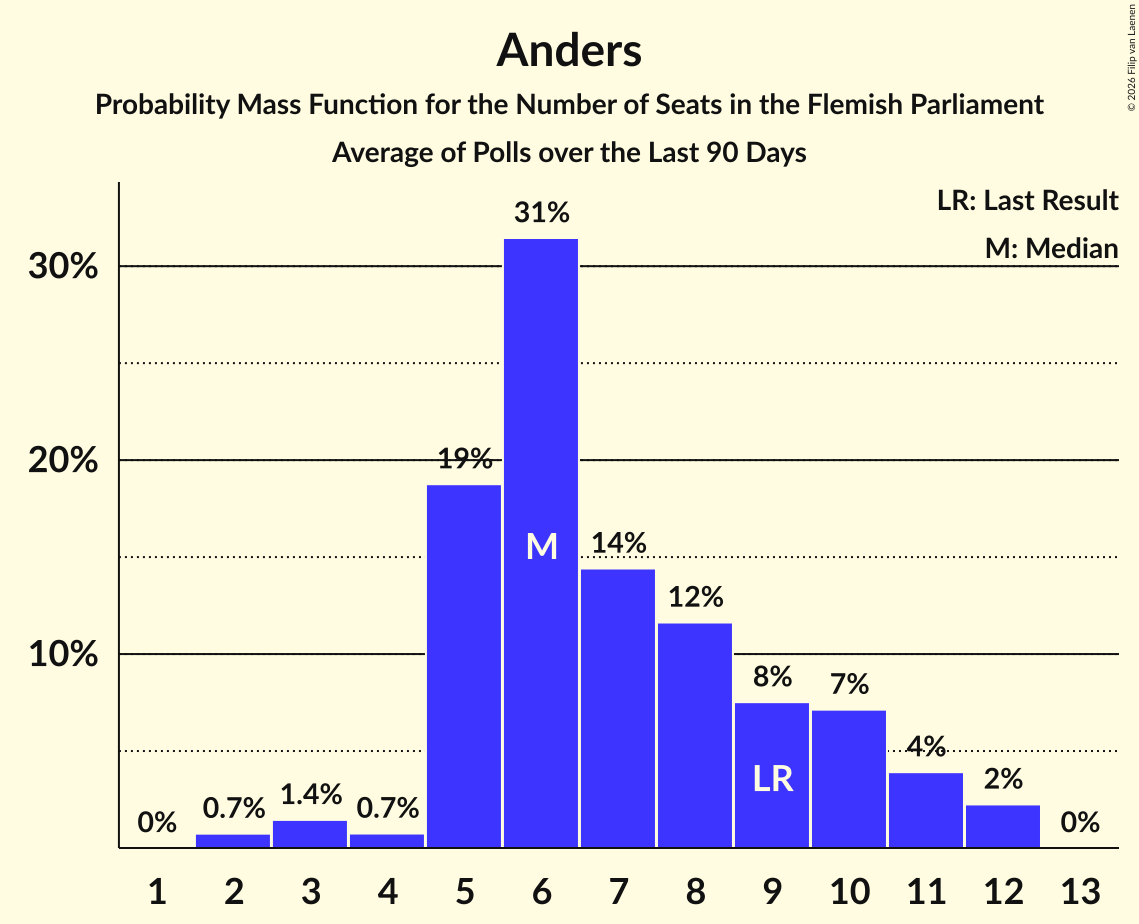
| Number of Seats | Probability | Accumulated | Special Marks |
|---|---|---|---|
| 2 | 0.7% | 100% | |
| 3 | 1.4% | 99.3% | |
| 4 | 0.7% | 98% | |
| 5 | 19% | 97% | |
| 6 | 31% | 78% | Median |
| 7 | 14% | 47% | |
| 8 | 12% | 32% | |
| 9 | 8% | 21% | Last Result |
| 10 | 7% | 13% | |
| 11 | 4% | 6% | |
| 12 | 2% | 2% | |
| 13 | 0% | 0% |
Partij van de Arbeid van België
For a full overview of the results for this party, see the Partij van de Arbeid van België page.
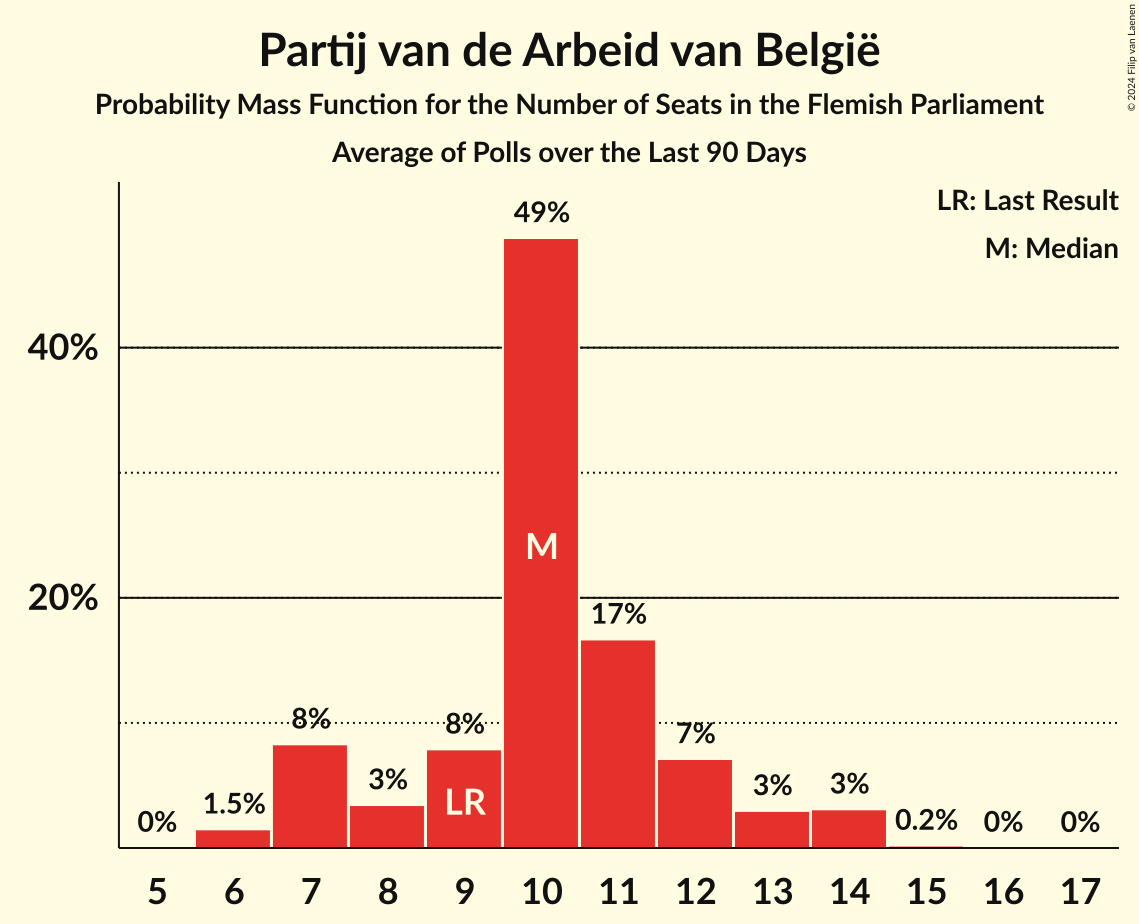
| Number of Seats | Probability | Accumulated | Special Marks |
|---|---|---|---|
| 7 | 0.5% | 100% | |
| 8 | 0.3% | 99.5% | |
| 9 | 1.0% | 99.1% | Last Result |
| 10 | 20% | 98% | |
| 11 | 18% | 78% | |
| 12 | 17% | 60% | Median |
| 13 | 13% | 43% | |
| 14 | 25% | 30% | |
| 15 | 2% | 5% | |
| 16 | 1.4% | 2% | |
| 17 | 0.9% | 0.9% | |
| 18 | 0% | 0% |
Groen
For a full overview of the results for this party, see the Groen page.
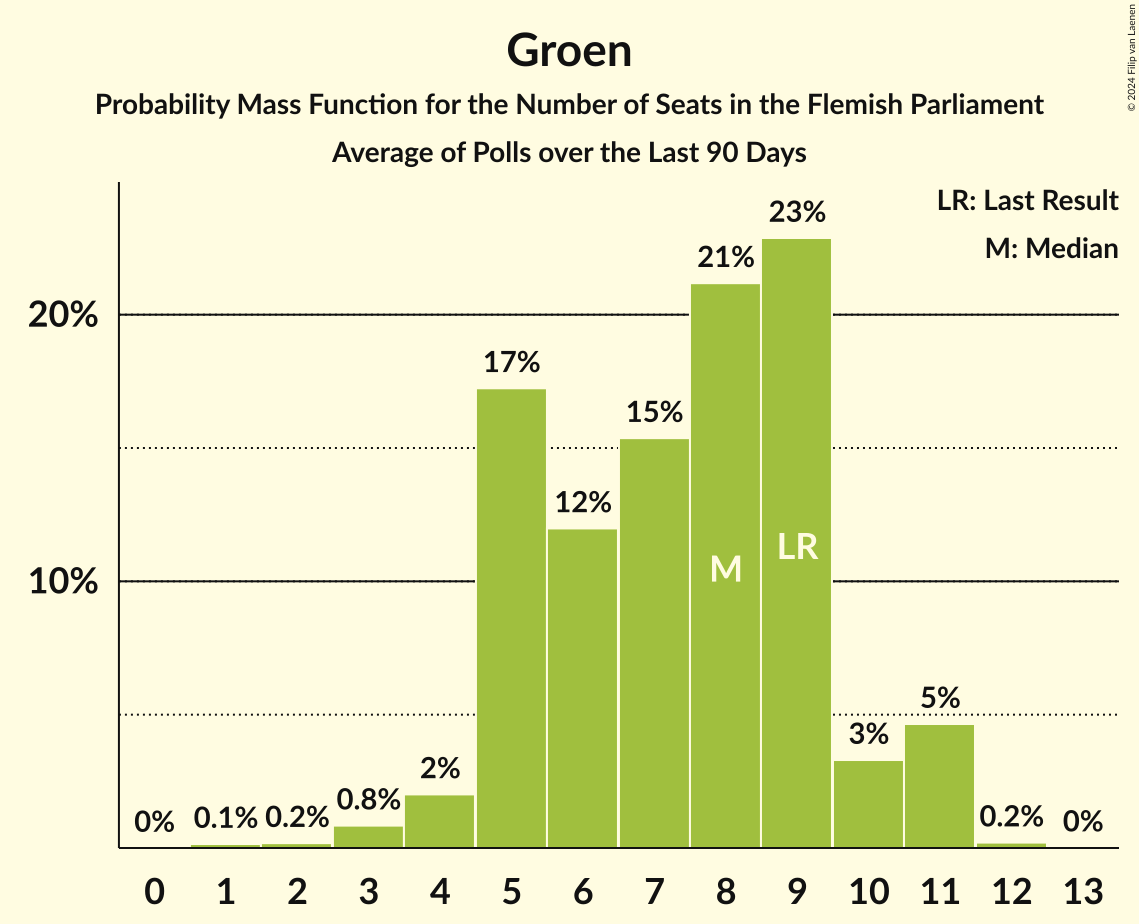
| Number of Seats | Probability | Accumulated | Special Marks |
|---|---|---|---|
| 3 | 0.2% | 100% | |
| 4 | 0.6% | 99.8% | |
| 5 | 6% | 99.2% | |
| 6 | 9% | 93% | |
| 7 | 13% | 84% | |
| 8 | 17% | 71% | |
| 9 | 32% | 54% | Last Result, Median |
| 10 | 11% | 22% | |
| 11 | 8% | 10% | |
| 12 | 2% | 3% | |
| 13 | 0.5% | 0.5% | |
| 14 | 0% | 0% |
Team Fouad Ahidar
For a full overview of the results for this party, see the Team Fouad Ahidar page.

| Number of Seats | Probability | Accumulated | Special Marks |
|---|---|---|---|
| 0 | 25% | 100% | |
| 1 | 41% | 75% | Last Result, Median |
| 2 | 26% | 34% | |
| 3 | 7% | 8% | |
| 4 | 0.9% | 1.0% | |
| 5 | 0.1% | 0.1% | |
| 6 | 0% | 0% |
Coalitions
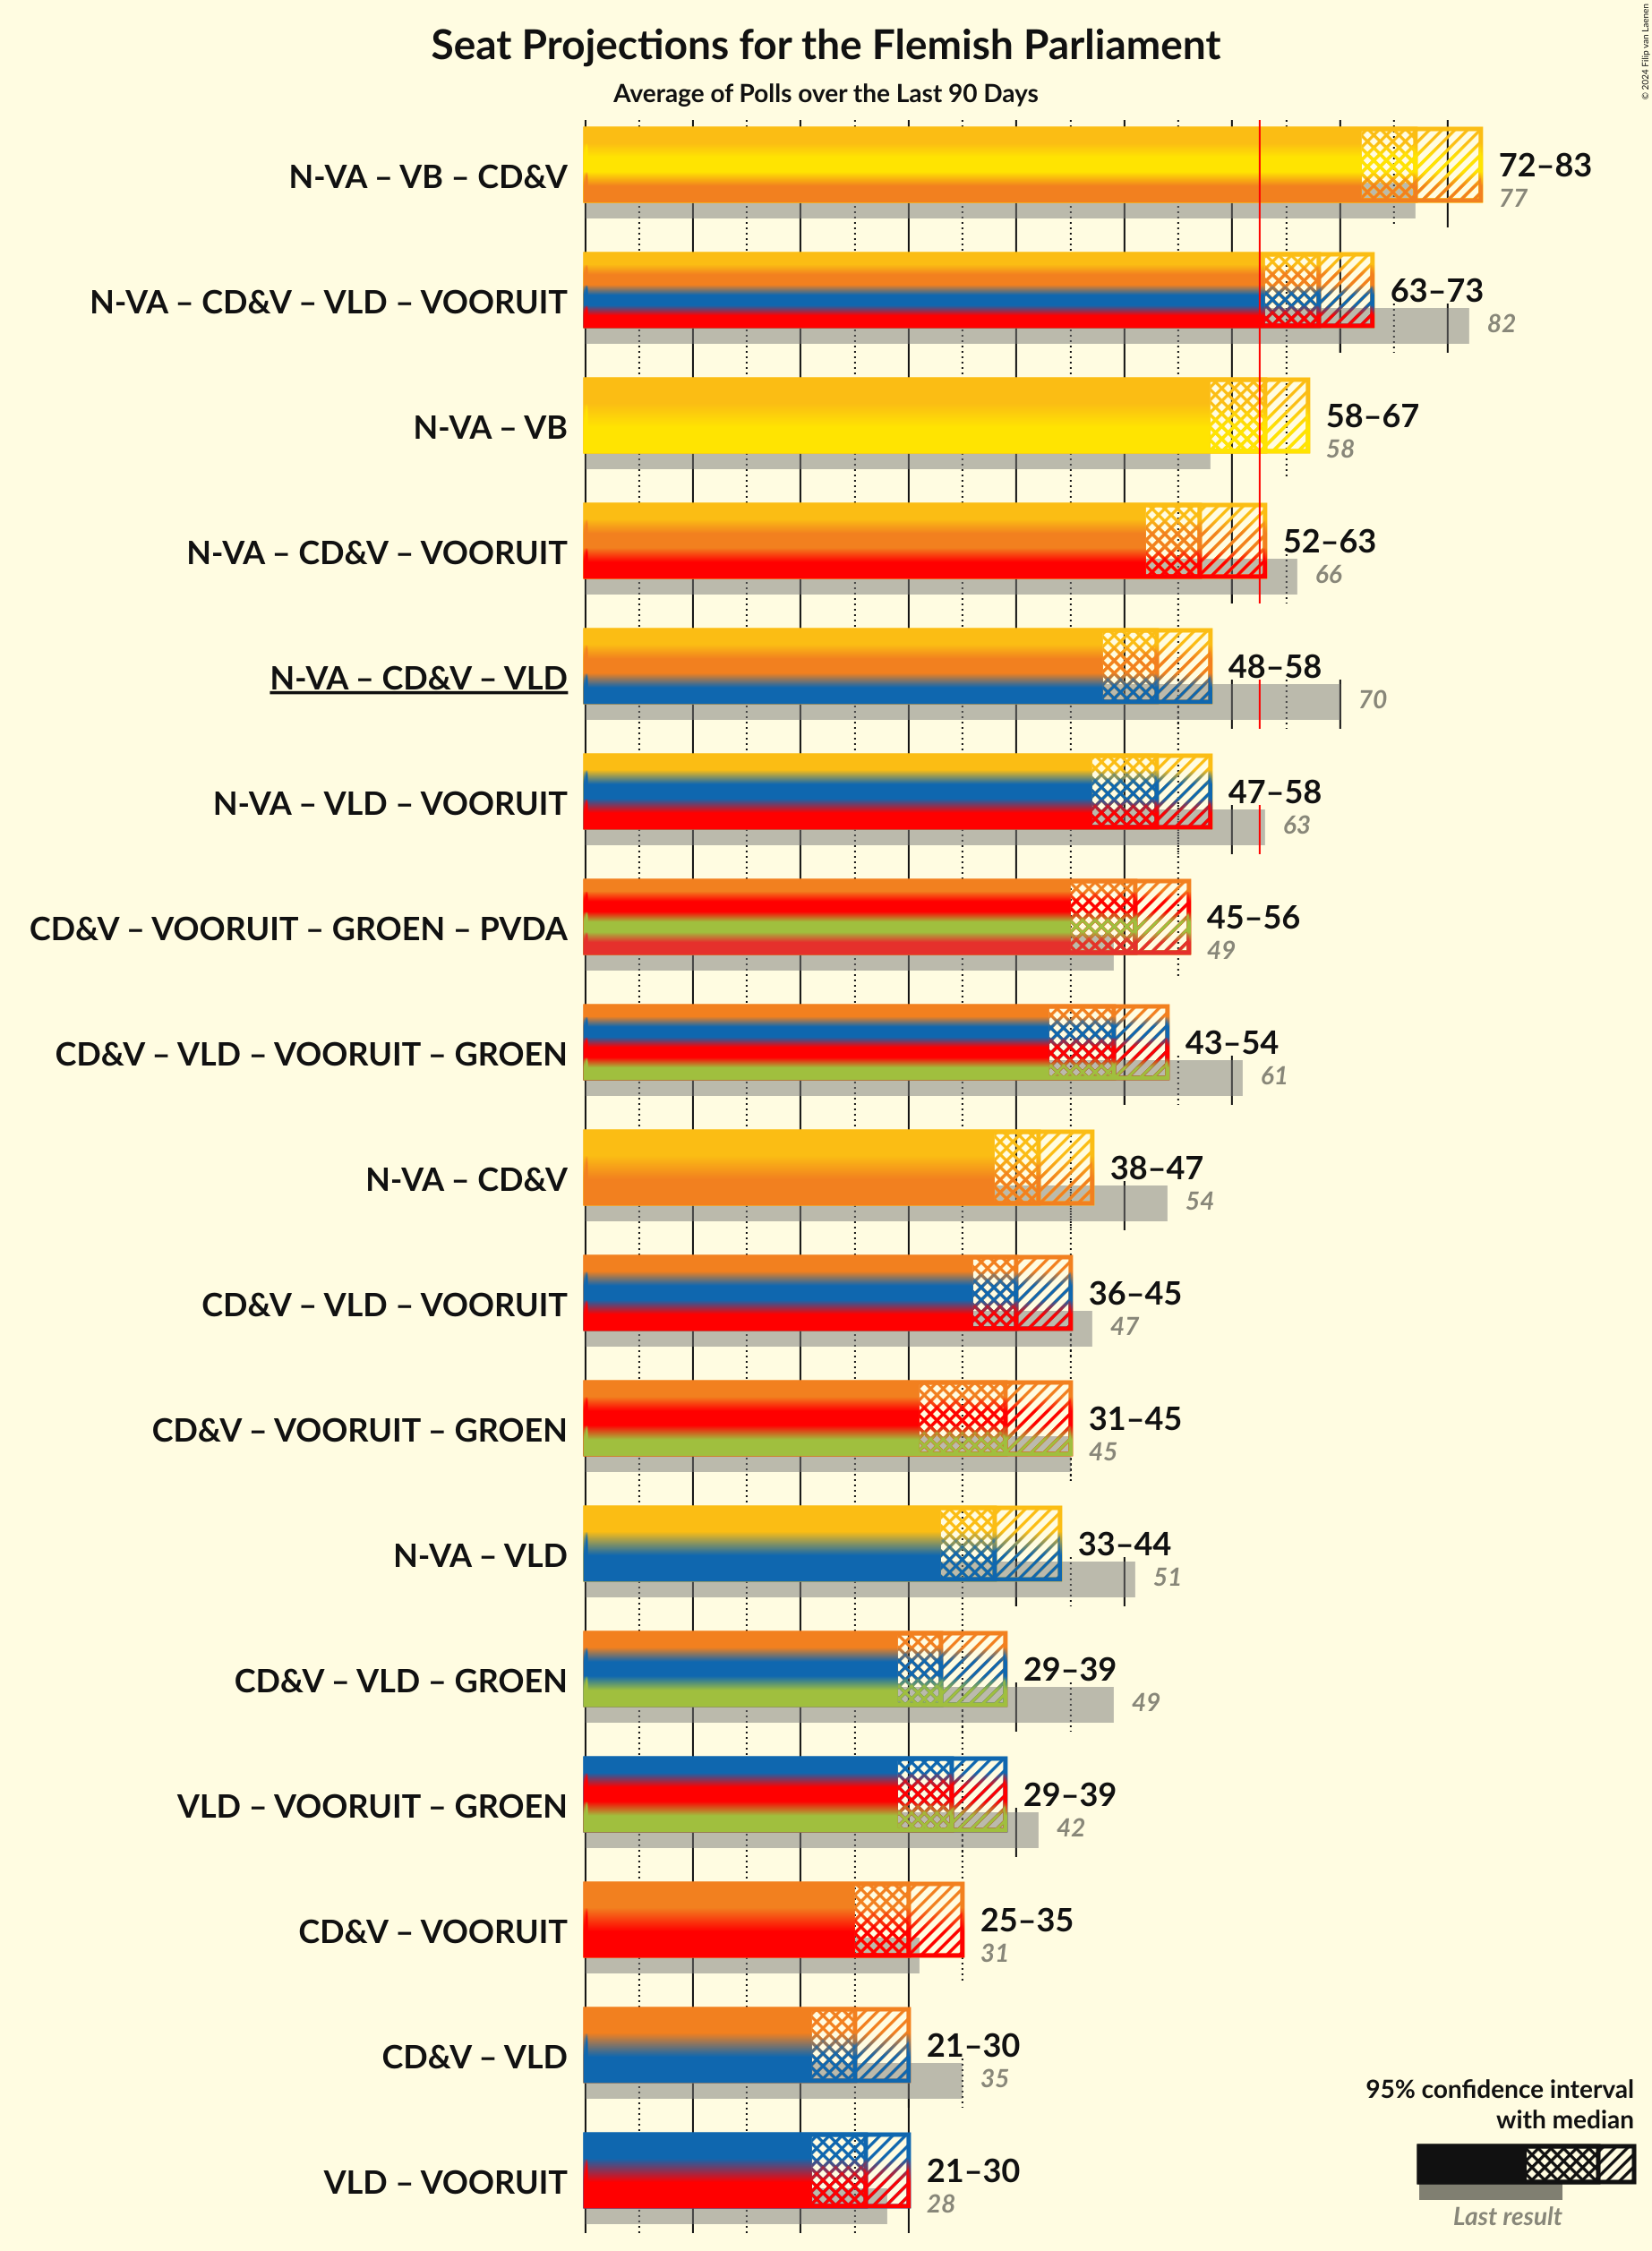
Confidence Intervals
| Coalition | Last Result | Median | Majority? | 80% Confidence Interval | 90% Confidence Interval | 95% Confidence Interval | 99% Confidence Interval |
|---|---|---|---|---|---|---|---|
| Nieuw-Vlaamse Alliantie – Vlaams Belang – Christen-Democratisch en Vlaams | 78 | 82 | 100% | 79–85 | 78–86 | 77–87 | 76–89 |
| Nieuw-Vlaamse Alliantie – Vooruit – Christen-Democratisch en Vlaams – Anders | 74 | 71 | 100% | 68–75 | 67–75 | 66–76 | 64–78 |
| Nieuw-Vlaamse Alliantie – Vlaams Belang | 62 | 65 | 83% | 62–68 | 61–70 | 60–70 | 59–72 |
| Nieuw-Vlaamse Alliantie – Vooruit – Christen-Democratisch en Vlaams | 65 | 64 | 72% | 61–67 | 60–69 | 59–69 | 58–71 |
| Nieuw-Vlaamse Alliantie – Christen-Democratisch en Vlaams – Anders | 56 | 57 | 4% | 54–61 | 53–62 | 52–63 | 51–65 |
| Nieuw-Vlaamse Alliantie – Vooruit – Anders | 58 | 54 | 0.2% | 50–58 | 49–59 | 49–60 | 47–62 |
| Vooruit – Christen-Democratisch en Vlaams – Partij van de Arbeid van België – Groen | 52 | 51 | 0% | 47–55 | 46–55 | 45–56 | 44–57 |
| Nieuw-Vlaamse Alliantie – Christen-Democratisch en Vlaams | 47 | 51 | 0% | 48–54 | 47–55 | 46–55 | 45–57 |
| Vooruit – Christen-Democratisch en Vlaams – Anders – Groen | 52 | 46 | 0% | 42–49 | 41–50 | 40–51 | 38–53 |
| Nieuw-Vlaamse Alliantie – Anders | 40 | 40 | 0% | 37–45 | 36–46 | 36–46 | 34–48 |
| Vooruit – Christen-Democratisch en Vlaams – Groen | 43 | 39 | 0% | 35–42 | 34–43 | 33–44 | 32–45 |
| Vooruit – Christen-Democratisch en Vlaams – Anders | 43 | 37 | 0% | 34–41 | 33–42 | 32–43 | 31–44 |
| Christen-Democratisch en Vlaams – Anders – Groen | 34 | 32 | 0% | 29–36 | 28–37 | 27–38 | 25–39 |
| Vooruit – Christen-Democratisch en Vlaams | 34 | 30 | 0% | 27–33 | 27–34 | 26–35 | 25–36 |
| Vooruit – Anders – Groen | 36 | 29 | 0% | 25–32 | 24–33 | 23–34 | 22–36 |
| Christen-Democratisch en Vlaams – Anders | 25 | 23 | 0% | 21–27 | 21–28 | 20–29 | 18–30 |
| Vooruit – Anders | 27 | 20 | 0% | 17–24 | 17–24 | 16–25 | 15–27 |
Nieuw-Vlaamse Alliantie – Vlaams Belang – Christen-Democratisch en Vlaams
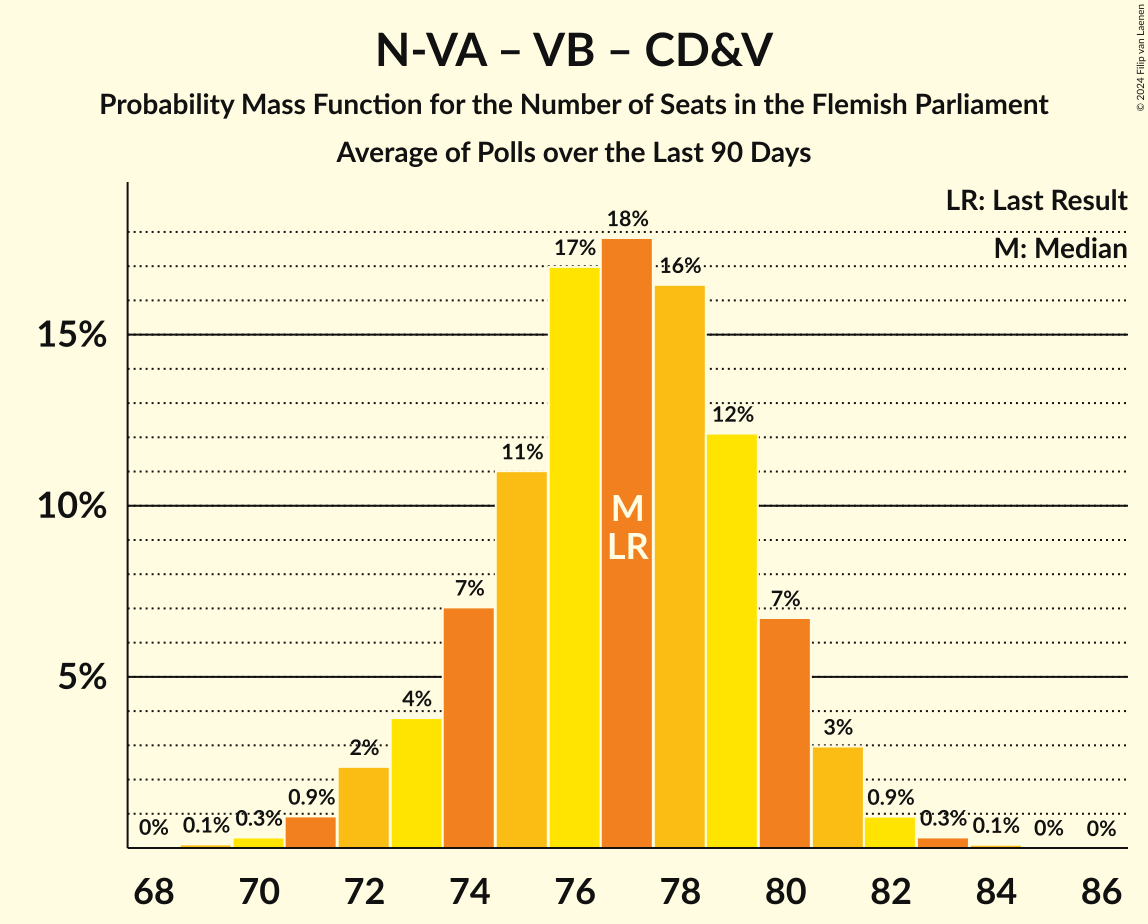
| Number of Seats | Probability | Accumulated | Special Marks |
|---|---|---|---|
| 73 | 0% | 100% | |
| 74 | 0.1% | 99.9% | |
| 75 | 0.3% | 99.9% | |
| 76 | 2% | 99.5% | |
| 77 | 3% | 98% | |
| 78 | 4% | 95% | Last Result |
| 79 | 10% | 91% | |
| 80 | 8% | 81% | |
| 81 | 12% | 73% | |
| 82 | 19% | 62% | Median |
| 83 | 14% | 43% | |
| 84 | 11% | 29% | |
| 85 | 9% | 18% | |
| 86 | 5% | 9% | |
| 87 | 2% | 4% | |
| 88 | 2% | 2% | |
| 89 | 0.4% | 0.6% | |
| 90 | 0.1% | 0.2% | |
| 91 | 0% | 0% |
Nieuw-Vlaamse Alliantie – Vooruit – Christen-Democratisch en Vlaams – Anders
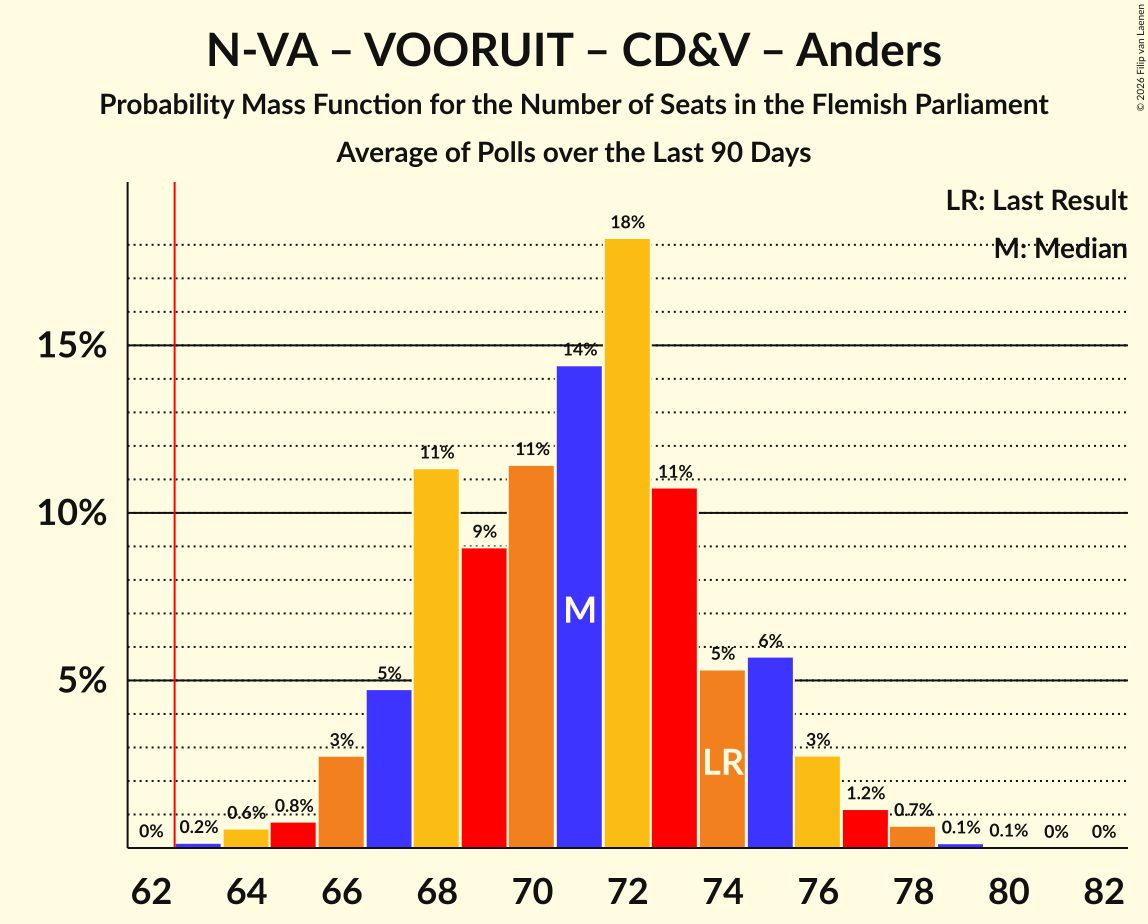
| Number of Seats | Probability | Accumulated | Special Marks |
|---|---|---|---|
| 63 | 0.2% | 100% | Majority |
| 64 | 0.6% | 99.8% | |
| 65 | 0.8% | 99.2% | |
| 66 | 3% | 98% | |
| 67 | 5% | 96% | |
| 68 | 11% | 91% | |
| 69 | 9% | 80% | |
| 70 | 11% | 71% | Median |
| 71 | 14% | 59% | |
| 72 | 18% | 45% | |
| 73 | 11% | 27% | |
| 74 | 5% | 16% | Last Result |
| 75 | 6% | 11% | |
| 76 | 3% | 5% | |
| 77 | 1.2% | 2% | |
| 78 | 0.7% | 0.9% | |
| 79 | 0.1% | 0.2% | |
| 80 | 0.1% | 0.1% | |
| 81 | 0% | 0% |
Nieuw-Vlaamse Alliantie – Vlaams Belang
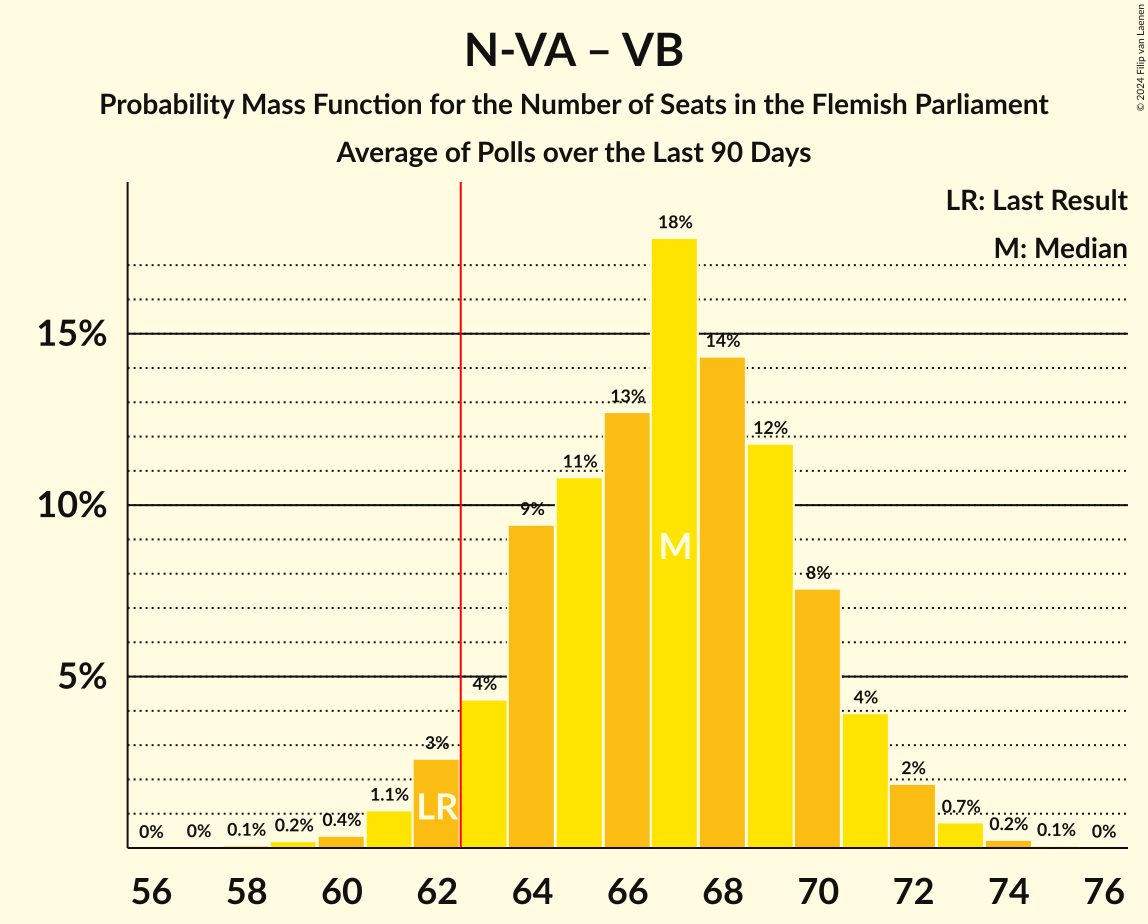
| Number of Seats | Probability | Accumulated | Special Marks |
|---|---|---|---|
| 56 | 0.1% | 100% | |
| 57 | 0.1% | 99.9% | |
| 58 | 0.2% | 99.8% | |
| 59 | 1.0% | 99.6% | |
| 60 | 3% | 98.6% | |
| 61 | 3% | 96% | |
| 62 | 9% | 93% | Last Result |
| 63 | 12% | 83% | Majority |
| 64 | 12% | 71% | |
| 65 | 13% | 59% | Median |
| 66 | 15% | 46% | |
| 67 | 11% | 30% | |
| 68 | 10% | 20% | |
| 69 | 4% | 10% | |
| 70 | 4% | 6% | |
| 71 | 1.3% | 2% | |
| 72 | 0.7% | 0.9% | |
| 73 | 0.1% | 0.2% | |
| 74 | 0.1% | 0.1% | |
| 75 | 0% | 0% |
Nieuw-Vlaamse Alliantie – Vooruit – Christen-Democratisch en Vlaams
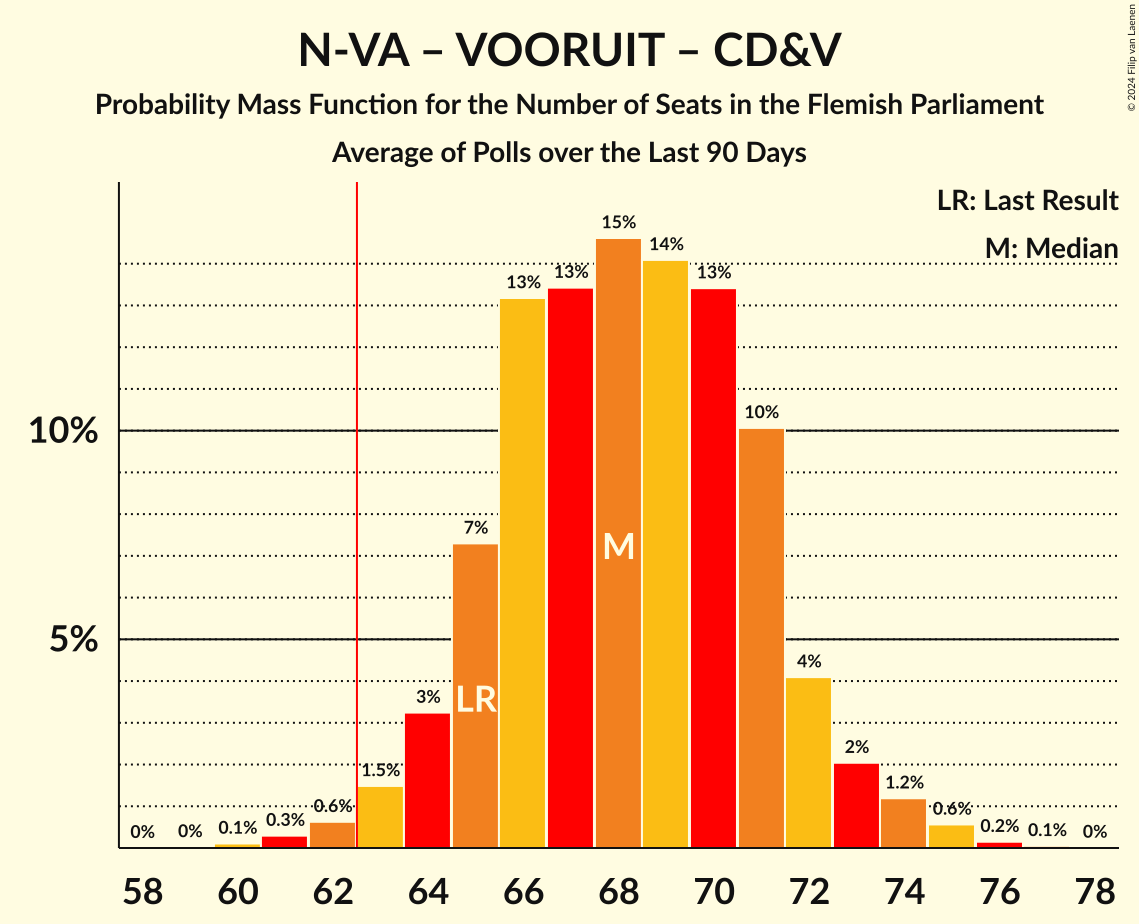
| Number of Seats | Probability | Accumulated | Special Marks |
|---|---|---|---|
| 56 | 0.1% | 100% | |
| 57 | 0.3% | 99.9% | |
| 58 | 1.1% | 99.6% | |
| 59 | 2% | 98% | |
| 60 | 4% | 96% | |
| 61 | 8% | 92% | |
| 62 | 13% | 85% | |
| 63 | 14% | 72% | Majority |
| 64 | 15% | 57% | Median |
| 65 | 14% | 42% | Last Result |
| 66 | 11% | 28% | |
| 67 | 7% | 17% | |
| 68 | 5% | 10% | |
| 69 | 3% | 5% | |
| 70 | 1.4% | 2% | |
| 71 | 0.5% | 0.7% | |
| 72 | 0.1% | 0.2% | |
| 73 | 0% | 0.1% | |
| 74 | 0% | 0% |
Nieuw-Vlaamse Alliantie – Christen-Democratisch en Vlaams – Anders
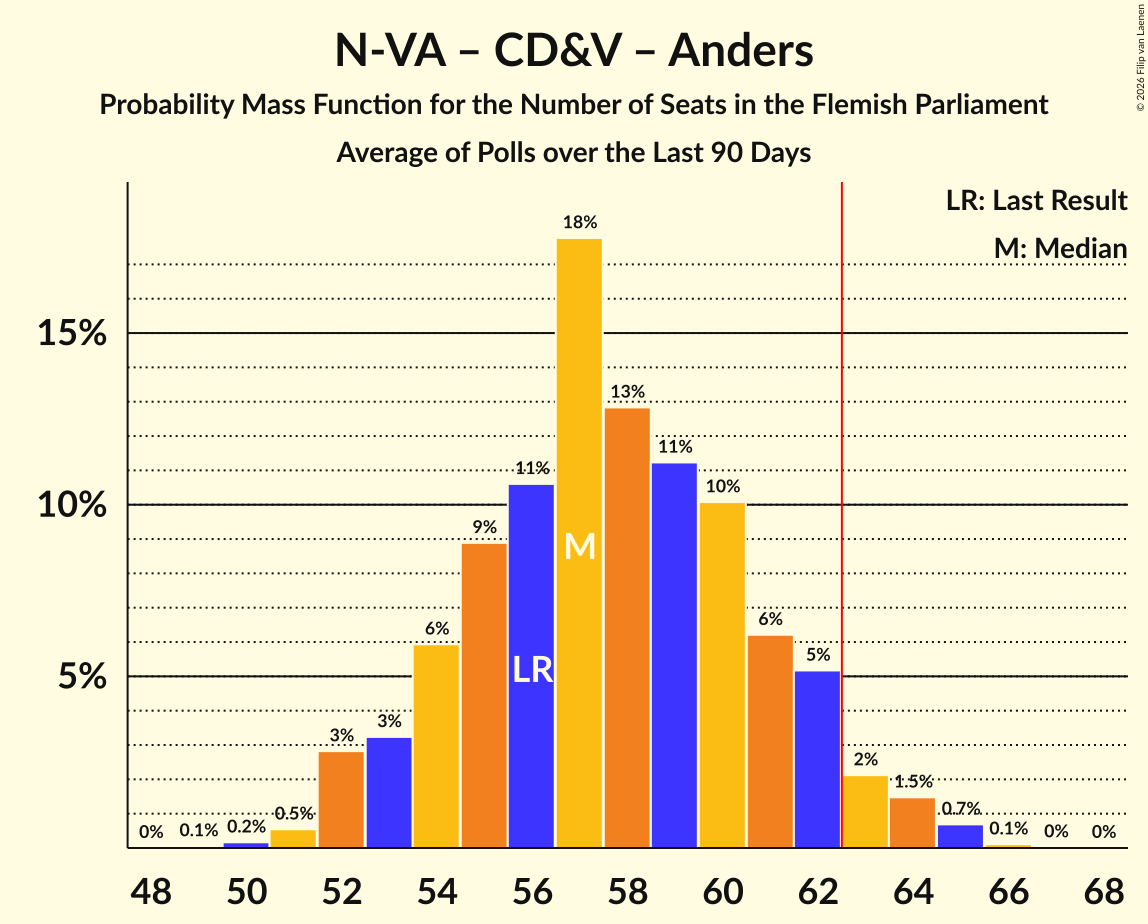
| Number of Seats | Probability | Accumulated | Special Marks |
|---|---|---|---|
| 49 | 0.1% | 100% | |
| 50 | 0.2% | 99.9% | |
| 51 | 0.5% | 99.8% | |
| 52 | 3% | 99.2% | |
| 53 | 3% | 96% | |
| 54 | 6% | 93% | |
| 55 | 9% | 87% | |
| 56 | 11% | 78% | Last Result |
| 57 | 18% | 68% | Median |
| 58 | 13% | 50% | |
| 59 | 11% | 37% | |
| 60 | 10% | 26% | |
| 61 | 6% | 16% | |
| 62 | 5% | 10% | |
| 63 | 2% | 4% | Majority |
| 64 | 1.5% | 2% | |
| 65 | 0.7% | 0.8% | |
| 66 | 0.1% | 0.1% | |
| 67 | 0% | 0% |
Nieuw-Vlaamse Alliantie – Vooruit – Anders
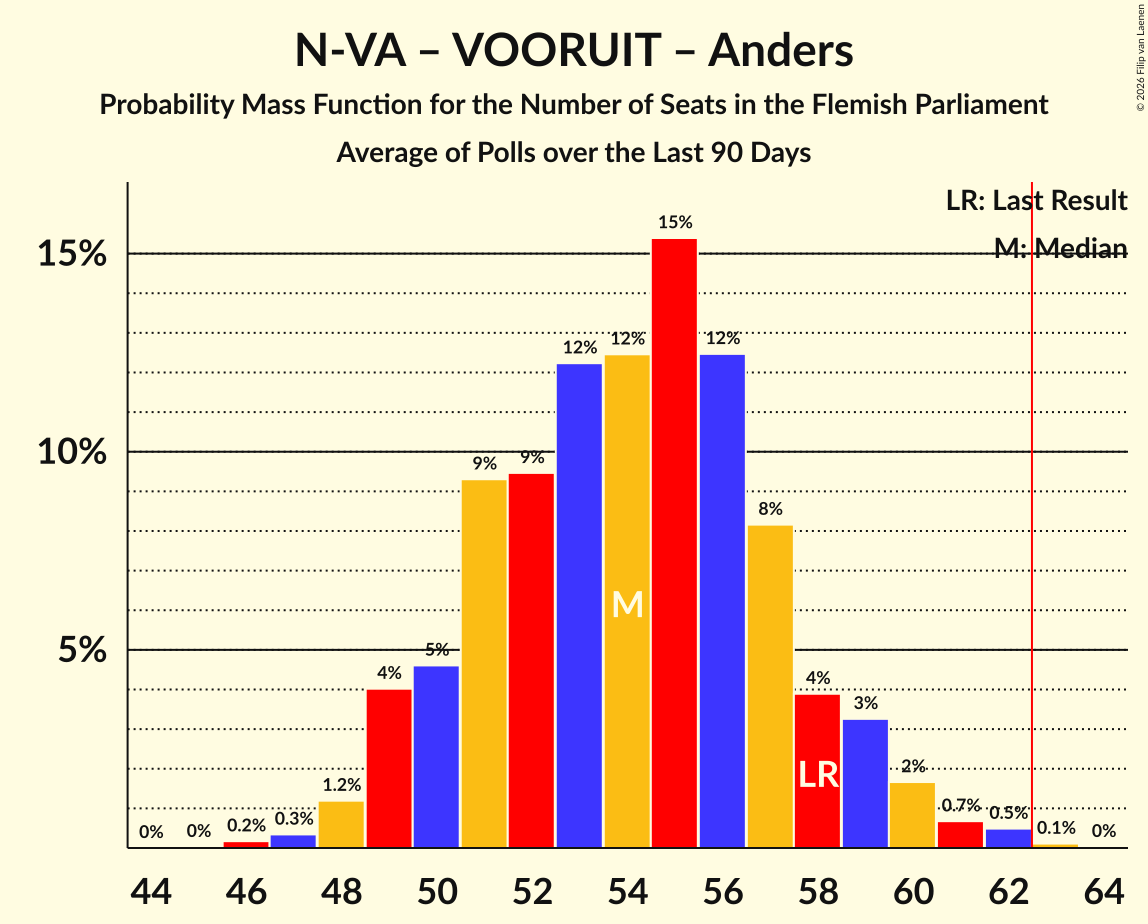
| Number of Seats | Probability | Accumulated | Special Marks |
|---|---|---|---|
| 46 | 0.2% | 100% | |
| 47 | 0.3% | 99.8% | |
| 48 | 1.2% | 99.4% | |
| 49 | 4% | 98% | |
| 50 | 5% | 94% | |
| 51 | 9% | 90% | |
| 52 | 9% | 80% | |
| 53 | 12% | 71% | Median |
| 54 | 12% | 59% | |
| 55 | 15% | 46% | |
| 56 | 12% | 31% | |
| 57 | 8% | 18% | |
| 58 | 4% | 10% | Last Result |
| 59 | 3% | 6% | |
| 60 | 2% | 3% | |
| 61 | 0.7% | 1.3% | |
| 62 | 0.5% | 0.6% | |
| 63 | 0.1% | 0.2% | Majority |
| 64 | 0% | 0% |
Vooruit – Christen-Democratisch en Vlaams – Partij van de Arbeid van België – Groen
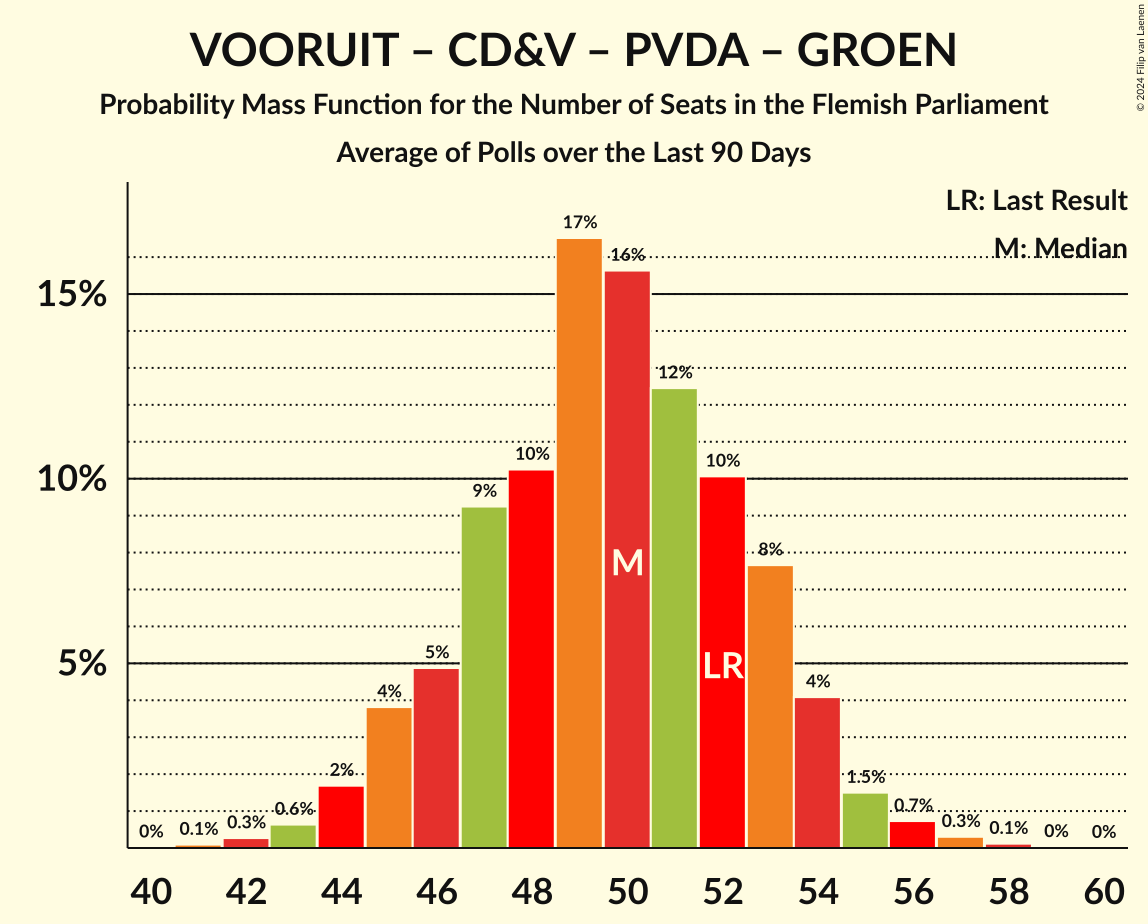
| Number of Seats | Probability | Accumulated | Special Marks |
|---|---|---|---|
| 42 | 0.1% | 100% | |
| 43 | 0.3% | 99.9% | |
| 44 | 0.7% | 99.6% | |
| 45 | 4% | 98.9% | |
| 46 | 4% | 95% | |
| 47 | 8% | 91% | |
| 48 | 8% | 83% | |
| 49 | 9% | 74% | |
| 50 | 11% | 65% | |
| 51 | 9% | 54% | Median |
| 52 | 13% | 45% | Last Result |
| 53 | 11% | 32% | |
| 54 | 10% | 21% | |
| 55 | 7% | 11% | |
| 56 | 3% | 4% | |
| 57 | 0.7% | 1.0% | |
| 58 | 0.2% | 0.3% | |
| 59 | 0.1% | 0.1% | |
| 60 | 0% | 0% |
Nieuw-Vlaamse Alliantie – Christen-Democratisch en Vlaams
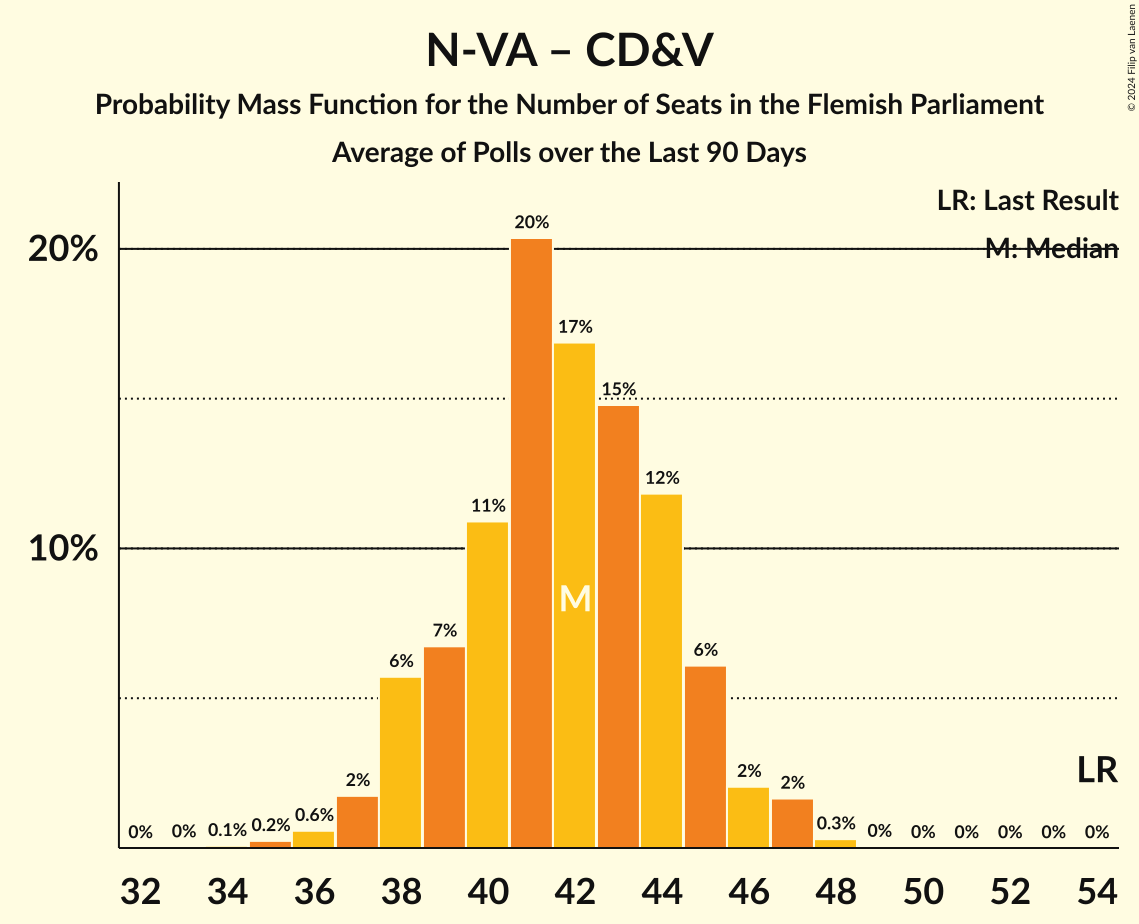
| Number of Seats | Probability | Accumulated | Special Marks |
|---|---|---|---|
| 43 | 0.1% | 100% | |
| 44 | 0.2% | 99.9% | |
| 45 | 0.9% | 99.7% | |
| 46 | 3% | 98.8% | |
| 47 | 6% | 96% | Last Result |
| 48 | 10% | 90% | |
| 49 | 10% | 80% | |
| 50 | 16% | 70% | |
| 51 | 16% | 54% | Median |
| 52 | 15% | 38% | |
| 53 | 11% | 23% | |
| 54 | 5% | 12% | |
| 55 | 5% | 7% | |
| 56 | 1.4% | 2% | |
| 57 | 0.6% | 1.0% | |
| 58 | 0.3% | 0.3% | |
| 59 | 0% | 0.1% | |
| 60 | 0% | 0% |
Vooruit – Christen-Democratisch en Vlaams – Anders – Groen
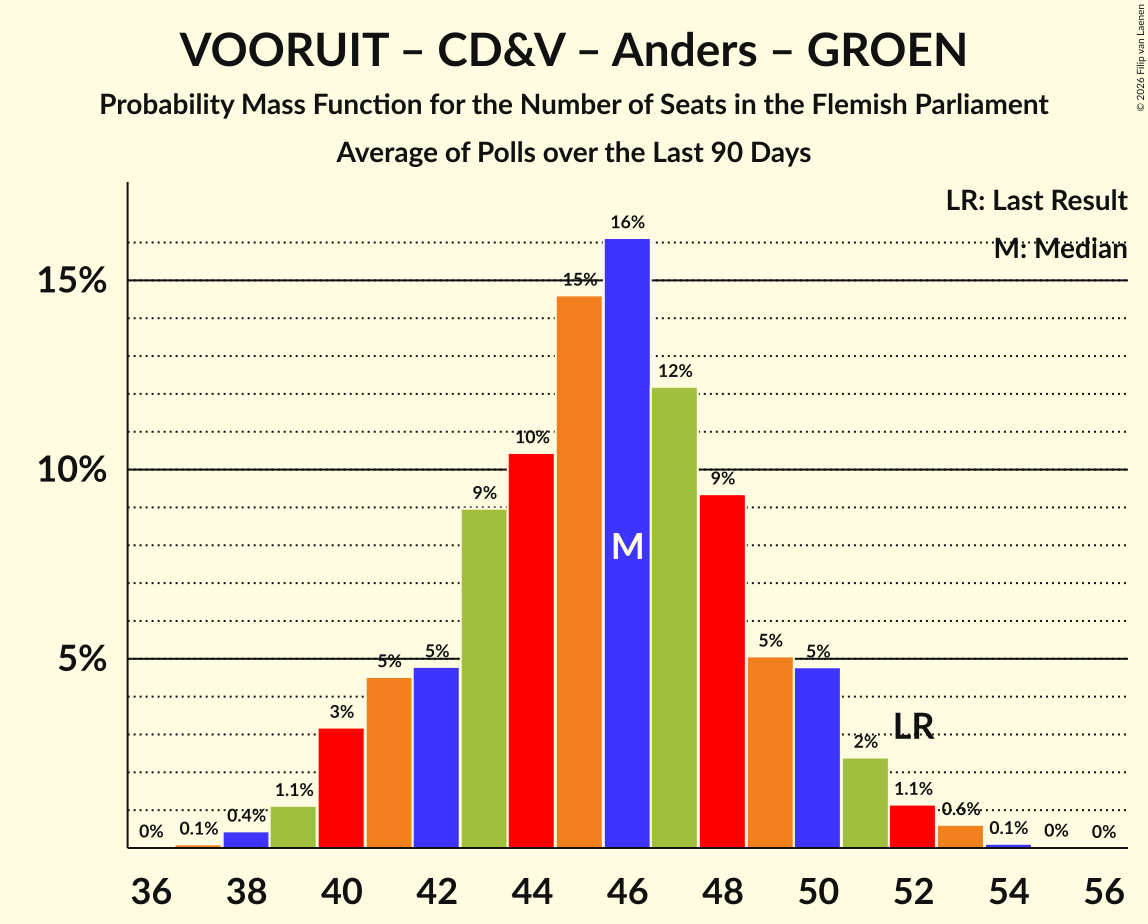
| Number of Seats | Probability | Accumulated | Special Marks |
|---|---|---|---|
| 37 | 0.1% | 100% | |
| 38 | 0.4% | 99.9% | |
| 39 | 1.1% | 99.4% | |
| 40 | 3% | 98% | |
| 41 | 5% | 95% | |
| 42 | 5% | 91% | |
| 43 | 9% | 86% | |
| 44 | 10% | 77% | |
| 45 | 15% | 66% | Median |
| 46 | 16% | 52% | |
| 47 | 12% | 36% | |
| 48 | 9% | 24% | |
| 49 | 5% | 14% | |
| 50 | 5% | 9% | |
| 51 | 2% | 4% | |
| 52 | 1.1% | 2% | Last Result |
| 53 | 0.6% | 0.8% | |
| 54 | 0.1% | 0.2% | |
| 55 | 0% | 0.1% | |
| 56 | 0% | 0% |
Nieuw-Vlaamse Alliantie – Anders
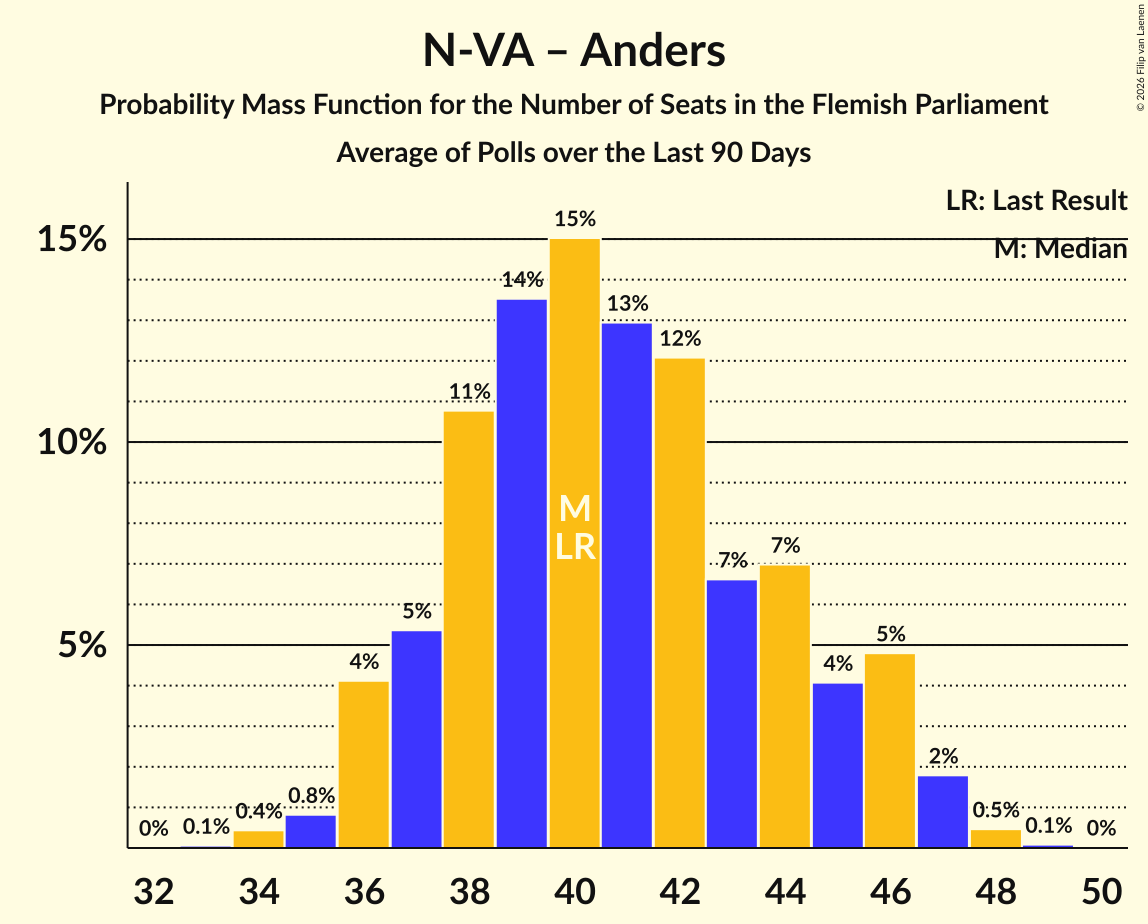
| Number of Seats | Probability | Accumulated | Special Marks |
|---|---|---|---|
| 33 | 0.1% | 100% | |
| 34 | 0.4% | 99.9% | |
| 35 | 0.8% | 99.5% | |
| 36 | 4% | 98.7% | |
| 37 | 5% | 95% | |
| 38 | 11% | 89% | |
| 39 | 14% | 78% | |
| 40 | 15% | 65% | Last Result, Median |
| 41 | 13% | 50% | |
| 42 | 12% | 37% | |
| 43 | 7% | 25% | |
| 44 | 7% | 18% | |
| 45 | 4% | 11% | |
| 46 | 5% | 7% | |
| 47 | 2% | 2% | |
| 48 | 0.5% | 0.6% | |
| 49 | 0.1% | 0.1% | |
| 50 | 0% | 0% |
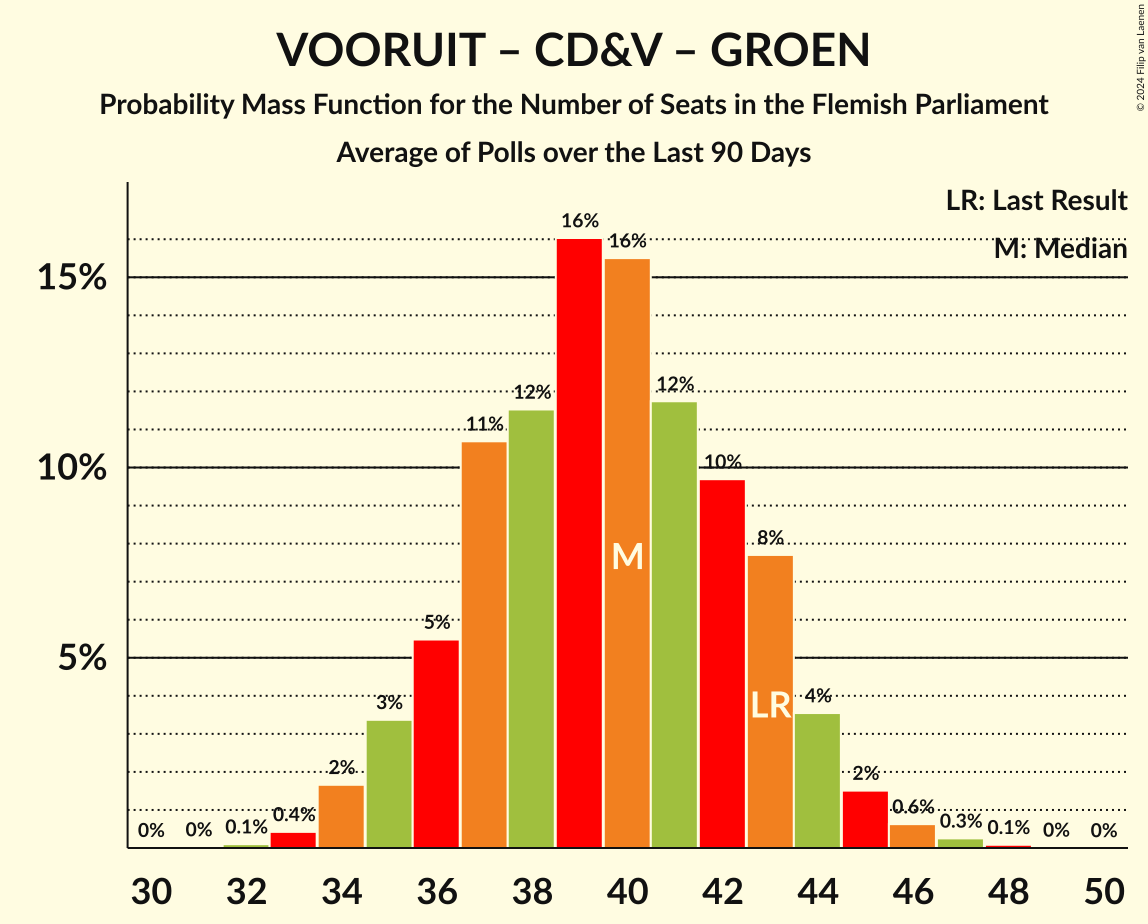
Vooruit – Christen-Democratisch en Vlaams – Groen
| Number of Seats | Probability | Accumulated | Special Marks |
|---|---|---|---|
| 30 | 0.1% | 100% | |
| 31 | 0.2% | 99.9% | |
| 32 | 0.8% | 99.7% | |
| 33 | 2% | 99.0% | |
| 34 | 5% | 97% | |
| 35 | 10% | 93% | |
| 36 | 8% | 83% | |
| 37 | 9% | 75% | |
| 38 | 11% | 66% | |
| 39 | 13% | 55% | Median |
| 40 | 15% | 41% | |
| 41 | 13% | 26% | |
| 42 | 7% | 14% | |
| 43 | 3% | 6% | Last Result |
| 44 | 2% | 3% | |
| 45 | 1.0% | 1.3% | |
| 46 | 0.2% | 0.3% | |
| 47 | 0.1% | 0.1% | |
| 48 | 0% | 0% |
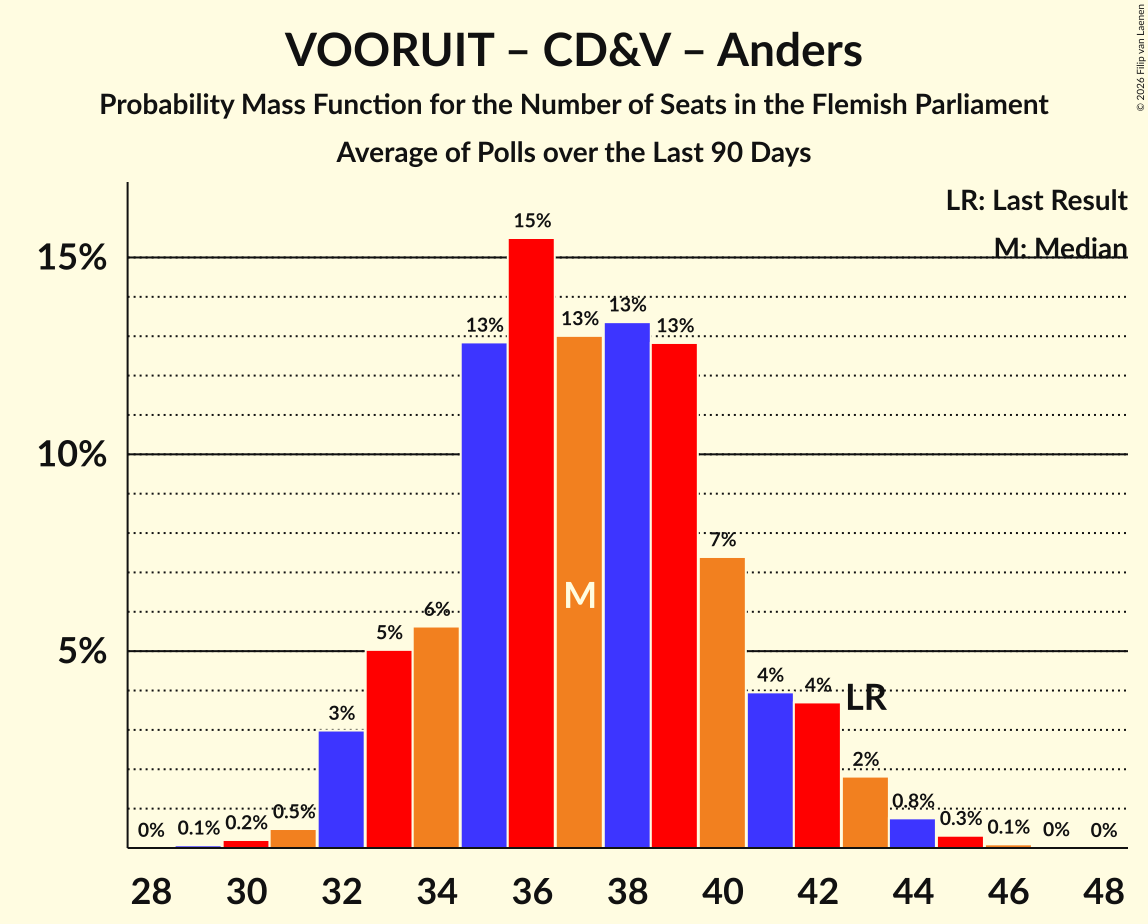
Vooruit – Christen-Democratisch en Vlaams – Anders
| Number of Seats | Probability | Accumulated | Special Marks |
|---|---|---|---|
| 29 | 0.1% | 100% | |
| 30 | 0.2% | 99.9% | |
| 31 | 0.5% | 99.7% | |
| 32 | 3% | 99.2% | |
| 33 | 5% | 96% | |
| 34 | 6% | 91% | |
| 35 | 13% | 86% | |
| 36 | 15% | 73% | Median |
| 37 | 13% | 57% | |
| 38 | 13% | 44% | |
| 39 | 13% | 31% | |
| 40 | 7% | 18% | |
| 41 | 4% | 11% | |
| 42 | 4% | 7% | |
| 43 | 2% | 3% | Last Result |
| 44 | 0.8% | 1.2% | |
| 45 | 0.3% | 0.4% | |
| 46 | 0.1% | 0.1% | |
| 47 | 0% | 0% |
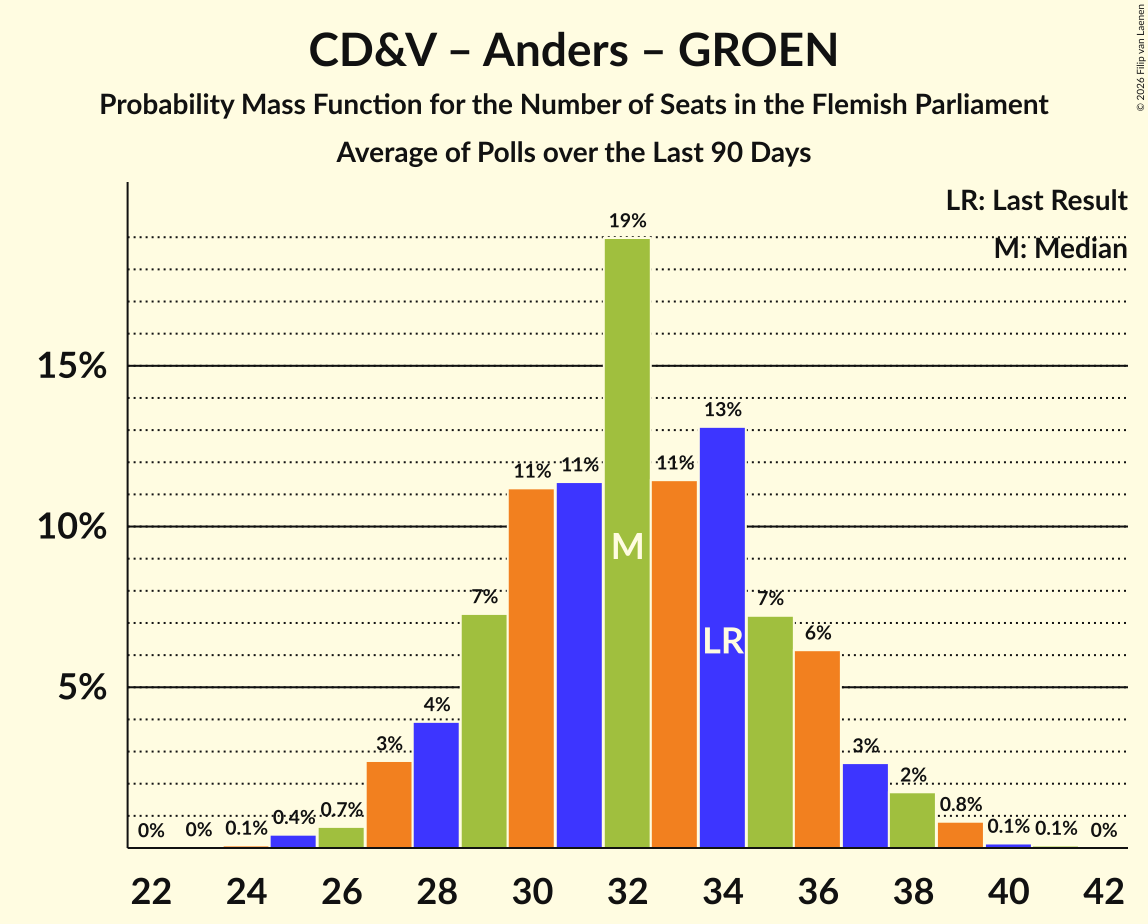
Christen-Democratisch en Vlaams – Anders – Groen
| Number of Seats | Probability | Accumulated | Special Marks |
|---|---|---|---|
| 24 | 0.1% | 100% | |
| 25 | 0.4% | 99.9% | |
| 26 | 0.7% | 99.5% | |
| 27 | 3% | 98.8% | |
| 28 | 4% | 96% | |
| 29 | 7% | 92% | |
| 30 | 11% | 85% | |
| 31 | 11% | 74% | |
| 32 | 19% | 62% | Median |
| 33 | 11% | 43% | |
| 34 | 13% | 32% | Last Result |
| 35 | 7% | 19% | |
| 36 | 6% | 12% | |
| 37 | 3% | 5% | |
| 38 | 2% | 3% | |
| 39 | 0.8% | 1.1% | |
| 40 | 0.1% | 0.2% | |
| 41 | 0.1% | 0.1% | |
| 42 | 0% | 0% |
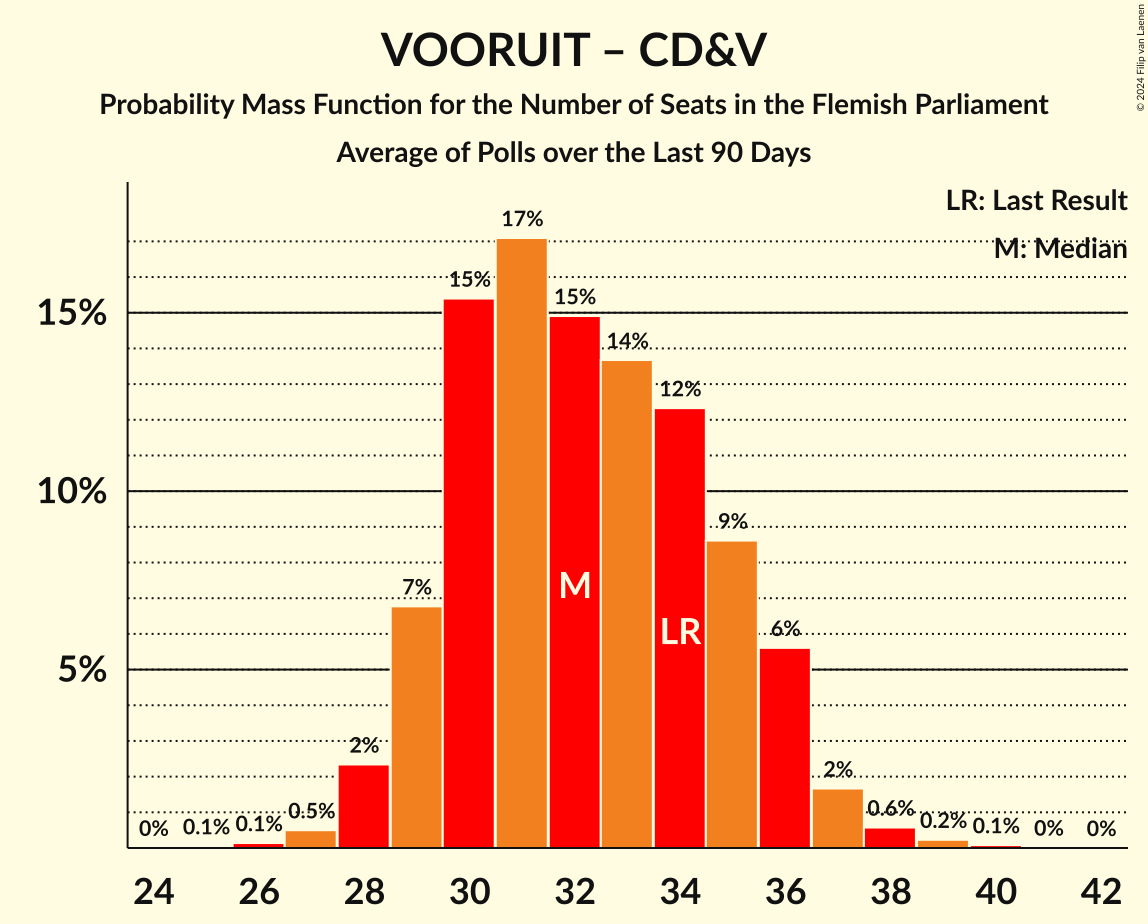
Vooruit – Christen-Democratisch en Vlaams
| Number of Seats | Probability | Accumulated | Special Marks |
|---|---|---|---|
| 23 | 0.1% | 100% | |
| 24 | 0.2% | 99.9% | |
| 25 | 0.8% | 99.7% | |
| 26 | 3% | 98.9% | |
| 27 | 12% | 96% | |
| 28 | 8% | 84% | |
| 29 | 14% | 77% | |
| 30 | 19% | 63% | Median |
| 31 | 15% | 44% | |
| 32 | 12% | 29% | |
| 33 | 8% | 17% | |
| 34 | 4% | 9% | Last Result |
| 35 | 2% | 4% | |
| 36 | 1.4% | 2% | |
| 37 | 0.4% | 0.4% | |
| 38 | 0.1% | 0.1% | |
| 39 | 0% | 0% |
Vooruit – Anders – Groen
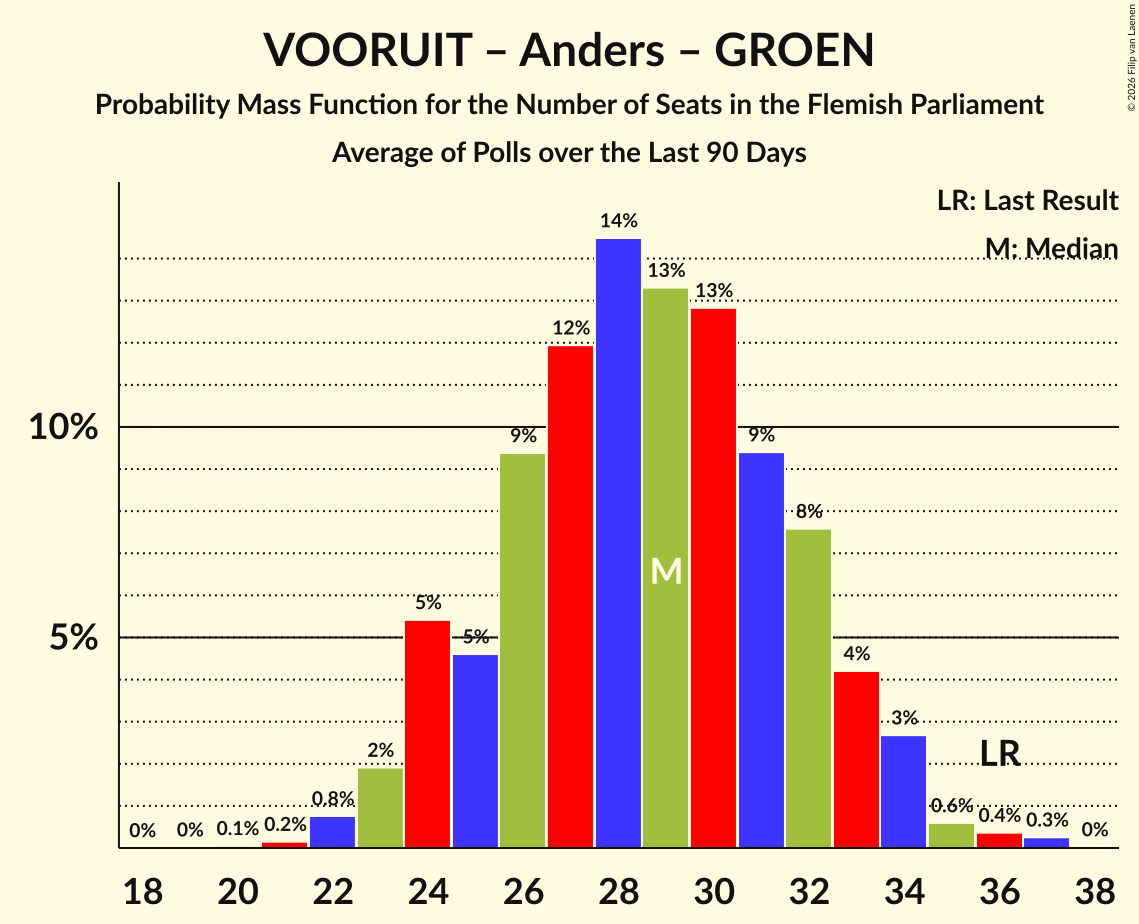
| Number of Seats | Probability | Accumulated | Special Marks |
|---|---|---|---|
| 20 | 0.1% | 100% | |
| 21 | 0.2% | 99.9% | |
| 22 | 0.8% | 99.8% | |
| 23 | 2% | 99.0% | |
| 24 | 5% | 97% | |
| 25 | 5% | 92% | |
| 26 | 9% | 87% | |
| 27 | 12% | 78% | |
| 28 | 14% | 66% | Median |
| 29 | 13% | 51% | |
| 30 | 13% | 38% | |
| 31 | 9% | 25% | |
| 32 | 8% | 16% | |
| 33 | 4% | 8% | |
| 34 | 3% | 4% | |
| 35 | 0.6% | 1.3% | |
| 36 | 0.4% | 0.7% | Last Result |
| 37 | 0.3% | 0.3% | |
| 38 | 0% | 0% |
Christen-Democratisch en Vlaams – Anders
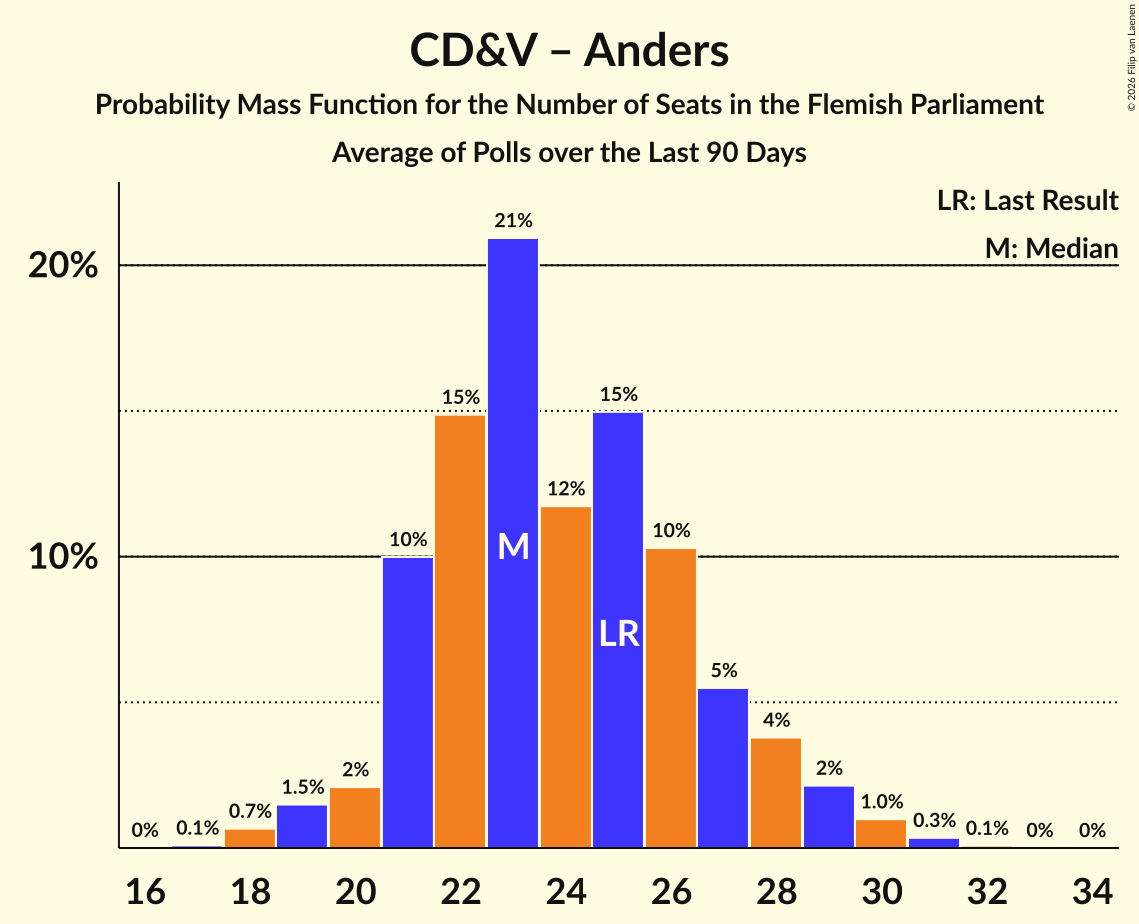
| Number of Seats | Probability | Accumulated | Special Marks |
|---|---|---|---|
| 17 | 0.1% | 100% | |
| 18 | 0.7% | 99.9% | |
| 19 | 1.5% | 99.2% | |
| 20 | 2% | 98% | |
| 21 | 10% | 96% | |
| 22 | 15% | 86% | |
| 23 | 21% | 71% | Median |
| 24 | 12% | 50% | |
| 25 | 15% | 38% | Last Result |
| 26 | 10% | 23% | |
| 27 | 5% | 13% | |
| 28 | 4% | 7% | |
| 29 | 2% | 4% | |
| 30 | 1.0% | 1.4% | |
| 31 | 0.3% | 0.4% | |
| 32 | 0.1% | 0.1% | |
| 33 | 0% | 0% |
Vooruit – Anders
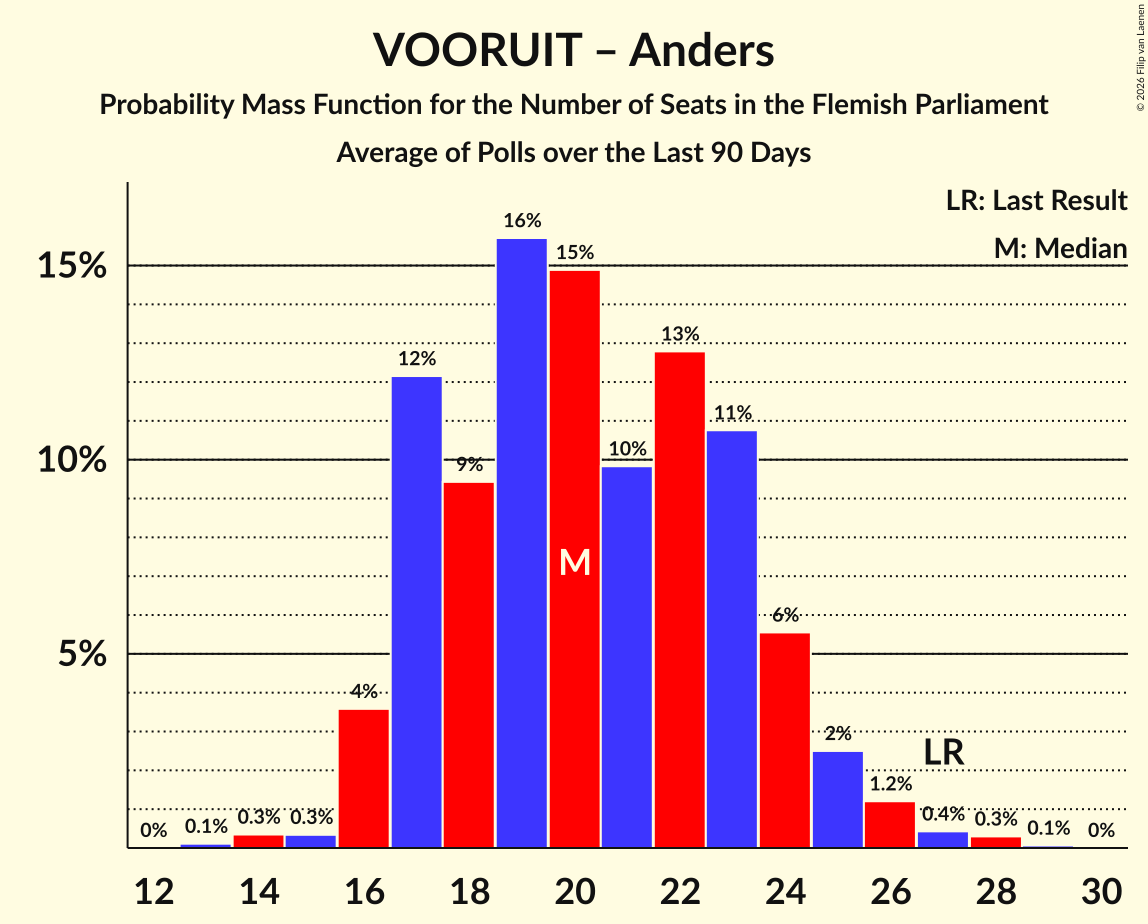
| Number of Seats | Probability | Accumulated | Special Marks |
|---|---|---|---|
| 13 | 0.1% | 100% | |
| 14 | 0.3% | 99.9% | |
| 15 | 0.3% | 99.5% | |
| 16 | 4% | 99.2% | |
| 17 | 12% | 96% | |
| 18 | 9% | 83% | |
| 19 | 16% | 74% | Median |
| 20 | 15% | 58% | |
| 21 | 10% | 43% | |
| 22 | 13% | 34% | |
| 23 | 11% | 21% | |
| 24 | 6% | 10% | |
| 25 | 2% | 5% | |
| 26 | 1.2% | 2% | |
| 27 | 0.4% | 0.8% | Last Result |
| 28 | 0.3% | 0.4% | |
| 29 | 0.1% | 0.1% | |
| 30 | 0% | 0% |
Technical Information
- Number of polls included in this average: 1
- Lowest number of simulations done in a poll included in this average: 2,097,152
- Total number of simulations done in the polls included in this average: 2,097,152
- Error estimate: 1.20%