Poll Average
Voting Intentions | Seats | Coalitions | Technical Information
Summary
The table below lists the polls on which the average is based. They are the most recent polls (less than 90 days old) registered and analyzed so far.
| Period | Polling firm/Commissioner(s) | SDPS | JV | ZZS | NA | NSL | LRA | LKS | VL | LA | JKP | KPV | PAR | AP! | P |
|---|---|---|---|---|---|---|---|---|---|---|---|---|---|---|---|
| 4 October 2014 | General Election | 23.0% 24 |
21.9% 23 |
19.5% 21 |
16.6% 17 |
6.8% 7 |
6.7% 8 |
1.6% 0 |
1.2% 0 |
0.9% 0 |
0.7% 0 |
0.0% 0 |
0.0% 0 |
0.9% 0 |
0.0% 0 |
| N/A | Poll Average | 19–30% 22–34 |
4–10% 0–10 |
10–19% 11–24 |
6–13% 6–15 |
0–4% 0 |
0–5% 0–6 |
0–5% 0 |
N/A N/A |
N/A N/A |
7–16% 7–16 |
9–18% 9–22 |
N/A N/A |
6–14% 7–15 |
1–4% 0 |
| 24–30 September 2018 | FACTUM | 19–22% 22–25 |
8–10% 8–10 |
10–12% 11–14 |
11–13% 12–14 |
N/A N/A |
2–4% 0 |
1% 0 |
N/A N/A |
N/A N/A |
13–16% 15–17 |
11–13% 11–14 |
N/A N/A |
12–14% 13–15 |
2–4% 0 |
| 8–18 September 2018 | SKDS Latvijas Televīzija |
24–32% 27–36 |
5–8% 0–10 |
13–18% 15–23 |
9–14% 10–15 |
1–4% 0 |
2–5% 0–7 |
2–4% 0 |
N/A N/A |
N/A N/A |
6–11% 7–13 |
8–13% 9–15 |
N/A N/A |
6–11% 7–12 |
1–3% 0 |
| 10–14 September 2018 | Norstat | 18–28% 22–34 |
3–9% 0–10 |
11–19% 14–24 |
6–13% 6–15 |
N/A N/A |
1–5% 0 |
2–6% 0–7 |
N/A N/A |
N/A N/A |
7–14% 8–16 |
10–17% 11–22 |
N/A N/A |
5–11% 7–14 |
1–4% 0 |
| 8 August–12 September 2018 | Kantar TNS Delfi |
23–29% 26–33 |
4–8% 0–8 |
14–20% 17–24 |
6–10% 6–12 |
0–1% 0 |
0–2% 0 |
0–2% 0 |
N/A N/A |
N/A N/A |
7–12% 7–14 |
14–19% 15–23 |
N/A N/A |
5–9% 7–10 |
1–2% 0 |
| 4 October 2014 | General Election | 23.0% 24 |
21.9% 23 |
19.5% 21 |
16.6% 17 |
6.8% 7 |
6.7% 8 |
1.6% 0 |
1.2% 0 |
0.9% 0 |
0.7% 0 |
0.0% 0 |
0.0% 0 |
0.9% 0 |
0.0% 0 |
Only polls for which at least the sample size has been published are included in the table above.
Legend:
- Top half of each row: Voting intentions (95% confidence interval)
- Bottom half of each row: Seat projections for the Saeima (95% confidence interval)
- SDPS: Sociāldemokrātiskā Partija “Saskaņa”
- JV: Vienotība
- ZZS: Zaļo un Zemnieku savienība
- NA: Nacionālā apvienība „Visu Latvijai!”–„Tēvzemei un Brīvībai/LNNK”
- NSL: No sirds Latvijai
- LRA: Latvijas Reģionu apvienība
- LKS: Latvijas Krievu savienība
- VL: Vienoti Latvijai
- LA: Latvijas attīstībai
- JKP: Jaunā konservatīvā partija
- KPV: KPV LV
- PAR: Kustība Par!
- AP!: Attīstībai–Par!
- P: Progresīvie
- N/A (single party): Party not included the published results
- N/A (entire row): Calculation for this opinion poll not started yet
Voting Intentions

Confidence Intervals
| Party | Last Result | Median | 80% Confidence Interval | 90% Confidence Interval | 95% Confidence Interval | 99% Confidence Interval |
|---|---|---|---|---|---|---|
| Sociāldemokrātiskā Partija “Saskaņa” | 23.0% | 24.6% | 20.3–28.6% | 19.8–29.5% | 19.3–30.3% | 18.1–31.7% |
| Vienotība | 21.9% | 6.3% | 4.6–9.1% | 4.2–9.4% | 3.8–9.7% | 3.1–10.2% |
| Zaļo un Zemnieku savienība | 19.5% | 15.0% | 10.7–17.9% | 10.4–18.6% | 10.1–19.2% | 9.6–20.4% |
| Nacionālā apvienība „Visu Latvijai!”–„Tēvzemei un Brīvībai/LNNK” | 16.6% | 10.3% | 7.0–12.5% | 6.5–12.9% | 6.1–13.3% | 5.5–14.2% |
| No sirds Latvijai | 6.8% | 1.5% | 0.4–3.1% | 0.4–3.4% | 0.3–3.7% | 0.2–4.3% |
| Latvijas Reģionu apvienība | 6.7% | 2.8% | 0.7–4.1% | 0.6–4.5% | 0.5–4.9% | 0.3–5.6% |
| Latvijas Krievu savienība | 1.6% | 1.6% | 0.7–3.9% | 0.6–4.4% | 0.5–5.0% | 0.3–6.0% |
| Vienoti Latvijai | 1.2% | N/A | N/A | N/A | N/A | N/A |
| Latvijas attīstībai | 0.9% | N/A | N/A | N/A | N/A | N/A |
| Attīstībai–Par! | 0.9% | 8.2% | 6.3–13.1% | 5.8–13.5% | 5.5–13.8% | 4.8–14.3% |
| Jaunā konservatīvā partija | 0.7% | 9.9% | 7.8–15.1% | 7.3–15.5% | 7.0–15.8% | 6.3–16.4% |
| KPV LV | 0.0% | 12.3% | 9.7–16.7% | 9.1–17.5% | 8.6–18.1% | 7.8–19.3% |
| Kustība Par! | 0.0% | N/A | N/A | N/A | N/A | N/A |
| Progresīvie | 0.0% | 2.1% | 1.1–3.2% | 1.0–3.4% | 0.8–3.6% | 0.6–4.2% |
Sociāldemokrātiskā Partija “Saskaņa”
For a full overview of the results for this party, see the Sociāldemokrātiskā Partija “Saskaņa” page.
| Voting Intentions | Probability | Accumulated | Special Marks |
|---|---|---|---|
| 14.5–15.5% | 0% | 100% | |
| 15.5–16.5% | 0.1% | 100% | |
| 16.5–17.5% | 0.2% | 99.9% | |
| 17.5–18.5% | 0.6% | 99.7% | |
| 18.5–19.5% | 3% | 99.2% | |
| 19.5–20.5% | 10% | 97% | |
| 20.5–21.5% | 14% | 87% | |
| 21.5–22.5% | 9% | 72% | |
| 22.5–23.5% | 6% | 64% | Last Result |
| 23.5–24.5% | 8% | 58% | |
| 24.5–25.5% | 10% | 50% | Median |
| 25.5–26.5% | 11% | 40% | |
| 26.5–27.5% | 10% | 29% | |
| 27.5–28.5% | 8% | 19% | |
| 28.5–29.5% | 6% | 11% | |
| 29.5–30.5% | 3% | 5% | |
| 30.5–31.5% | 1.3% | 2% | |
| 31.5–32.5% | 0.5% | 0.6% | |
| 32.5–33.5% | 0.1% | 0.2% | |
| 33.5–34.5% | 0% | 0% |
Vienotība
For a full overview of the results for this party, see the Vienotība page.
| Voting Intentions | Probability | Accumulated | Special Marks |
|---|---|---|---|
| 0.5–1.5% | 0% | 100% | |
| 1.5–2.5% | 0.1% | 100% | |
| 2.5–3.5% | 1.3% | 99.9% | |
| 3.5–4.5% | 8% | 98.6% | |
| 4.5–5.5% | 21% | 91% | |
| 5.5–6.5% | 26% | 70% | Median |
| 6.5–7.5% | 14% | 44% | |
| 7.5–8.5% | 10% | 30% | |
| 8.5–9.5% | 16% | 20% | |
| 9.5–10.5% | 4% | 4% | |
| 10.5–11.5% | 0.1% | 0.1% | |
| 11.5–12.5% | 0% | 0% | |
| 12.5–13.5% | 0% | 0% | |
| 13.5–14.5% | 0% | 0% | |
| 14.5–15.5% | 0% | 0% | |
| 15.5–16.5% | 0% | 0% | |
| 16.5–17.5% | 0% | 0% | |
| 17.5–18.5% | 0% | 0% | |
| 18.5–19.5% | 0% | 0% | |
| 19.5–20.5% | 0% | 0% | |
| 20.5–21.5% | 0% | 0% | |
| 21.5–22.5% | 0% | 0% | Last Result |
Zaļo un Zemnieku savienība
For a full overview of the results for this party, see the Zaļo un Zemnieku savienība page.
| Voting Intentions | Probability | Accumulated | Special Marks |
|---|---|---|---|
| 7.5–8.5% | 0% | 100% | |
| 8.5–9.5% | 0.4% | 100% | |
| 9.5–10.5% | 7% | 99.6% | |
| 10.5–11.5% | 15% | 93% | |
| 11.5–12.5% | 6% | 78% | |
| 12.5–13.5% | 6% | 72% | |
| 13.5–14.5% | 10% | 66% | |
| 14.5–15.5% | 14% | 56% | Median |
| 15.5–16.5% | 15% | 42% | |
| 16.5–17.5% | 13% | 26% | |
| 17.5–18.5% | 8% | 14% | |
| 18.5–19.5% | 4% | 5% | |
| 19.5–20.5% | 1.3% | 2% | Last Result |
| 20.5–21.5% | 0.3% | 0.4% | |
| 21.5–22.5% | 0.1% | 0.1% | |
| 22.5–23.5% | 0% | 0% |
Nacionālā apvienība „Visu Latvijai!”–„Tēvzemei un Brīvībai/LNNK”
For a full overview of the results for this party, see the Nacionālā apvienība „Visu Latvijai!”–„Tēvzemei un Brīvībai/LNNK” page.
| Voting Intentions | Probability | Accumulated | Special Marks |
|---|---|---|---|
| 3.5–4.5% | 0% | 100% | |
| 4.5–5.5% | 0.6% | 100% | |
| 5.5–6.5% | 5% | 99.4% | |
| 6.5–7.5% | 12% | 95% | |
| 7.5–8.5% | 14% | 83% | |
| 8.5–9.5% | 11% | 69% | |
| 9.5–10.5% | 11% | 58% | Median |
| 10.5–11.5% | 17% | 47% | |
| 11.5–12.5% | 21% | 30% | |
| 12.5–13.5% | 7% | 9% | |
| 13.5–14.5% | 1.2% | 1.5% | |
| 14.5–15.5% | 0.2% | 0.2% | |
| 15.5–16.5% | 0% | 0% | |
| 16.5–17.5% | 0% | 0% | Last Result |
No sirds Latvijai
For a full overview of the results for this party, see the No sirds Latvijai page.
| Voting Intentions | Probability | Accumulated | Special Marks |
|---|---|---|---|
| 0.0–0.5% | 16% | 100% | |
| 0.5–1.5% | 35% | 84% | Median |
| 1.5–2.5% | 25% | 49% | |
| 2.5–3.5% | 21% | 25% | |
| 3.5–4.5% | 3% | 4% | |
| 4.5–5.5% | 0.2% | 0.2% | |
| 5.5–6.5% | 0% | 0% | |
| 6.5–7.5% | 0% | 0% | Last Result |
Latvijas Reģionu apvienība
For a full overview of the results for this party, see the Latvijas Reģionu apvienība page.
| Voting Intentions | Probability | Accumulated | Special Marks |
|---|---|---|---|
| 0.0–0.5% | 4% | 100% | |
| 0.5–1.5% | 21% | 96% | |
| 1.5–2.5% | 14% | 74% | |
| 2.5–3.5% | 40% | 61% | Median |
| 3.5–4.5% | 16% | 20% | |
| 4.5–5.5% | 4% | 5% | |
| 5.5–6.5% | 0.5% | 0.6% | |
| 6.5–7.5% | 0% | 0.1% | Last Result |
| 7.5–8.5% | 0% | 0% |
Latvijas Krievu savienība
For a full overview of the results for this party, see the Latvijas Krievu savienība page.
| Voting Intentions | Probability | Accumulated | Special Marks |
|---|---|---|---|
| 0.0–0.5% | 4% | 100% | |
| 0.5–1.5% | 45% | 96% | |
| 1.5–2.5% | 14% | 51% | Last Result, Median |
| 2.5–3.5% | 22% | 37% | |
| 3.5–4.5% | 11% | 15% | |
| 4.5–5.5% | 3% | 4% | |
| 5.5–6.5% | 0.9% | 1.1% | |
| 6.5–7.5% | 0.2% | 0.2% | |
| 7.5–8.5% | 0% | 0% |
Attīstībai–Par!
For a full overview of the results for this party, see the Attīstībai–Par! page.
| Voting Intentions | Probability | Accumulated | Special Marks |
|---|---|---|---|
| 0.5–1.5% | 0% | 100% | Last Result |
| 1.5–2.5% | 0% | 100% | |
| 2.5–3.5% | 0% | 100% | |
| 3.5–4.5% | 0.2% | 100% | |
| 4.5–5.5% | 3% | 99.8% | |
| 5.5–6.5% | 12% | 97% | |
| 6.5–7.5% | 21% | 86% | |
| 7.5–8.5% | 20% | 65% | Median |
| 8.5–9.5% | 12% | 45% | |
| 9.5–10.5% | 5% | 32% | |
| 10.5–11.5% | 2% | 27% | |
| 11.5–12.5% | 7% | 25% | |
| 12.5–13.5% | 13% | 18% | |
| 13.5–14.5% | 4% | 4% | |
| 14.5–15.5% | 0.2% | 0.2% | |
| 15.5–16.5% | 0% | 0% |
Jaunā konservatīvā partija
For a full overview of the results for this party, see the Jaunā konservatīvā partija page.
| Voting Intentions | Probability | Accumulated | Special Marks |
|---|---|---|---|
| 0.5–1.5% | 0% | 100% | Last Result |
| 1.5–2.5% | 0% | 100% | |
| 2.5–3.5% | 0% | 100% | |
| 3.5–4.5% | 0% | 100% | |
| 4.5–5.5% | 0.1% | 100% | |
| 5.5–6.5% | 1.0% | 99.9% | |
| 6.5–7.5% | 6% | 99.0% | |
| 7.5–8.5% | 16% | 93% | |
| 8.5–9.5% | 21% | 77% | |
| 9.5–10.5% | 16% | 57% | Median |
| 10.5–11.5% | 9% | 41% | |
| 11.5–12.5% | 4% | 32% | |
| 12.5–13.5% | 3% | 28% | |
| 13.5–14.5% | 8% | 26% | |
| 14.5–15.5% | 13% | 17% | |
| 15.5–16.5% | 4% | 4% | |
| 16.5–17.5% | 0.3% | 0.3% | |
| 17.5–18.5% | 0% | 0% |
KPV LV
For a full overview of the results for this party, see the KPV LV page.
| Voting Intentions | Probability | Accumulated | Special Marks |
|---|---|---|---|
| 0.0–0.5% | 0% | 100% | Last Result |
| 0.5–1.5% | 0% | 100% | |
| 1.5–2.5% | 0% | 100% | |
| 2.5–3.5% | 0% | 100% | |
| 3.5–4.5% | 0% | 100% | |
| 4.5–5.5% | 0% | 100% | |
| 5.5–6.5% | 0% | 100% | |
| 6.5–7.5% | 0.3% | 100% | |
| 7.5–8.5% | 2% | 99.7% | |
| 8.5–9.5% | 6% | 98% | |
| 9.5–10.5% | 10% | 91% | |
| 10.5–11.5% | 16% | 82% | |
| 11.5–12.5% | 20% | 66% | Median |
| 12.5–13.5% | 10% | 45% | |
| 13.5–14.5% | 7% | 35% | |
| 14.5–15.5% | 8% | 28% | |
| 15.5–16.5% | 9% | 20% | |
| 16.5–17.5% | 6% | 11% | |
| 17.5–18.5% | 3% | 5% | |
| 18.5–19.5% | 1.1% | 1.4% | |
| 19.5–20.5% | 0.3% | 0.3% | |
| 20.5–21.5% | 0% | 0.1% | |
| 21.5–22.5% | 0% | 0% |
Progresīvie
For a full overview of the results for this party, see the Progresīvie page.
| Voting Intentions | Probability | Accumulated | Special Marks |
|---|---|---|---|
| 0.0–0.5% | 0.3% | 100% | Last Result |
| 0.5–1.5% | 27% | 99.7% | |
| 1.5–2.5% | 38% | 73% | Median |
| 2.5–3.5% | 32% | 35% | |
| 3.5–4.5% | 3% | 3% | |
| 4.5–5.5% | 0.2% | 0.2% | |
| 5.5–6.5% | 0% | 0% |
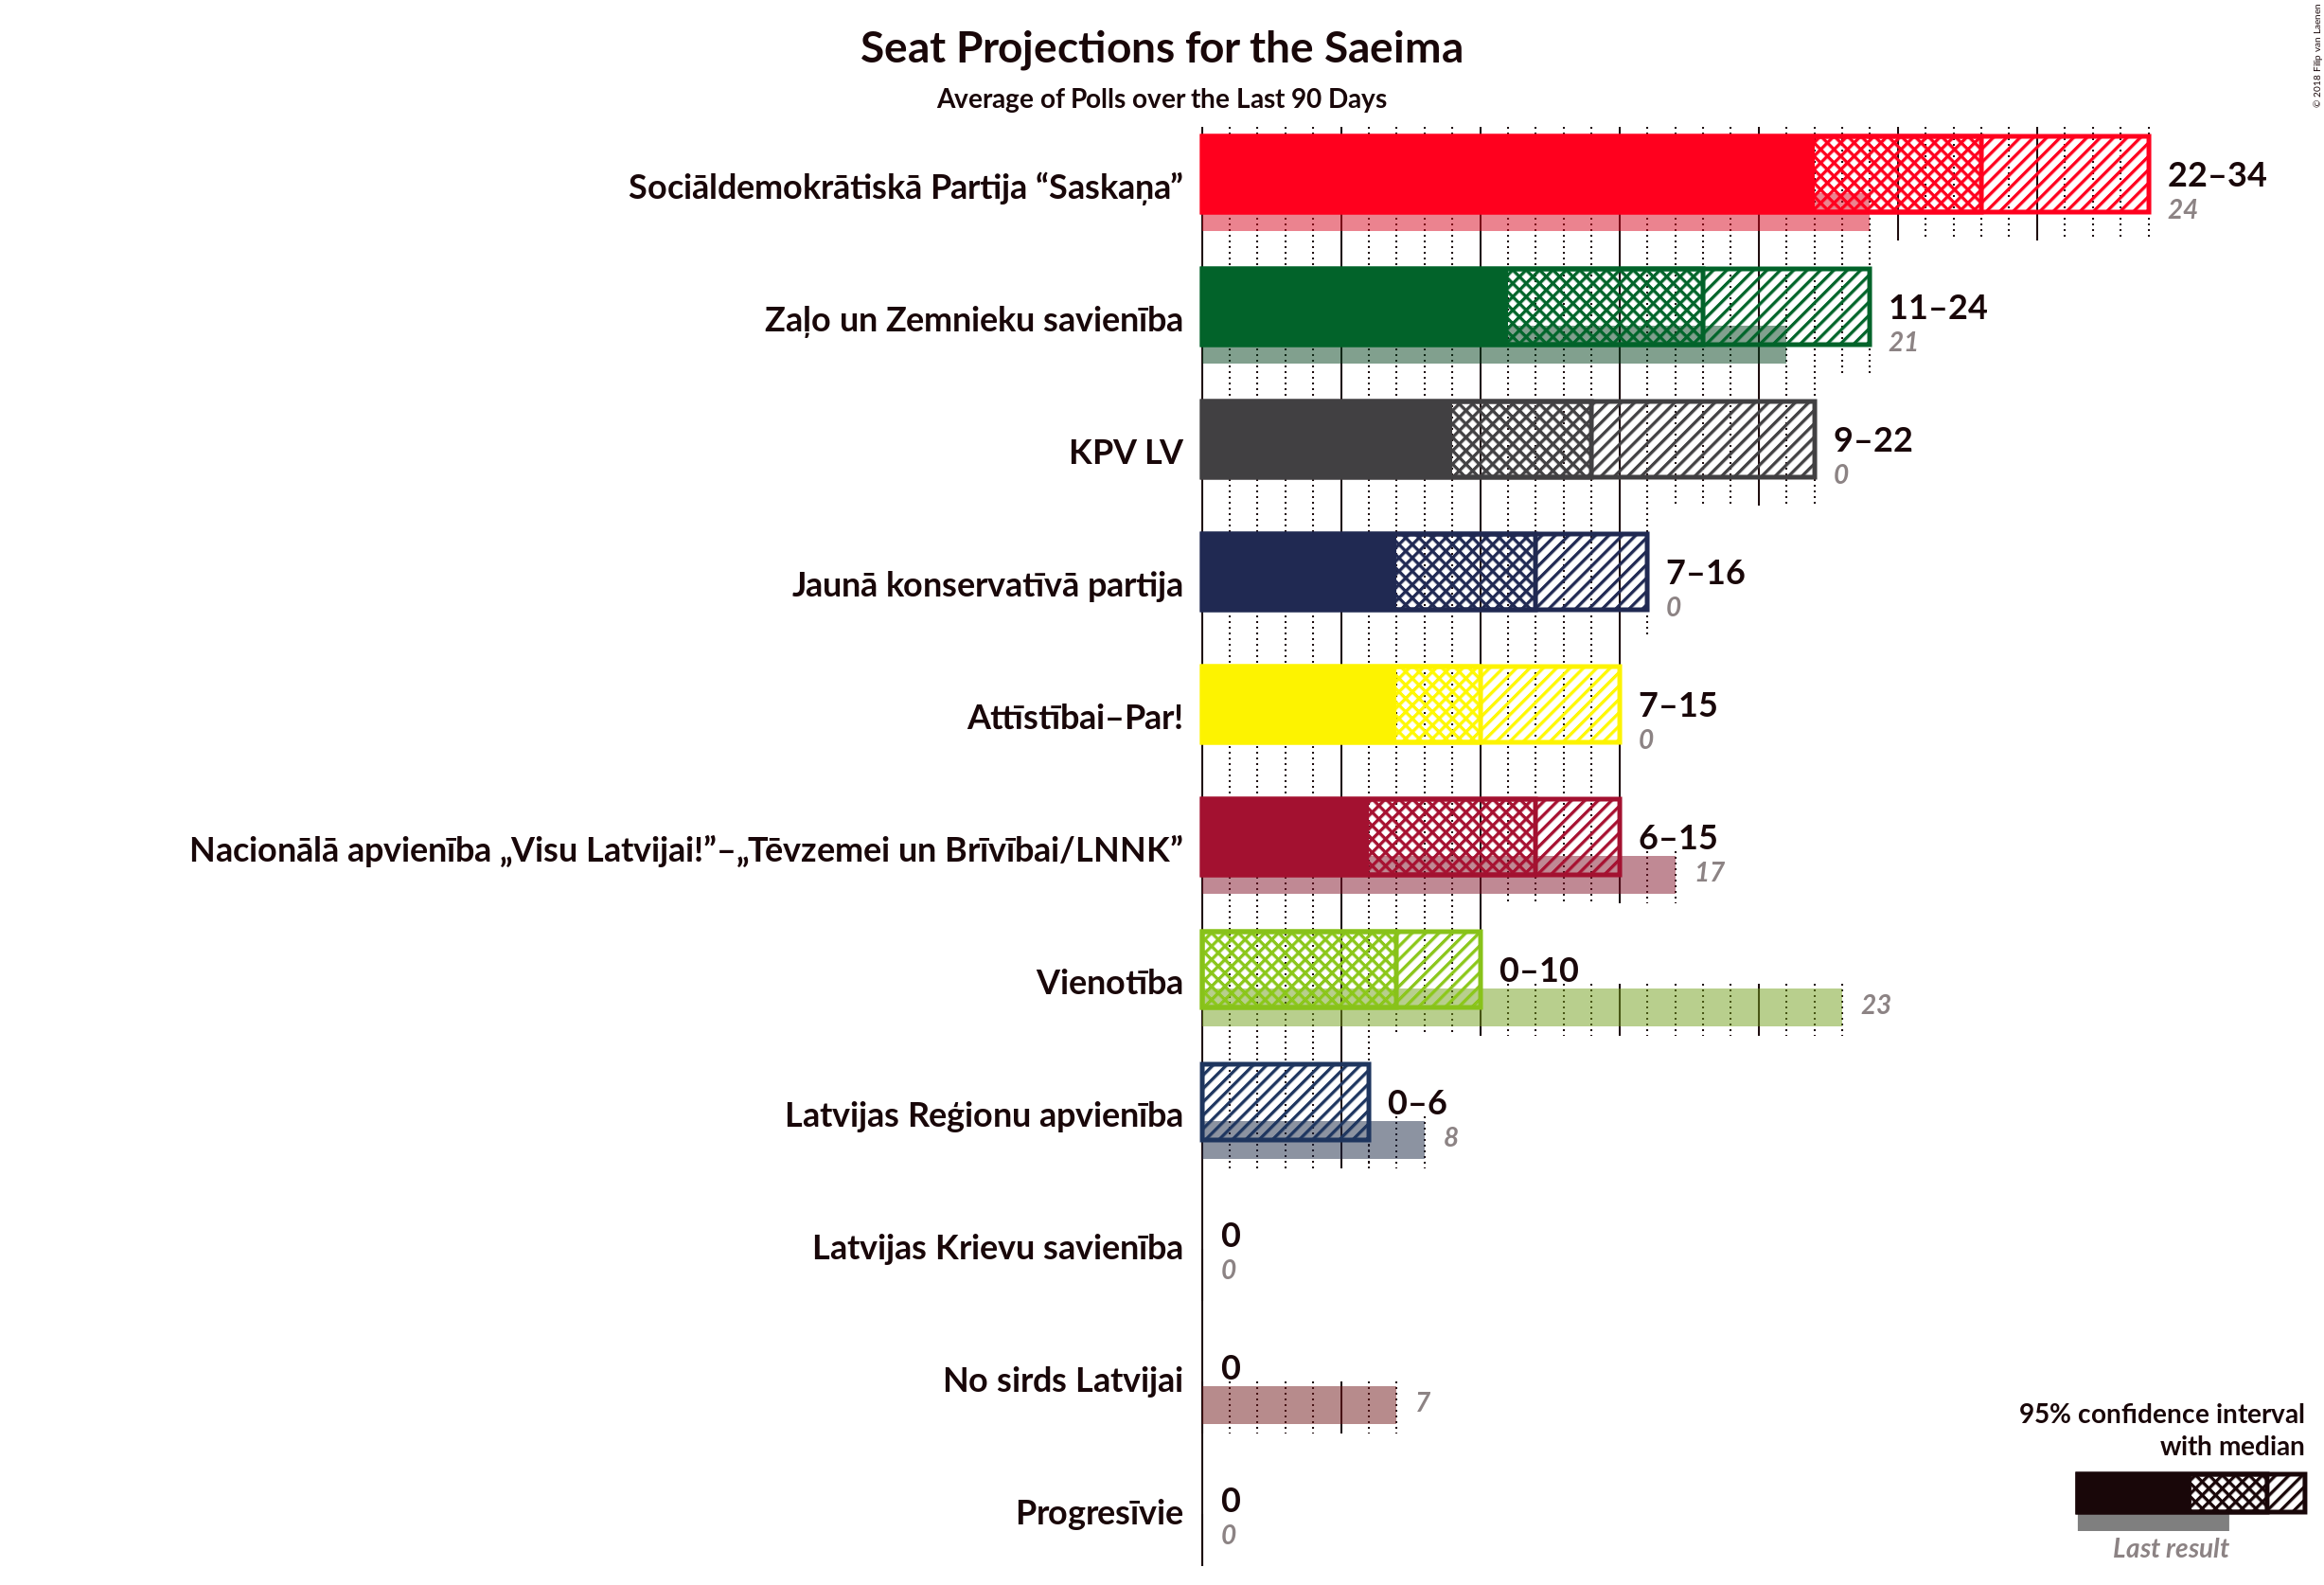
Seats
Confidence Intervals
| Party | Last Result | Median | 80% Confidence Interval | 90% Confidence Interval | 95% Confidence Interval | 99% Confidence Interval |
|---|---|---|---|---|---|---|
| Sociāldemokrātiskā Partija “Saskaņa” | 24 | 28 | 22–33 | 22–34 | 22–34 | 21–36 |
| Vienotība | 23 | 7 | 0–10 | 0–10 | 0–10 | 0–11 |
| Zaļo un Zemnieku savienība | 21 | 18 | 12–22 | 11–23 | 11–24 | 11–25 |
| Nacionālā apvienība „Visu Latvijai!”–„Tēvzemei un Brīvībai/LNNK” | 17 | 12 | 7–14 | 7–15 | 6–15 | 6–17 |
| No sirds Latvijai | 7 | 0 | 0 | 0 | 0 | 0 |
| Latvijas Reģionu apvienība | 8 | 0 | 0 | 0 | 0–6 | 0–7 |
| Latvijas Krievu savienība | 0 | 0 | 0 | 0 | 0 | 0–7 |
| Vienoti Latvijai | 0 | N/A | N/A | N/A | N/A | N/A |
| Latvijas attīstībai | 0 | N/A | N/A | N/A | N/A | N/A |
| Attīstībai–Par! | 0 | 10 | 7–15 | 7–15 | 7–15 | 0–15 |
| Jaunā konservatīvā partija | 0 | 12 | 8–15 | 8–16 | 7–16 | 7–18 |
| KPV LV | 0 | 14 | 10–19 | 10–20 | 9–22 | 9–23 |
| Kustība Par! | 0 | N/A | N/A | N/A | N/A | N/A |
| Progresīvie | 0 | 0 | 0 | 0 | 0 | 0 |
Sociāldemokrātiskā Partija “Saskaņa”
For a full overview of the results for this party, see the Sociāldemokrātiskā Partija “Saskaņa” page.
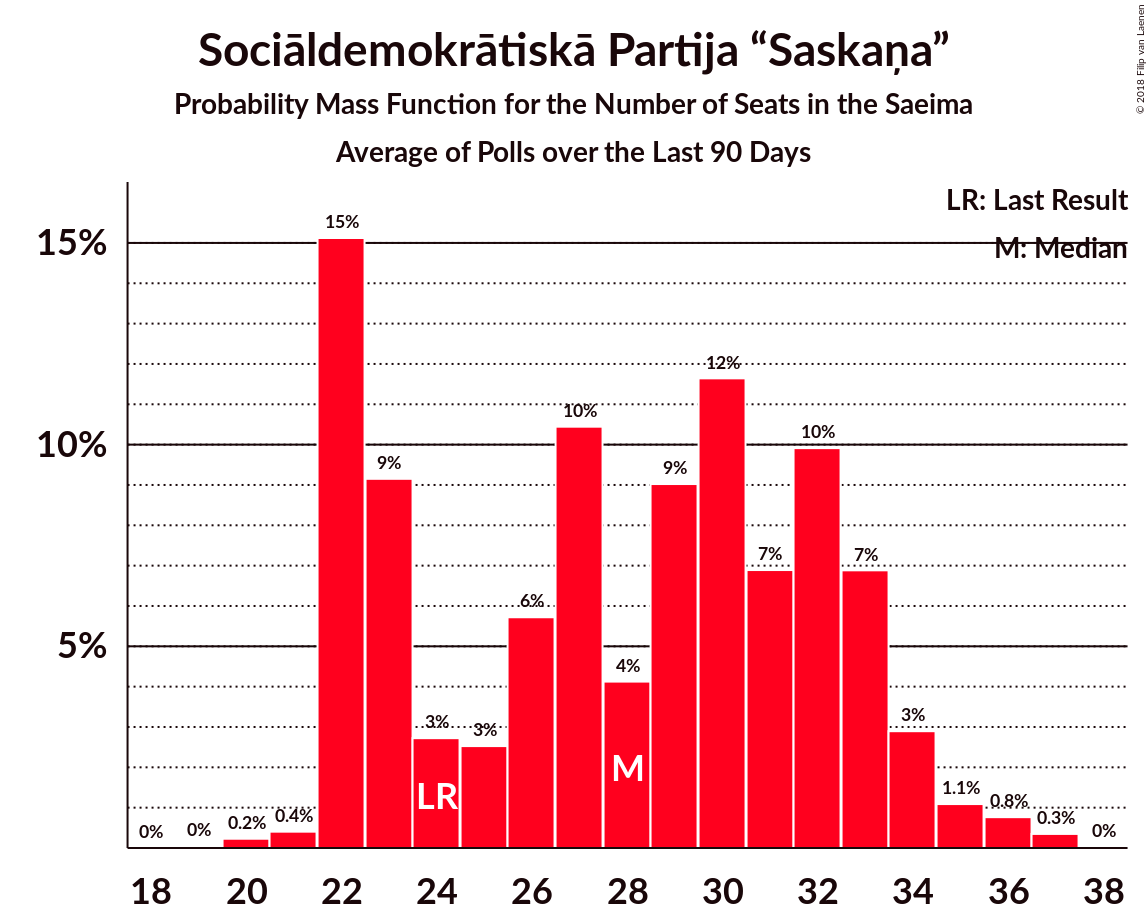
| Number of Seats | Probability | Accumulated | Special Marks |
|---|---|---|---|
| 19 | 0% | 100% | |
| 20 | 0.2% | 99.9% | |
| 21 | 0.4% | 99.7% | |
| 22 | 15% | 99.3% | |
| 23 | 9% | 84% | |
| 24 | 3% | 75% | Last Result |
| 25 | 3% | 72% | |
| 26 | 6% | 70% | |
| 27 | 10% | 64% | |
| 28 | 4% | 54% | Median |
| 29 | 9% | 49% | |
| 30 | 12% | 40% | |
| 31 | 7% | 29% | |
| 32 | 10% | 22% | |
| 33 | 7% | 12% | |
| 34 | 3% | 5% | |
| 35 | 1.1% | 2% | |
| 36 | 0.8% | 1.1% | |
| 37 | 0.3% | 0.4% | |
| 38 | 0% | 0% |
Vienotība
For a full overview of the results for this party, see the Vienotība page.
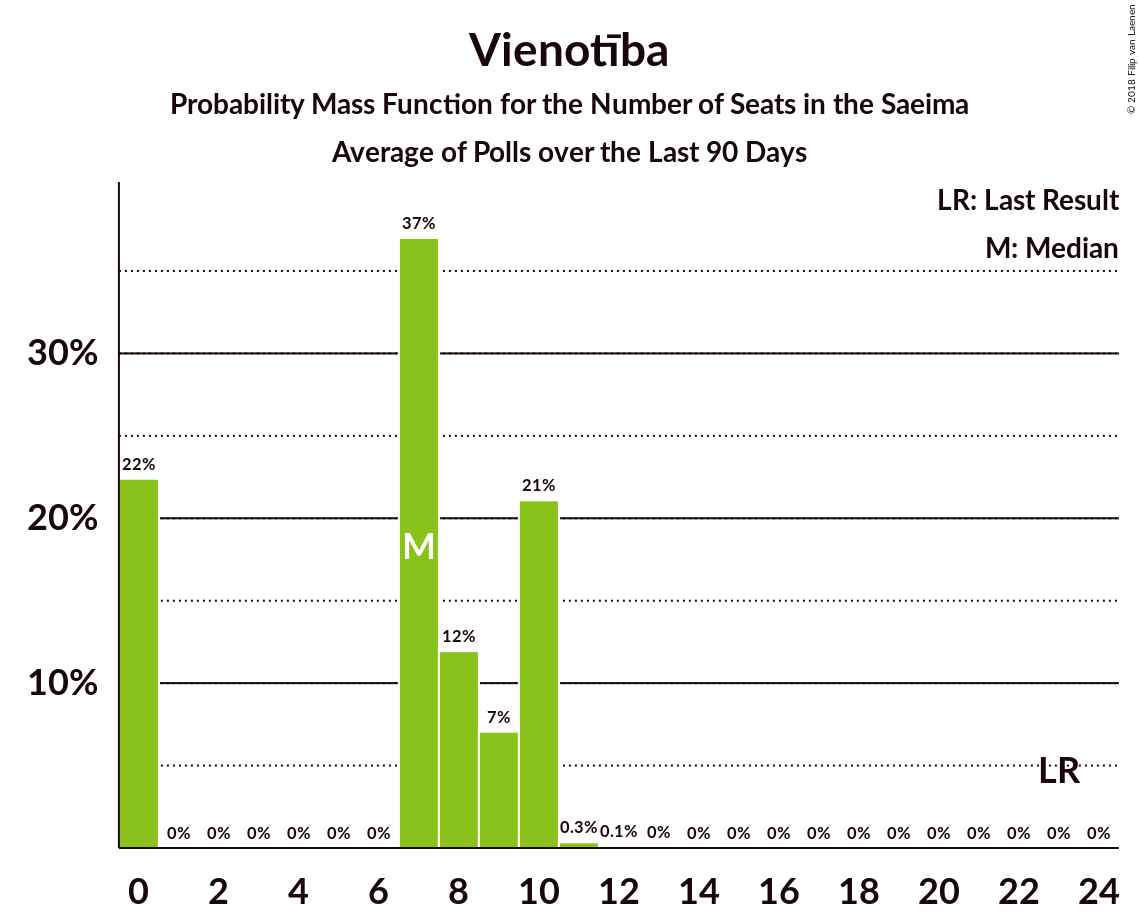
| Number of Seats | Probability | Accumulated | Special Marks |
|---|---|---|---|
| 0 | 22% | 100% | |
| 1 | 0% | 78% | |
| 2 | 0% | 78% | |
| 3 | 0% | 78% | |
| 4 | 0% | 78% | |
| 5 | 0% | 78% | |
| 6 | 0% | 78% | |
| 7 | 37% | 78% | Median |
| 8 | 12% | 41% | |
| 9 | 7% | 29% | |
| 10 | 21% | 22% | |
| 11 | 0.3% | 0.5% | |
| 12 | 0.1% | 0.2% | |
| 13 | 0% | 0% | |
| 14 | 0% | 0% | |
| 15 | 0% | 0% | |
| 16 | 0% | 0% | |
| 17 | 0% | 0% | |
| 18 | 0% | 0% | |
| 19 | 0% | 0% | |
| 20 | 0% | 0% | |
| 21 | 0% | 0% | |
| 22 | 0% | 0% | |
| 23 | 0% | 0% | Last Result |
Zaļo un Zemnieku savienība
For a full overview of the results for this party, see the Zaļo un Zemnieku savienība page.
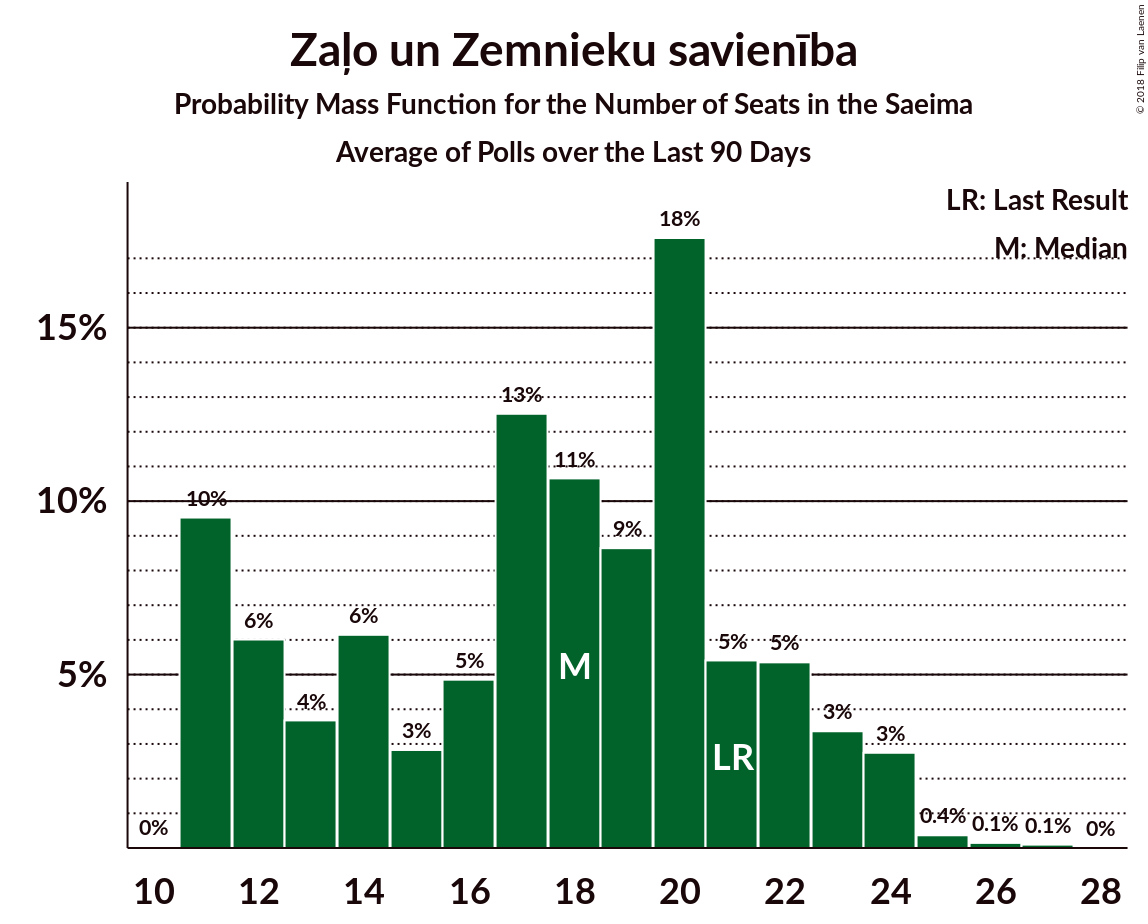
| Number of Seats | Probability | Accumulated | Special Marks |
|---|---|---|---|
| 11 | 10% | 100% | |
| 12 | 6% | 90% | |
| 13 | 4% | 84% | |
| 14 | 6% | 81% | |
| 15 | 3% | 75% | |
| 16 | 5% | 72% | |
| 17 | 13% | 67% | |
| 18 | 11% | 54% | Median |
| 19 | 9% | 44% | |
| 20 | 18% | 35% | |
| 21 | 5% | 18% | Last Result |
| 22 | 5% | 12% | |
| 23 | 3% | 7% | |
| 24 | 3% | 3% | |
| 25 | 0.4% | 0.7% | |
| 26 | 0.1% | 0.3% | |
| 27 | 0.1% | 0.1% | |
| 28 | 0% | 0% |
Nacionālā apvienība „Visu Latvijai!”–„Tēvzemei un Brīvībai/LNNK”
For a full overview of the results for this party, see the Nacionālā apvienība „Visu Latvijai!”–„Tēvzemei un Brīvībai/LNNK” page.
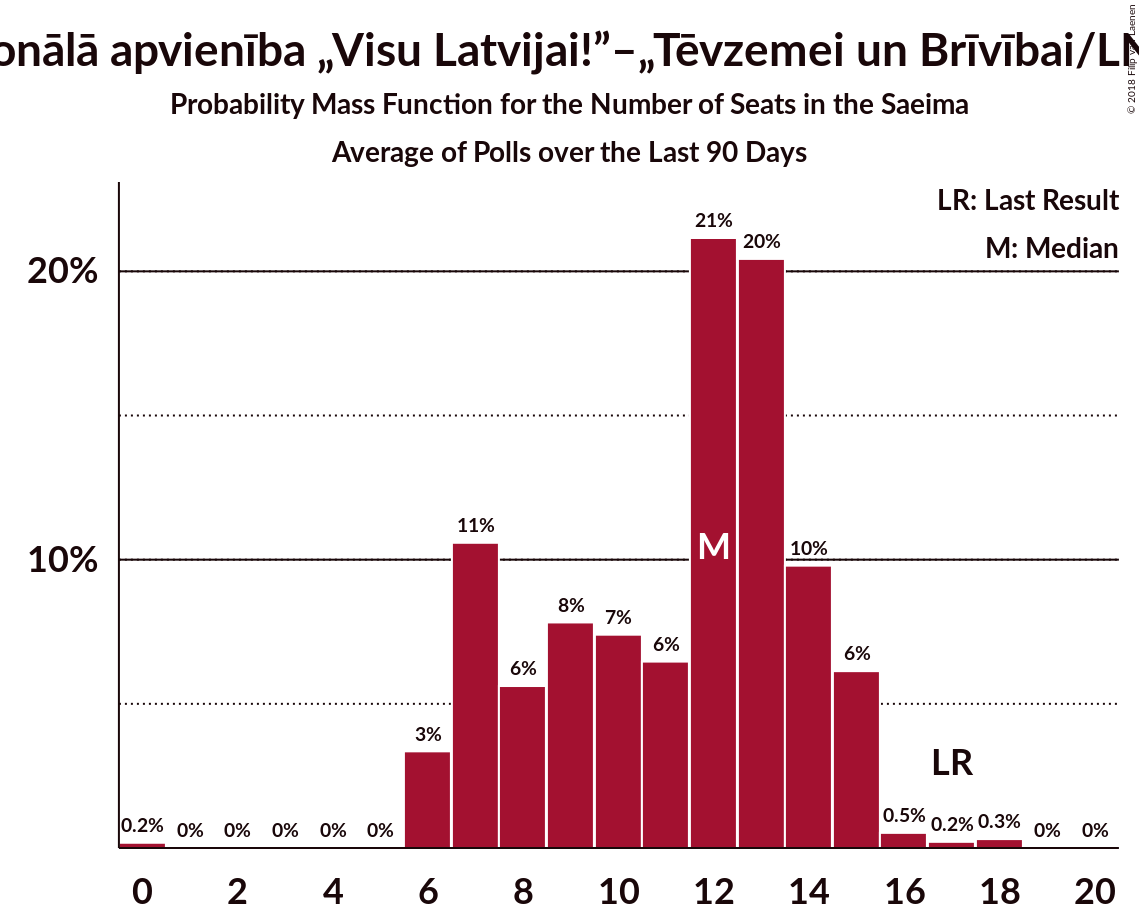
| Number of Seats | Probability | Accumulated | Special Marks |
|---|---|---|---|
| 0 | 0.2% | 100% | |
| 1 | 0% | 99.8% | |
| 2 | 0% | 99.8% | |
| 3 | 0% | 99.8% | |
| 4 | 0% | 99.8% | |
| 5 | 0% | 99.8% | |
| 6 | 3% | 99.8% | |
| 7 | 11% | 96% | |
| 8 | 6% | 86% | |
| 9 | 8% | 80% | |
| 10 | 7% | 72% | |
| 11 | 6% | 65% | |
| 12 | 21% | 59% | Median |
| 13 | 20% | 37% | |
| 14 | 10% | 17% | |
| 15 | 6% | 7% | |
| 16 | 0.5% | 1.1% | |
| 17 | 0.2% | 0.5% | Last Result |
| 18 | 0.3% | 0.3% | |
| 19 | 0% | 0% |
No sirds Latvijai
For a full overview of the results for this party, see the No sirds Latvijai page.
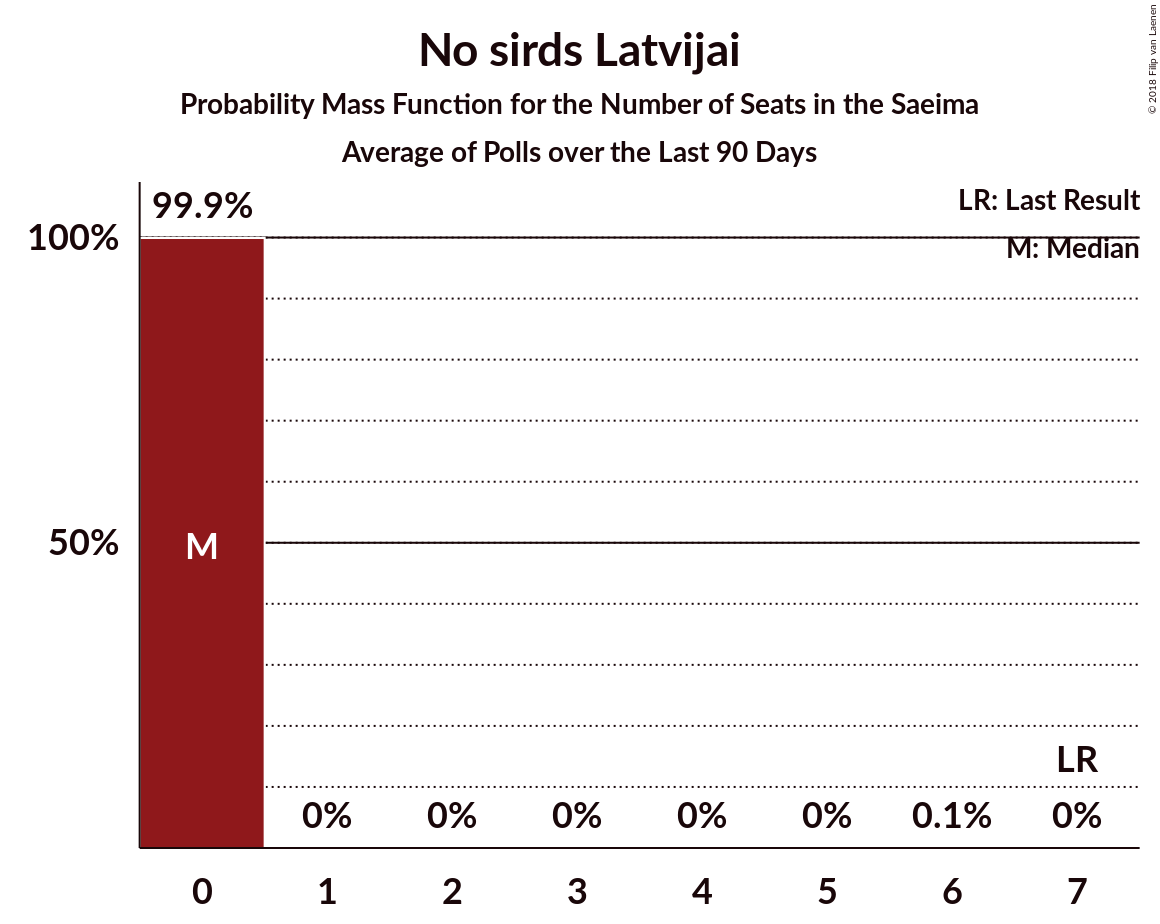
| Number of Seats | Probability | Accumulated | Special Marks |
|---|---|---|---|
| 0 | 99.9% | 100% | Median |
| 1 | 0% | 0.1% | |
| 2 | 0% | 0.1% | |
| 3 | 0% | 0.1% | |
| 4 | 0% | 0.1% | |
| 5 | 0% | 0.1% | |
| 6 | 0.1% | 0.1% | |
| 7 | 0% | 0% | Last Result |
Latvijas Reģionu apvienība
For a full overview of the results for this party, see the Latvijas Reģionu apvienība page.
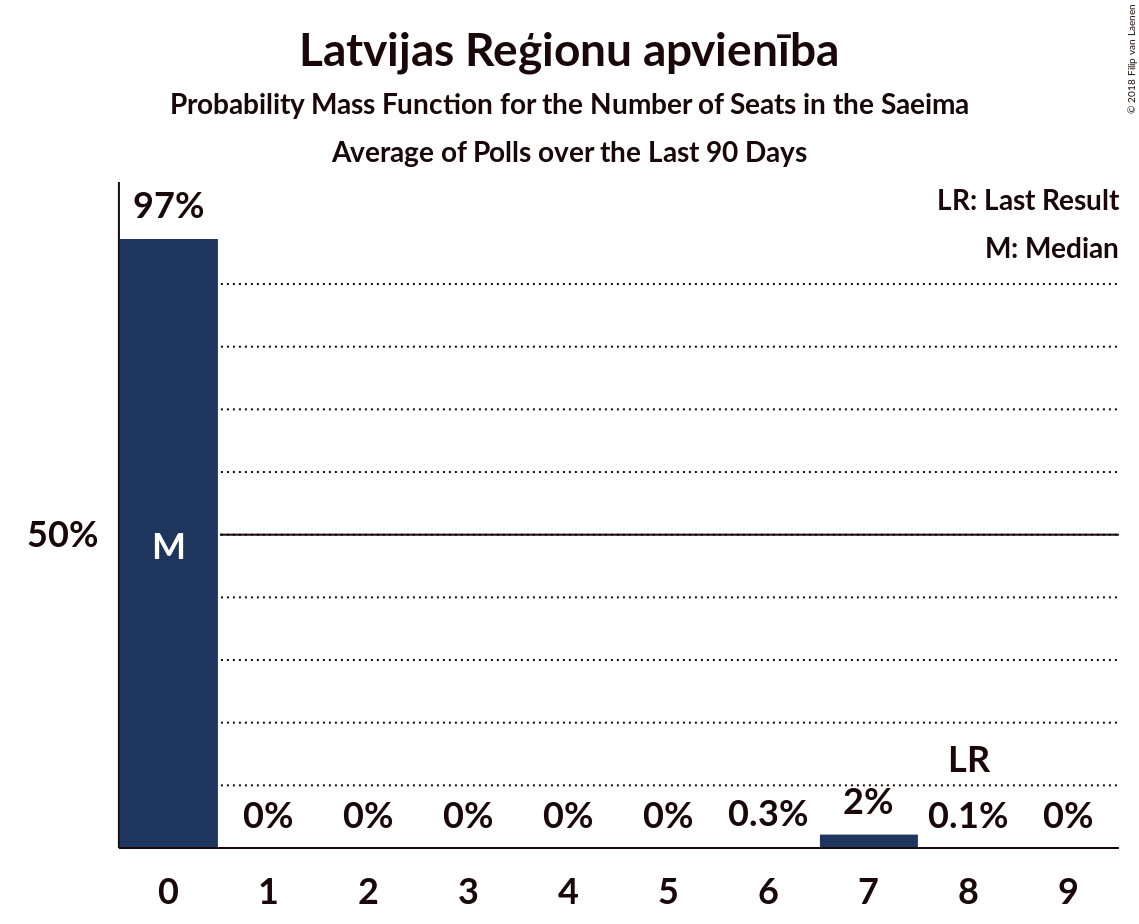
| Number of Seats | Probability | Accumulated | Special Marks |
|---|---|---|---|
| 0 | 97% | 100% | Median |
| 1 | 0% | 3% | |
| 2 | 0% | 3% | |
| 3 | 0% | 3% | |
| 4 | 0% | 3% | |
| 5 | 0% | 3% | |
| 6 | 0.3% | 3% | |
| 7 | 2% | 2% | |
| 8 | 0.1% | 0.1% | Last Result |
| 9 | 0% | 0% |
Latvijas Krievu savienība
For a full overview of the results for this party, see the Latvijas Krievu savienība page.
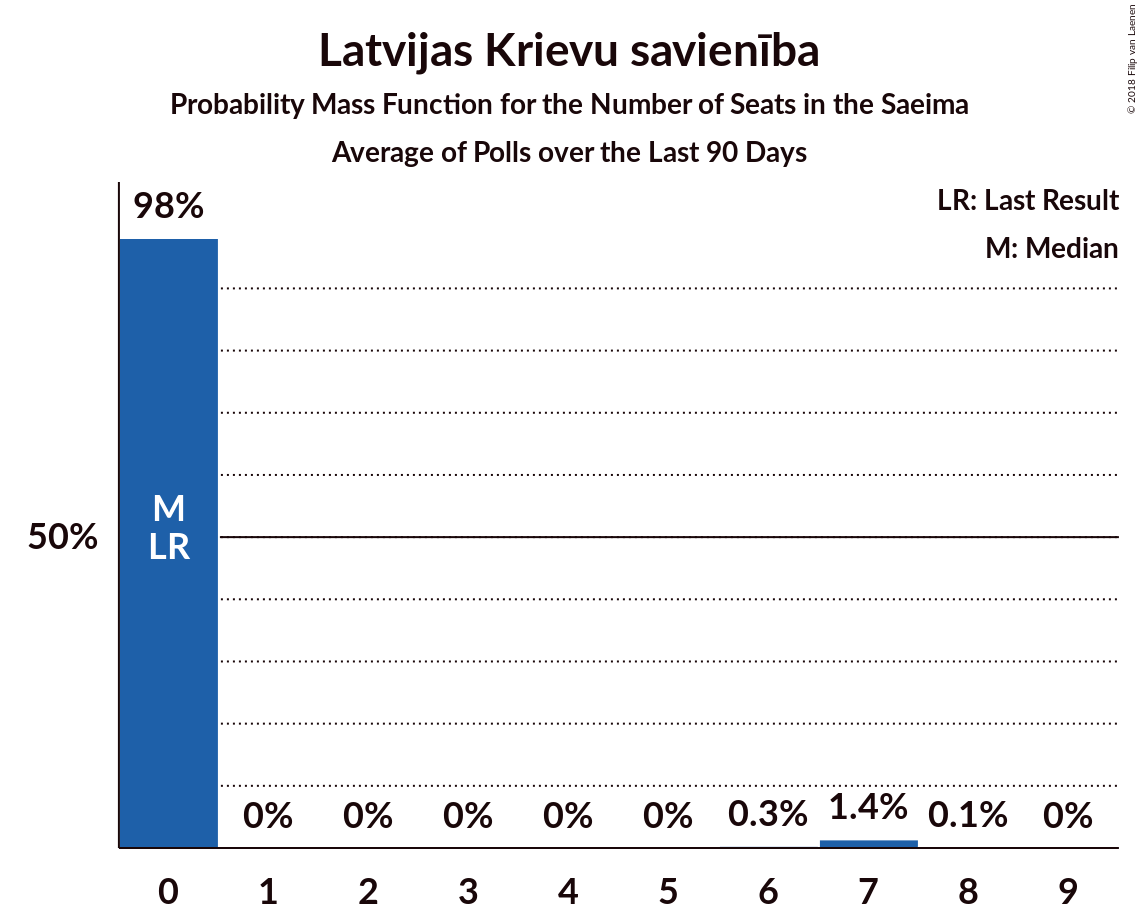
| Number of Seats | Probability | Accumulated | Special Marks |
|---|---|---|---|
| 0 | 98% | 100% | Last Result, Median |
| 1 | 0% | 2% | |
| 2 | 0% | 2% | |
| 3 | 0% | 2% | |
| 4 | 0% | 2% | |
| 5 | 0% | 2% | |
| 6 | 0.3% | 2% | |
| 7 | 1.4% | 2% | |
| 8 | 0.1% | 0.2% | |
| 9 | 0% | 0% |
Attīstībai–Par!
For a full overview of the results for this party, see the Attīstībai–Par! page.
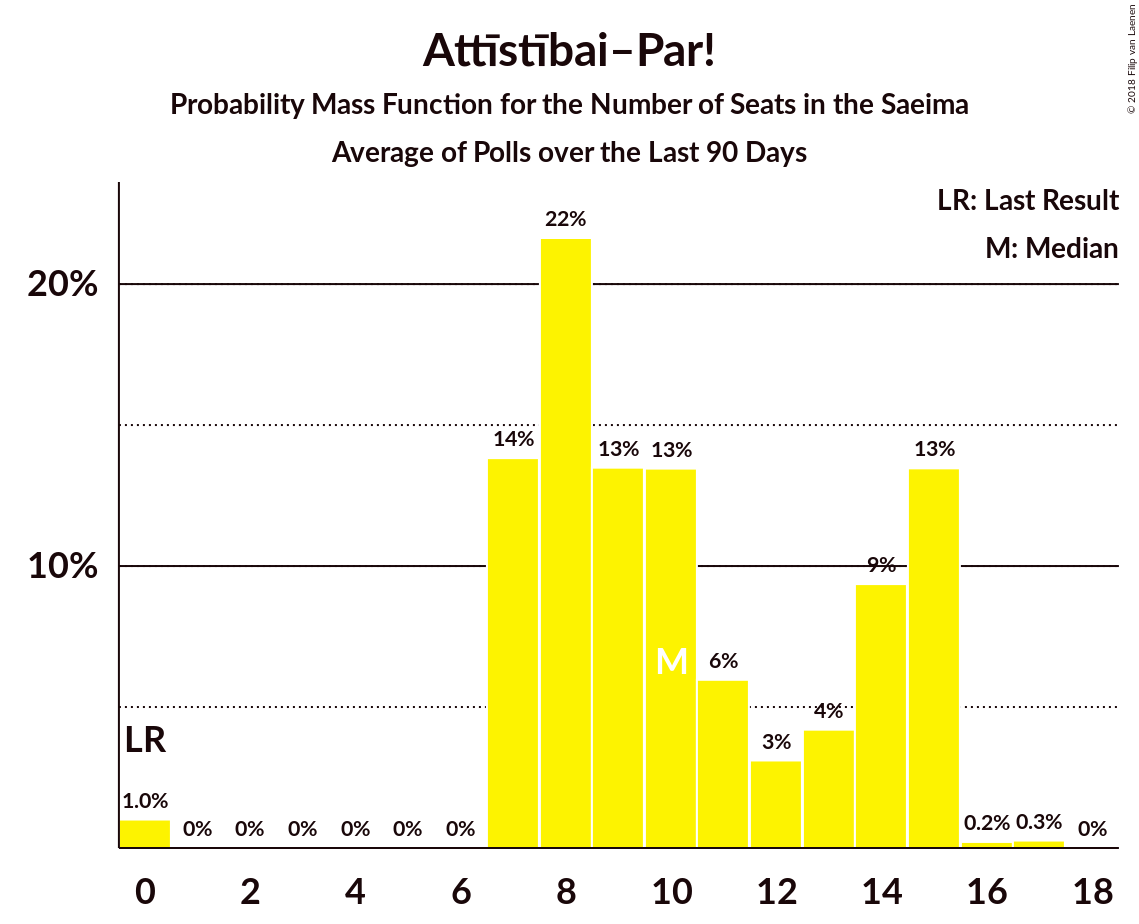
| Number of Seats | Probability | Accumulated | Special Marks |
|---|---|---|---|
| 0 | 1.0% | 100% | Last Result |
| 1 | 0% | 99.0% | |
| 2 | 0% | 99.0% | |
| 3 | 0% | 99.0% | |
| 4 | 0% | 99.0% | |
| 5 | 0% | 99.0% | |
| 6 | 0% | 99.0% | |
| 7 | 14% | 99.0% | |
| 8 | 22% | 85% | |
| 9 | 13% | 64% | |
| 10 | 13% | 50% | Median |
| 11 | 6% | 37% | |
| 12 | 3% | 31% | |
| 13 | 4% | 28% | |
| 14 | 9% | 23% | |
| 15 | 13% | 14% | |
| 16 | 0.2% | 0.5% | |
| 17 | 0.3% | 0.3% | |
| 18 | 0% | 0% |
Jaunā konservatīvā partija
For a full overview of the results for this party, see the Jaunā konservatīvā partija page.
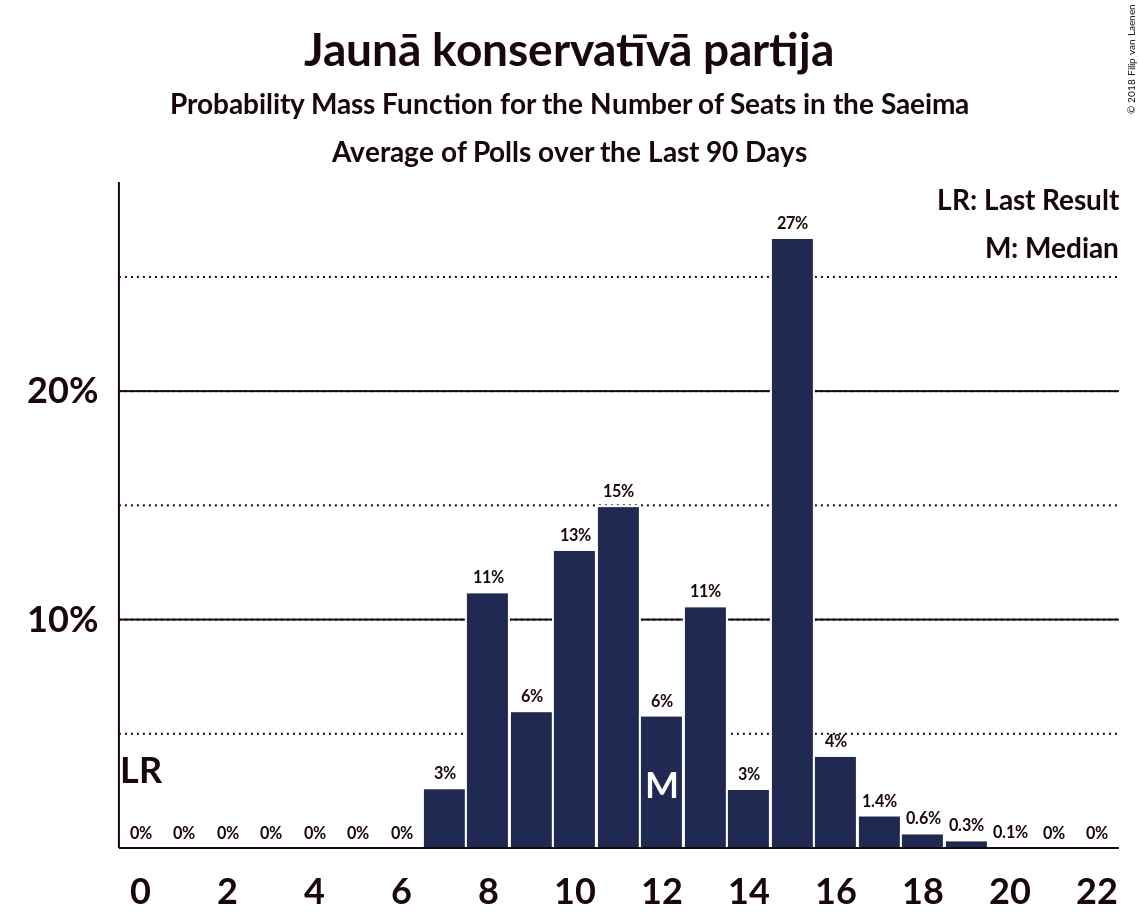
| Number of Seats | Probability | Accumulated | Special Marks |
|---|---|---|---|
| 0 | 0% | 100% | Last Result |
| 1 | 0% | 100% | |
| 2 | 0% | 100% | |
| 3 | 0% | 100% | |
| 4 | 0% | 100% | |
| 5 | 0% | 100% | |
| 6 | 0% | 100% | |
| 7 | 3% | 100% | |
| 8 | 11% | 97% | |
| 9 | 6% | 86% | |
| 10 | 13% | 80% | |
| 11 | 15% | 67% | |
| 12 | 6% | 52% | Median |
| 13 | 11% | 46% | |
| 14 | 3% | 36% | |
| 15 | 27% | 33% | |
| 16 | 4% | 7% | |
| 17 | 1.4% | 2% | |
| 18 | 0.6% | 1.1% | |
| 19 | 0.3% | 0.4% | |
| 20 | 0.1% | 0.1% | |
| 21 | 0% | 0% |
KPV LV
For a full overview of the results for this party, see the KPV LV page.
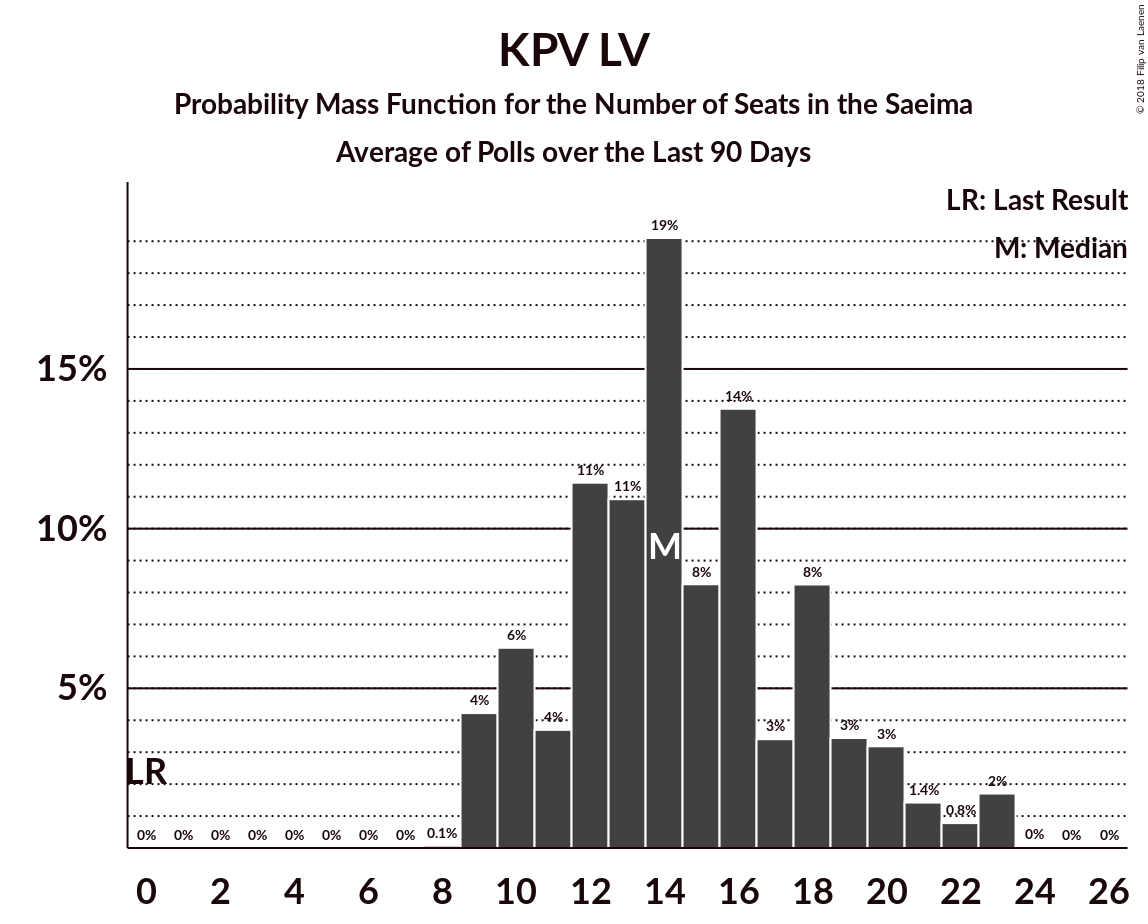
| Number of Seats | Probability | Accumulated | Special Marks |
|---|---|---|---|
| 0 | 0% | 100% | Last Result |
| 1 | 0% | 100% | |
| 2 | 0% | 100% | |
| 3 | 0% | 100% | |
| 4 | 0% | 100% | |
| 5 | 0% | 100% | |
| 6 | 0% | 100% | |
| 7 | 0% | 100% | |
| 8 | 0.1% | 100% | |
| 9 | 4% | 99.9% | |
| 10 | 6% | 96% | |
| 11 | 4% | 89% | |
| 12 | 11% | 86% | |
| 13 | 11% | 74% | |
| 14 | 19% | 63% | Median |
| 15 | 8% | 44% | |
| 16 | 14% | 36% | |
| 17 | 3% | 22% | |
| 18 | 8% | 19% | |
| 19 | 3% | 11% | |
| 20 | 3% | 7% | |
| 21 | 1.4% | 4% | |
| 22 | 0.8% | 3% | |
| 23 | 2% | 2% | |
| 24 | 0% | 0.1% | |
| 25 | 0% | 0% |
Progresīvie
For a full overview of the results for this party, see the Progresīvie page.
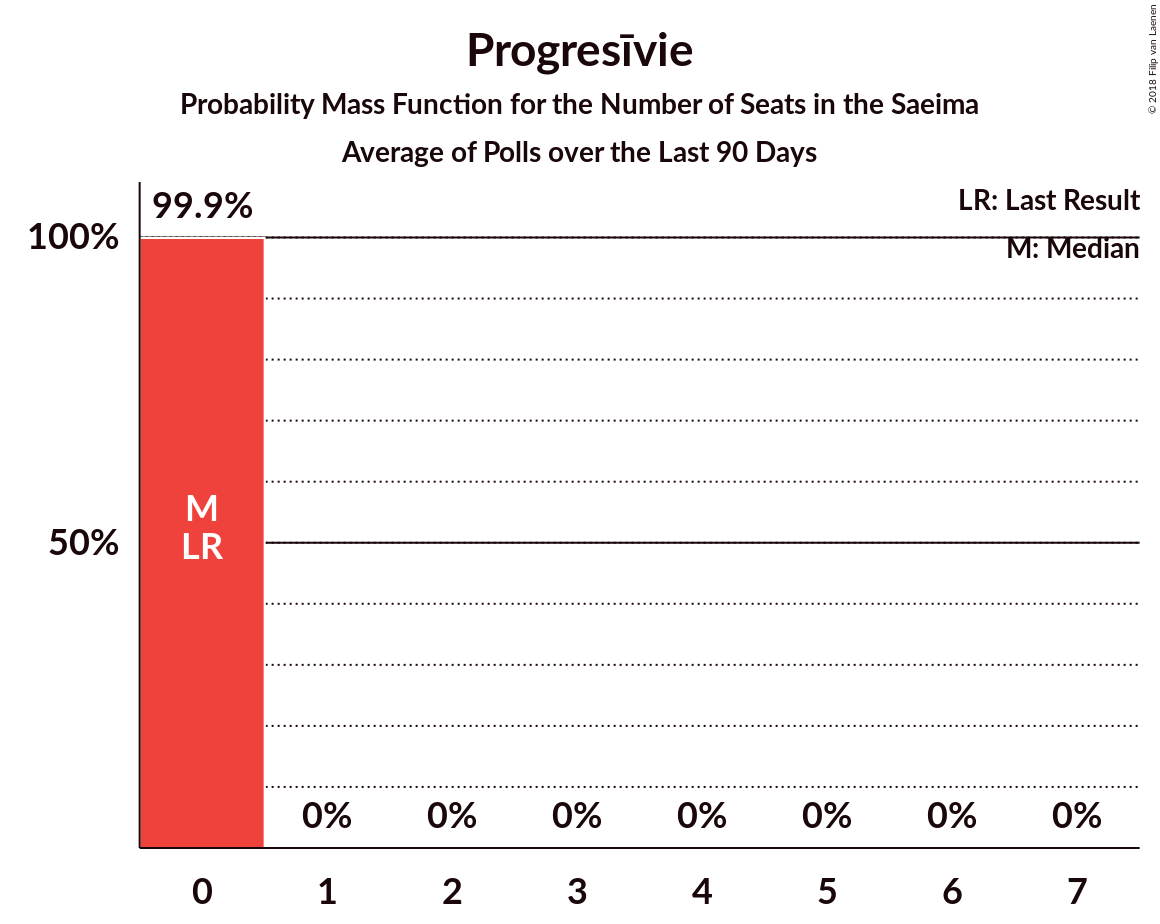
| Number of Seats | Probability | Accumulated | Special Marks |
|---|---|---|---|
| 0 | 99.9% | 100% | Last Result, Median |
| 1 | 0% | 0.1% | |
| 2 | 0% | 0.1% | |
| 3 | 0% | 0.1% | |
| 4 | 0% | 0.1% | |
| 5 | 0% | 0.1% | |
| 6 | 0% | 0.1% | |
| 7 | 0% | 0% |
Coalitions
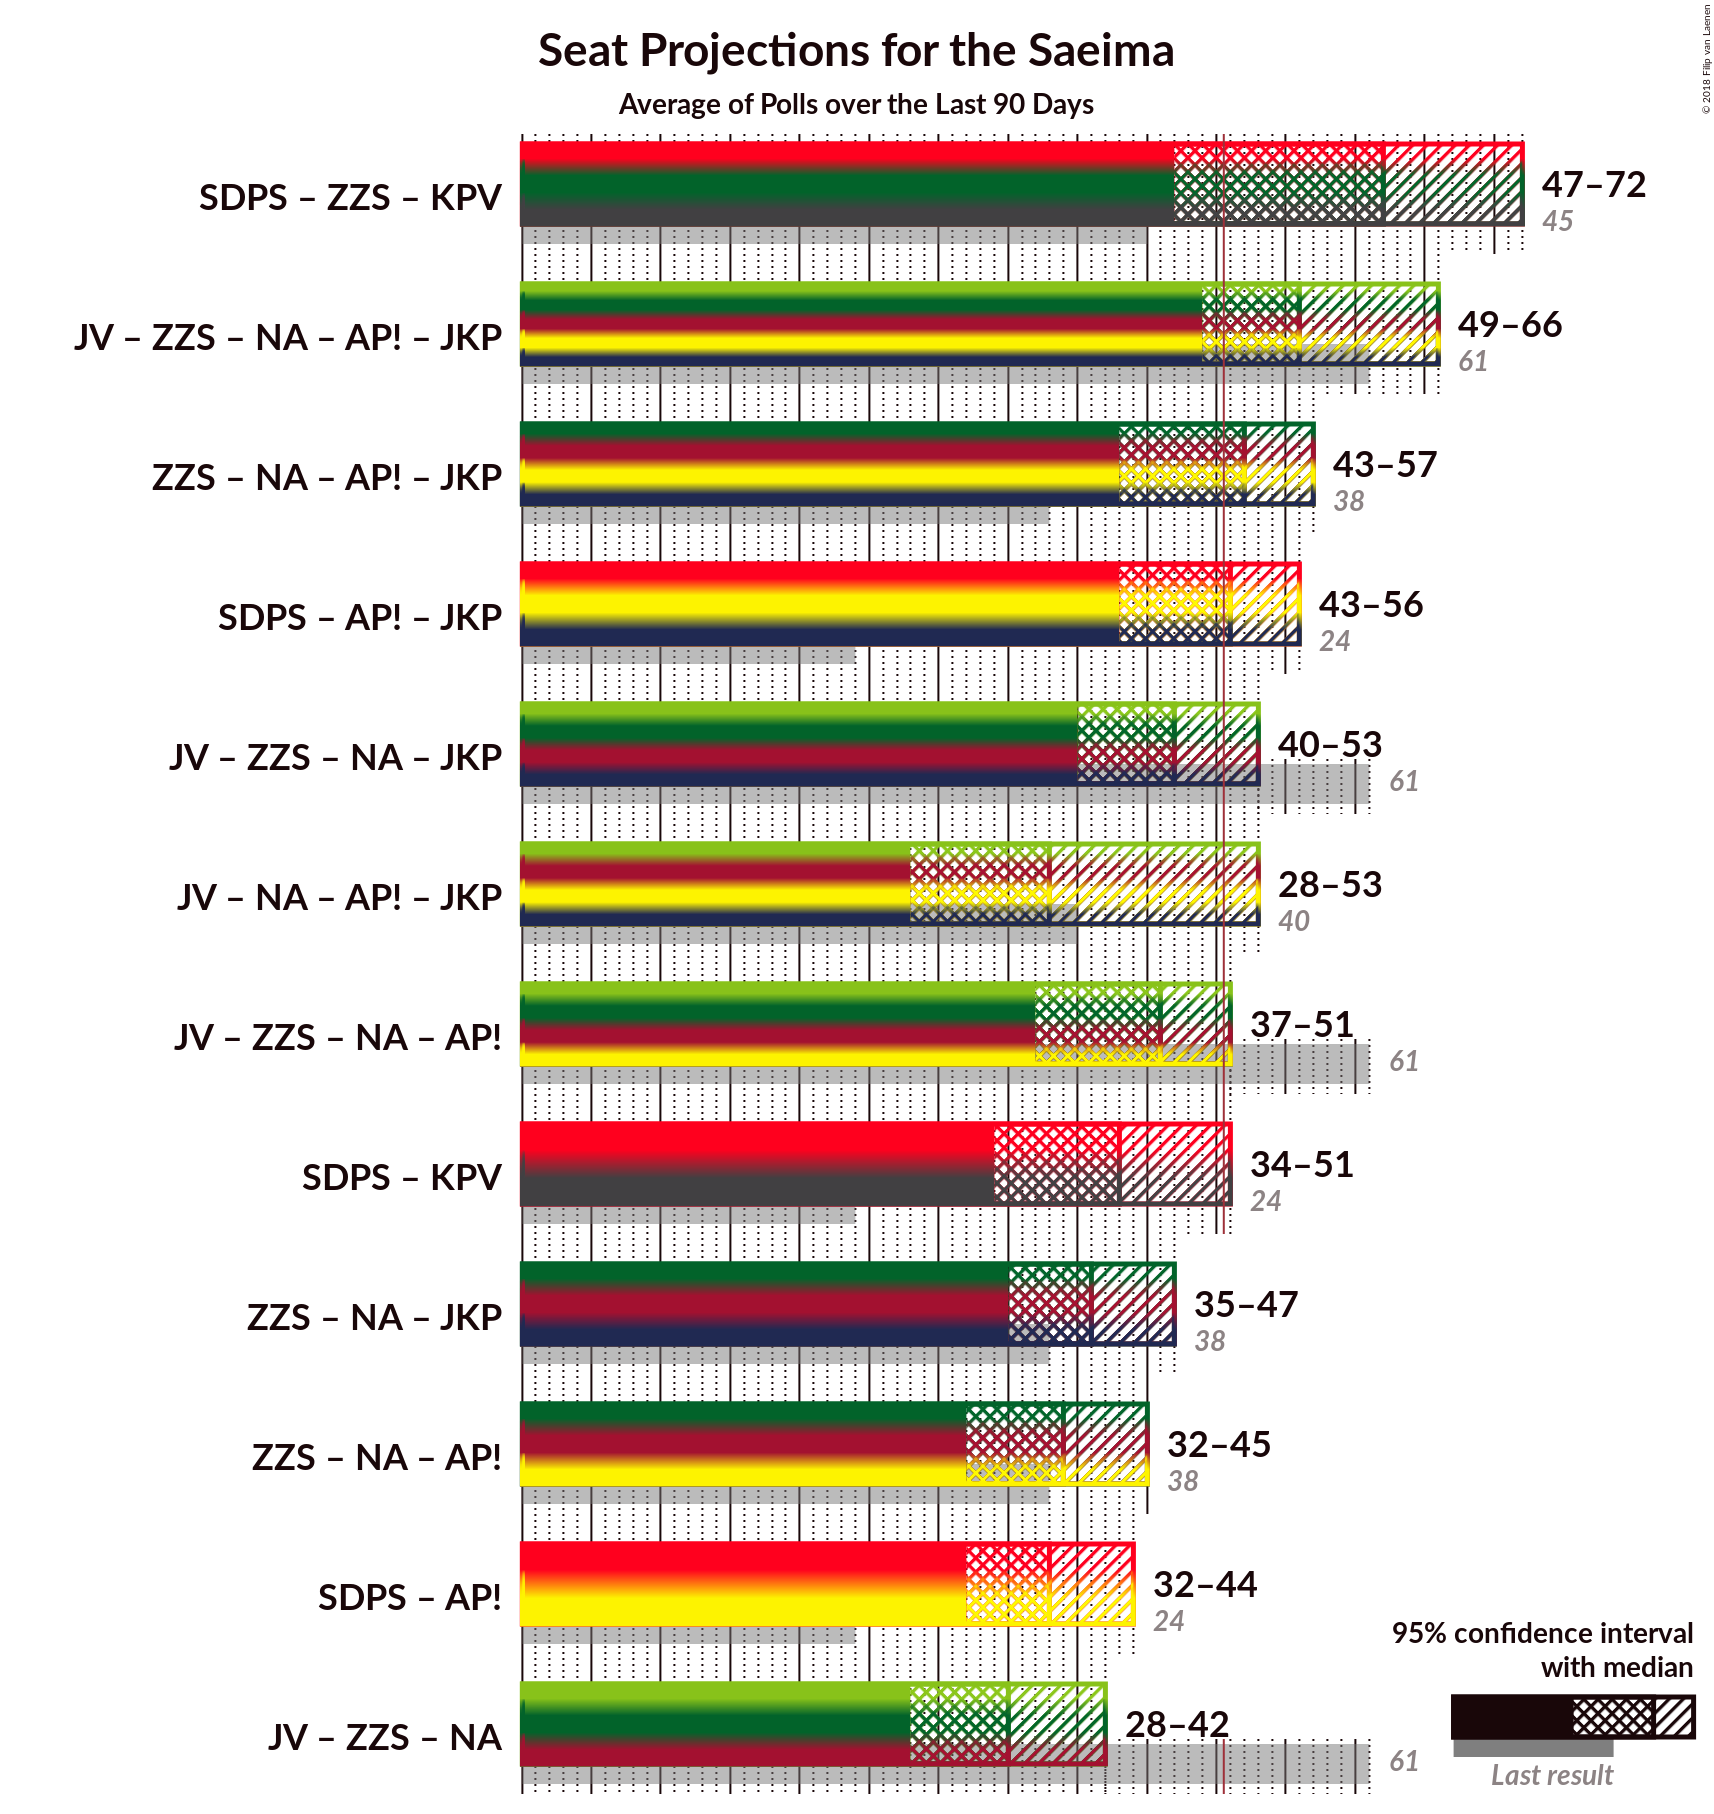
Confidence Intervals
| Coalition | Last Result | Median | Majority? | 80% Confidence Interval | 90% Confidence Interval | 95% Confidence Interval | 99% Confidence Interval |
|---|---|---|---|---|---|---|---|
| Sociāldemokrātiskā Partija “Saskaņa” – Zaļo un Zemnieku savienība – KPV LV | 45 | 62 | 76% | 47–69 | 47–70 | 47–72 | 45–75 |
| Vienotība – Zaļo un Zemnieku savienība – Nacionālā apvienība „Visu Latvijai!”–„Tēvzemei un Brīvībai/LNNK” – Attīstībai–Par! – Jaunā konservatīvā partija | 61 | 56 | 93% | 51–64 | 50–66 | 49–66 | 45–67 |
| Zaļo un Zemnieku savienība – Nacionālā apvienība „Visu Latvijai!”–„Tēvzemei un Brīvībai/LNNK” – Attīstībai–Par! – Jaunā konservatīvā partija | 38 | 52 | 58% | 46–56 | 44–56 | 43–57 | 41–60 |
| Sociāldemokrātiskā Partija “Saskaņa” – Attīstībai–Par! – Jaunā konservatīvā partija | 24 | 51 | 53% | 45–53 | 43–55 | 43–56 | 41–58 |
| Vienotība – Zaļo un Zemnieku savienība – Nacionālā apvienība „Visu Latvijai!”–„Tēvzemei un Brīvībai/LNNK” – Jaunā konservatīvā partija | 61 | 47 | 16% | 43–51 | 42–52 | 40–53 | 37–54 |
| Vienotība – Nacionālā apvienība „Visu Latvijai!”–„Tēvzemei un Brīvībai/LNNK” – Attīstībai–Par! – Jaunā konservatīvā partija | 40 | 38 | 22% | 31–53 | 29–53 | 28–53 | 25–55 |
| Vienotība – Zaļo un Zemnieku savienība – Nacionālā apvienība „Visu Latvijai!”–„Tēvzemei un Brīvībai/LNNK” – Attīstībai–Par! | 61 | 46 | 7% | 39–50 | 38–51 | 37–51 | 34–53 |
| Sociāldemokrātiskā Partija “Saskaņa” – KPV LV | 24 | 43 | 4% | 35–48 | 34–50 | 34–51 | 33–55 |
| Zaļo un Zemnieku savienība – Nacionālā apvienība „Visu Latvijai!”–„Tēvzemei un Brīvībai/LNNK” – Jaunā konservatīvā partija | 38 | 41 | 0.5% | 37–45 | 36–46 | 35–47 | 33–50 |
| Zaļo un Zemnieku savienība – Nacionālā apvienība „Visu Latvijai!”–„Tēvzemei un Brīvībai/LNNK” – Attīstībai–Par! | 38 | 39 | 0% | 35–43 | 34–44 | 32–45 | 30–48 |
| Sociāldemokrātiskā Partija “Saskaņa” – Attīstībai–Par! | 24 | 38 | 0% | 35–42 | 34–43 | 32–44 | 29–46 |
| Vienotība – Zaļo un Zemnieku savienība – Nacionālā apvienība „Visu Latvijai!”–„Tēvzemei un Brīvībai/LNNK” | 61 | 35 | 0% | 31–39 | 29–41 | 28–42 | 25–44 |
Sociāldemokrātiskā Partija “Saskaņa” – Zaļo un Zemnieku savienība – KPV LV
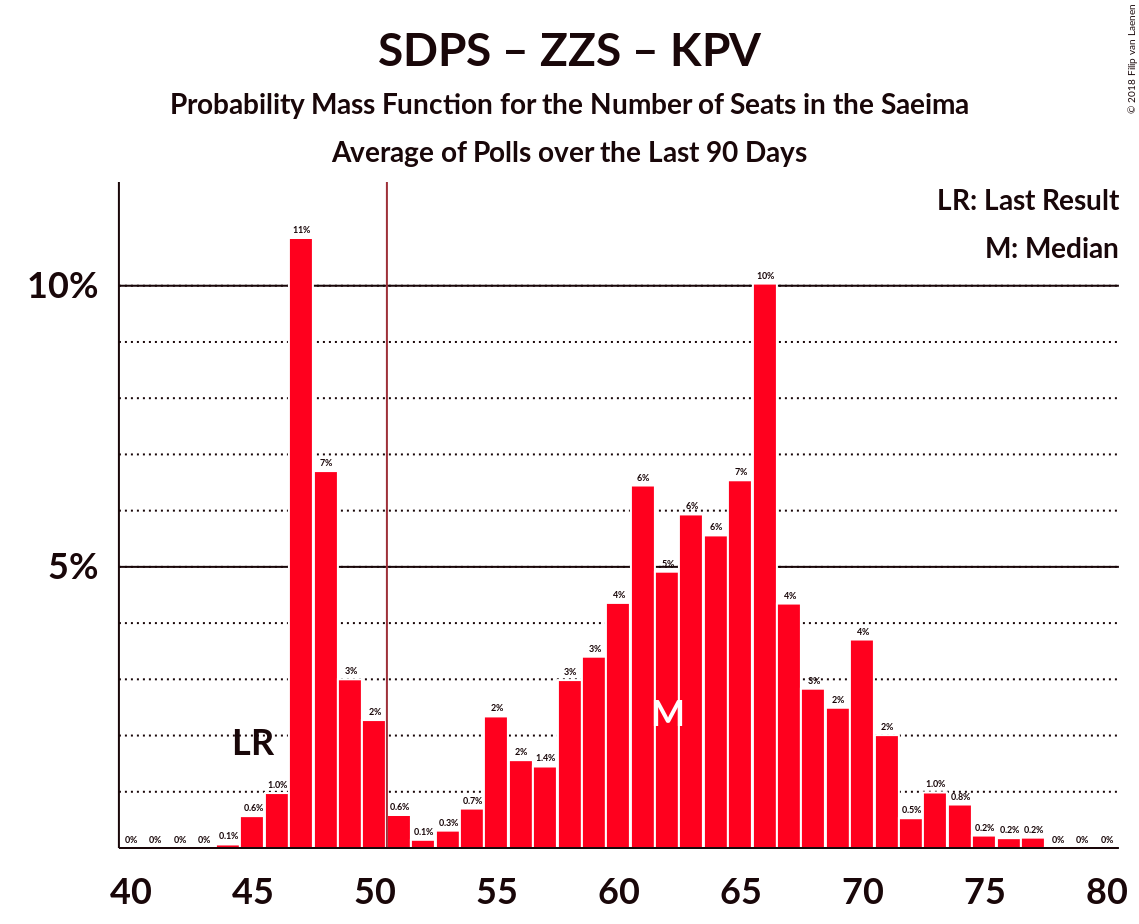
| Number of Seats | Probability | Accumulated | Special Marks |
|---|---|---|---|
| 44 | 0.1% | 100% | |
| 45 | 0.6% | 99.9% | Last Result |
| 46 | 1.0% | 99.4% | |
| 47 | 11% | 98% | |
| 48 | 7% | 88% | |
| 49 | 3% | 81% | |
| 50 | 2% | 78% | |
| 51 | 0.6% | 76% | Majority |
| 52 | 0.1% | 75% | |
| 53 | 0.3% | 75% | |
| 54 | 0.7% | 75% | |
| 55 | 2% | 74% | |
| 56 | 2% | 71% | |
| 57 | 1.4% | 70% | |
| 58 | 3% | 68% | |
| 59 | 3% | 65% | |
| 60 | 4% | 62% | Median |
| 61 | 6% | 58% | |
| 62 | 5% | 51% | |
| 63 | 6% | 46% | |
| 64 | 6% | 40% | |
| 65 | 7% | 35% | |
| 66 | 10% | 28% | |
| 67 | 4% | 18% | |
| 68 | 3% | 14% | |
| 69 | 2% | 11% | |
| 70 | 4% | 9% | |
| 71 | 2% | 5% | |
| 72 | 0.5% | 3% | |
| 73 | 1.0% | 2% | |
| 74 | 0.8% | 1.4% | |
| 75 | 0.2% | 0.6% | |
| 76 | 0.2% | 0.4% | |
| 77 | 0.2% | 0.2% | |
| 78 | 0% | 0% |
Vienotība – Zaļo un Zemnieku savienība – Nacionālā apvienība „Visu Latvijai!”–„Tēvzemei un Brīvībai/LNNK” – Attīstībai–Par! – Jaunā konservatīvā partija
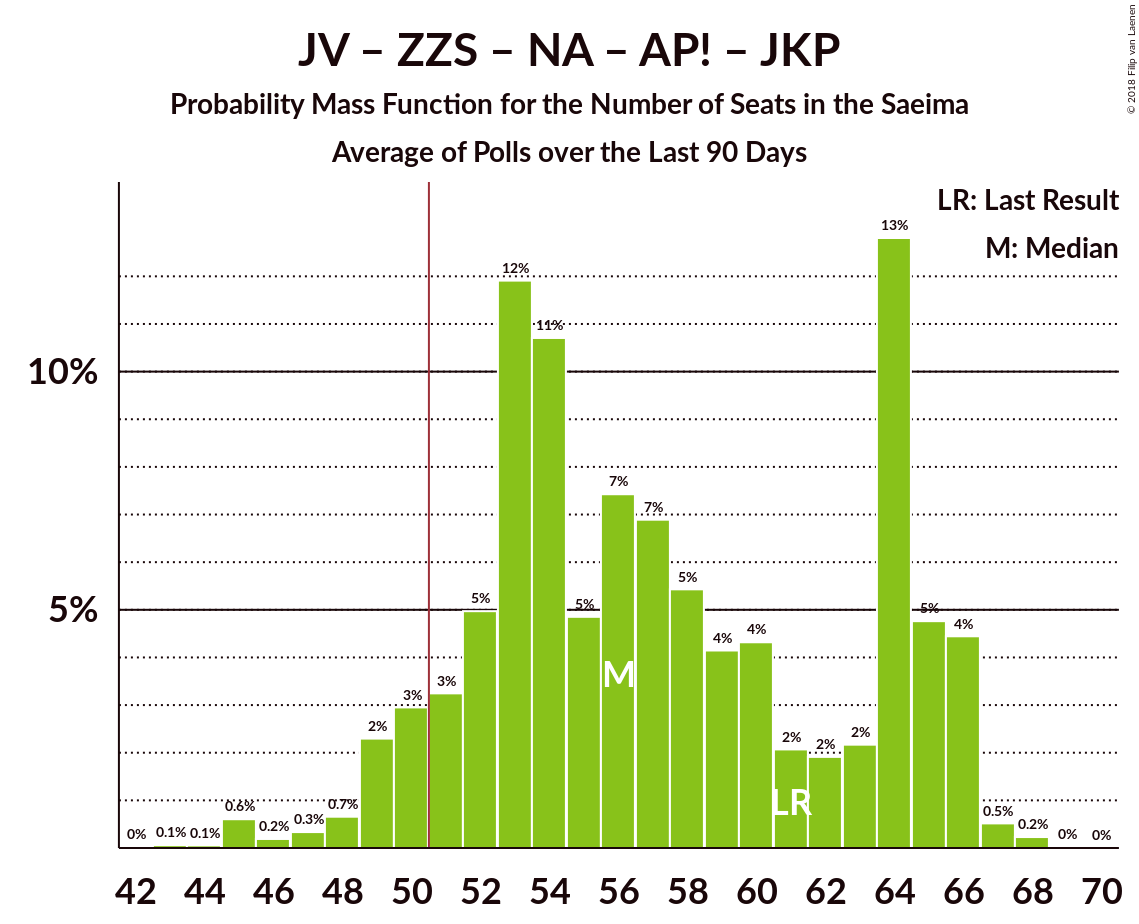
| Number of Seats | Probability | Accumulated | Special Marks |
|---|---|---|---|
| 43 | 0.1% | 100% | |
| 44 | 0.1% | 99.9% | |
| 45 | 0.6% | 99.9% | |
| 46 | 0.2% | 99.3% | |
| 47 | 0.3% | 99.1% | |
| 48 | 0.7% | 98.7% | |
| 49 | 2% | 98% | |
| 50 | 3% | 96% | |
| 51 | 3% | 93% | Majority |
| 52 | 5% | 90% | |
| 53 | 12% | 85% | |
| 54 | 11% | 73% | |
| 55 | 5% | 62% | |
| 56 | 7% | 57% | |
| 57 | 7% | 50% | |
| 58 | 5% | 43% | |
| 59 | 4% | 37% | Median |
| 60 | 4% | 33% | |
| 61 | 2% | 29% | Last Result |
| 62 | 2% | 27% | |
| 63 | 2% | 25% | |
| 64 | 13% | 23% | |
| 65 | 5% | 10% | |
| 66 | 4% | 5% | |
| 67 | 0.5% | 0.8% | |
| 68 | 0.2% | 0.2% | |
| 69 | 0% | 0% |
Zaļo un Zemnieku savienība – Nacionālā apvienība „Visu Latvijai!”–„Tēvzemei un Brīvībai/LNNK” – Attīstībai–Par! – Jaunā konservatīvā partija
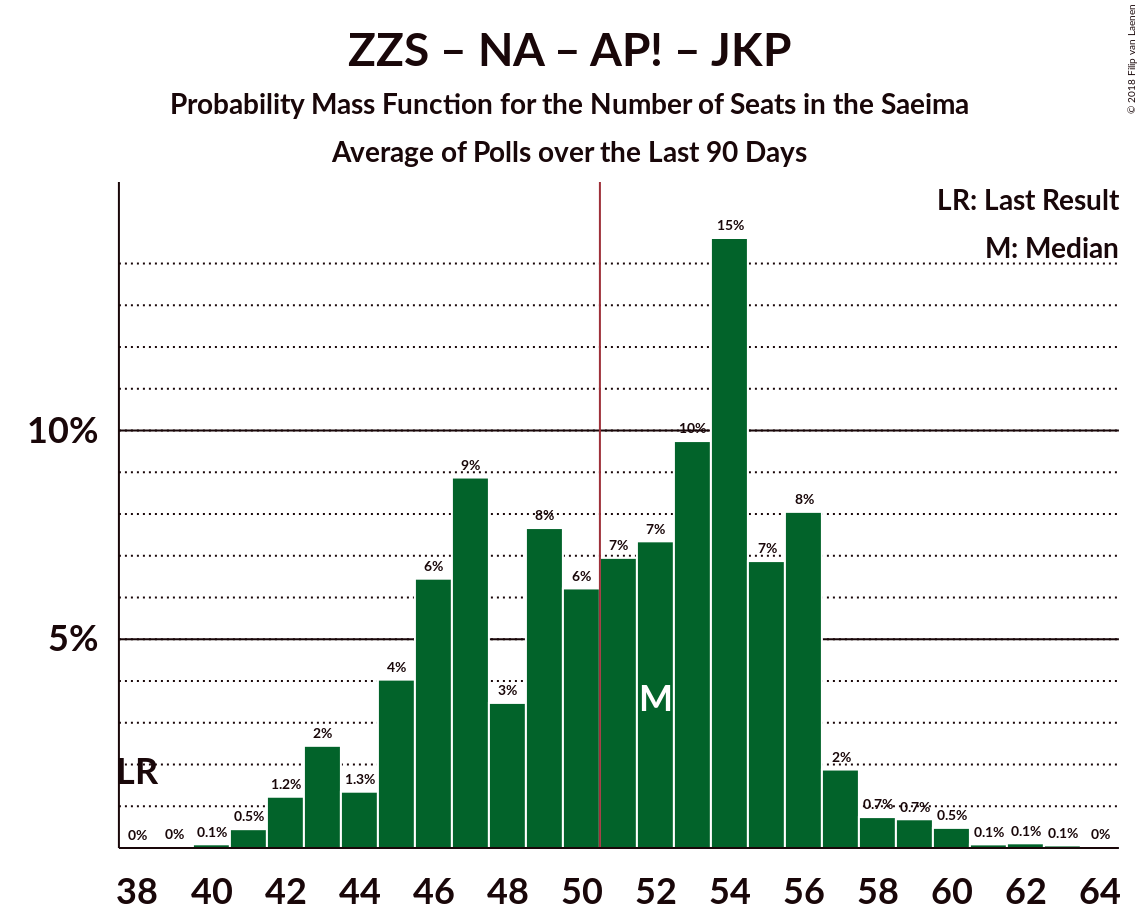
| Number of Seats | Probability | Accumulated | Special Marks |
|---|---|---|---|
| 38 | 0% | 100% | Last Result |
| 39 | 0% | 100% | |
| 40 | 0.1% | 99.9% | |
| 41 | 0.5% | 99.8% | |
| 42 | 1.2% | 99.4% | |
| 43 | 2% | 98% | |
| 44 | 1.3% | 96% | |
| 45 | 4% | 94% | |
| 46 | 6% | 90% | |
| 47 | 9% | 84% | |
| 48 | 3% | 75% | |
| 49 | 8% | 72% | |
| 50 | 6% | 64% | |
| 51 | 7% | 58% | Majority |
| 52 | 7% | 51% | Median |
| 53 | 10% | 43% | |
| 54 | 15% | 34% | |
| 55 | 7% | 19% | |
| 56 | 8% | 12% | |
| 57 | 2% | 4% | |
| 58 | 0.7% | 2% | |
| 59 | 0.7% | 1.5% | |
| 60 | 0.5% | 0.8% | |
| 61 | 0.1% | 0.3% | |
| 62 | 0.1% | 0.2% | |
| 63 | 0.1% | 0.1% | |
| 64 | 0% | 0% |
Sociāldemokrātiskā Partija “Saskaņa” – Attīstībai–Par! – Jaunā konservatīvā partija
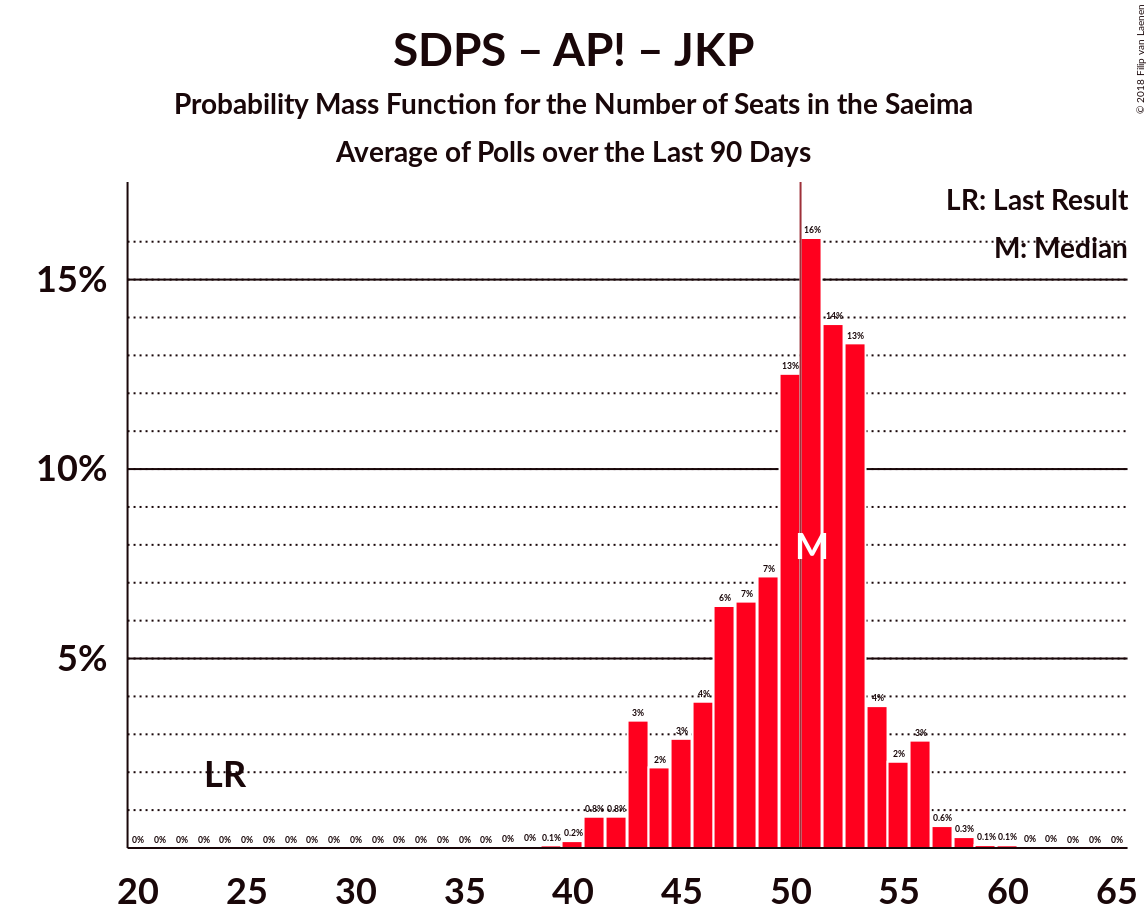
| Number of Seats | Probability | Accumulated | Special Marks |
|---|---|---|---|
| 24 | 0% | 100% | Last Result |
| 25 | 0% | 100% | |
| 26 | 0% | 100% | |
| 27 | 0% | 100% | |
| 28 | 0% | 100% | |
| 29 | 0% | 100% | |
| 30 | 0% | 100% | |
| 31 | 0% | 100% | |
| 32 | 0% | 100% | |
| 33 | 0% | 100% | |
| 34 | 0% | 100% | |
| 35 | 0% | 100% | |
| 36 | 0% | 100% | |
| 37 | 0% | 100% | |
| 38 | 0% | 100% | |
| 39 | 0.1% | 99.9% | |
| 40 | 0.2% | 99.8% | |
| 41 | 0.8% | 99.7% | |
| 42 | 0.8% | 98.8% | |
| 43 | 3% | 98% | |
| 44 | 2% | 95% | |
| 45 | 3% | 93% | |
| 46 | 4% | 90% | |
| 47 | 6% | 86% | |
| 48 | 7% | 79% | |
| 49 | 7% | 73% | |
| 50 | 13% | 66% | Median |
| 51 | 16% | 53% | Majority |
| 52 | 14% | 37% | |
| 53 | 13% | 23% | |
| 54 | 4% | 10% | |
| 55 | 2% | 6% | |
| 56 | 3% | 4% | |
| 57 | 0.6% | 1.1% | |
| 58 | 0.3% | 0.5% | |
| 59 | 0.1% | 0.2% | |
| 60 | 0.1% | 0.2% | |
| 61 | 0% | 0.1% | |
| 62 | 0% | 0.1% | |
| 63 | 0% | 0% |
Vienotība – Zaļo un Zemnieku savienība – Nacionālā apvienība „Visu Latvijai!”–„Tēvzemei un Brīvībai/LNNK” – Jaunā konservatīvā partija
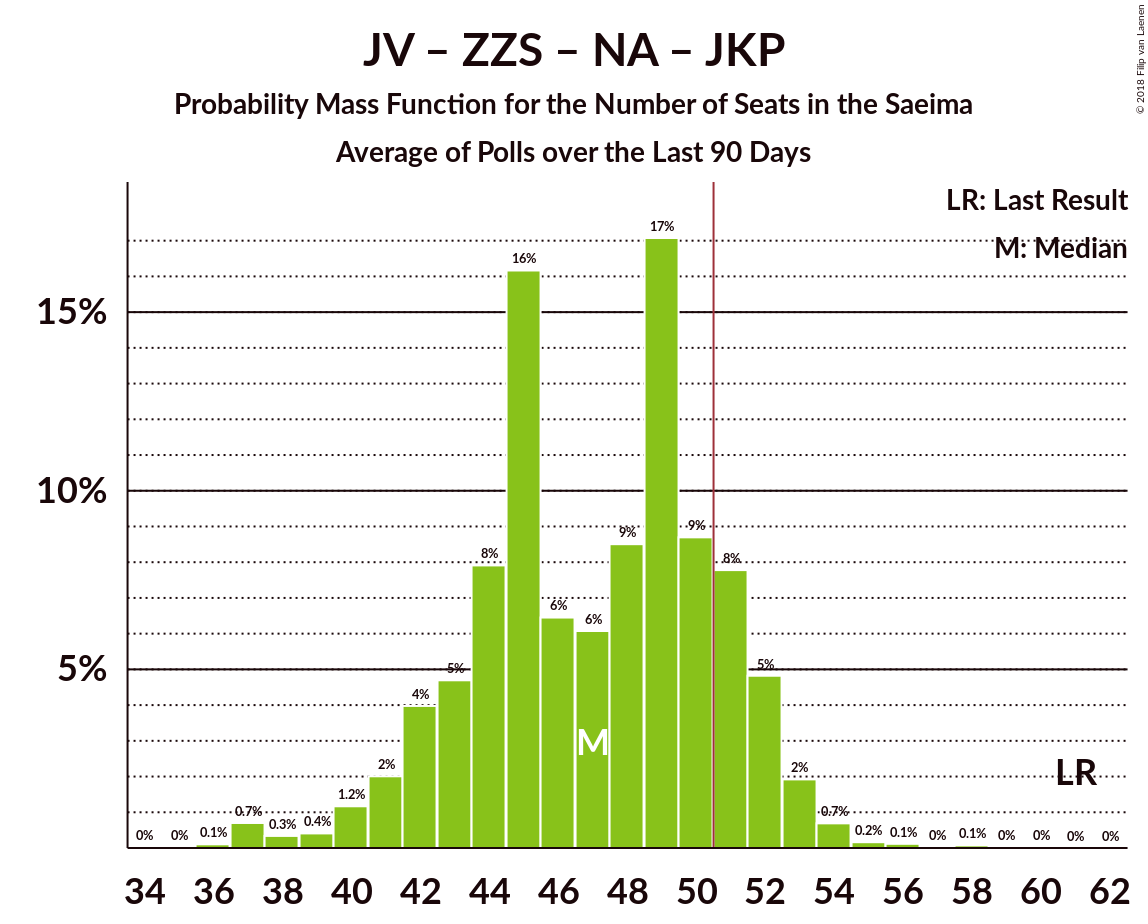
| Number of Seats | Probability | Accumulated | Special Marks |
|---|---|---|---|
| 35 | 0% | 100% | |
| 36 | 0.1% | 99.9% | |
| 37 | 0.7% | 99.8% | |
| 38 | 0.3% | 99.1% | |
| 39 | 0.4% | 98.8% | |
| 40 | 1.2% | 98% | |
| 41 | 2% | 97% | |
| 42 | 4% | 95% | |
| 43 | 5% | 91% | |
| 44 | 8% | 87% | |
| 45 | 16% | 79% | |
| 46 | 6% | 62% | |
| 47 | 6% | 56% | |
| 48 | 9% | 50% | |
| 49 | 17% | 41% | Median |
| 50 | 9% | 24% | |
| 51 | 8% | 16% | Majority |
| 52 | 5% | 8% | |
| 53 | 2% | 3% | |
| 54 | 0.7% | 1.1% | |
| 55 | 0.2% | 0.5% | |
| 56 | 0.1% | 0.3% | |
| 57 | 0% | 0.2% | |
| 58 | 0.1% | 0.1% | |
| 59 | 0% | 0.1% | |
| 60 | 0% | 0% | |
| 61 | 0% | 0% | Last Result |
Vienotība – Nacionālā apvienība „Visu Latvijai!”–„Tēvzemei un Brīvībai/LNNK” – Attīstībai–Par! – Jaunā konservatīvā partija
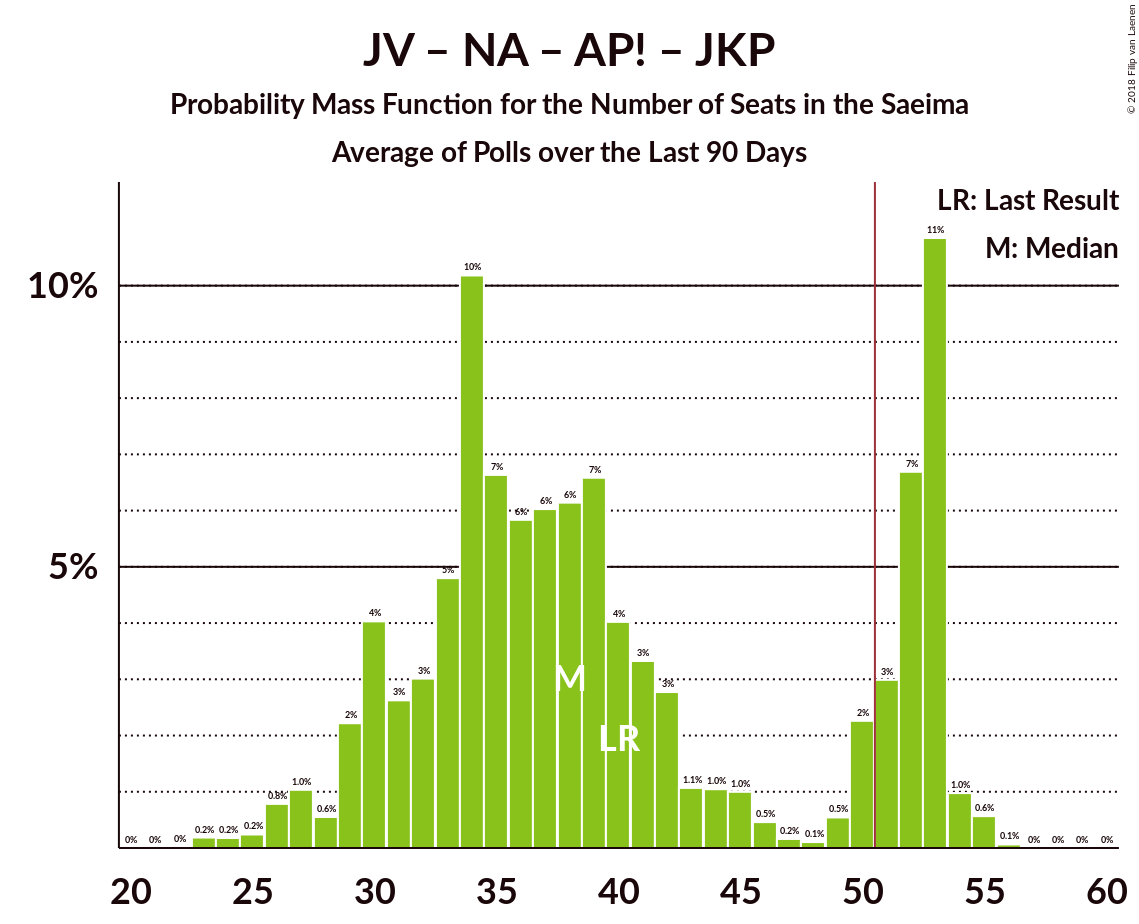
| Number of Seats | Probability | Accumulated | Special Marks |
|---|---|---|---|
| 23 | 0.2% | 100% | |
| 24 | 0.2% | 99.8% | |
| 25 | 0.2% | 99.6% | |
| 26 | 0.8% | 99.4% | |
| 27 | 1.0% | 98.6% | |
| 28 | 0.6% | 98% | |
| 29 | 2% | 97% | |
| 30 | 4% | 95% | |
| 31 | 3% | 91% | |
| 32 | 3% | 88% | |
| 33 | 5% | 85% | |
| 34 | 10% | 80% | |
| 35 | 7% | 70% | |
| 36 | 6% | 63% | |
| 37 | 6% | 58% | |
| 38 | 6% | 52% | |
| 39 | 7% | 45% | |
| 40 | 4% | 39% | Last Result |
| 41 | 3% | 35% | Median |
| 42 | 3% | 32% | |
| 43 | 1.1% | 29% | |
| 44 | 1.0% | 28% | |
| 45 | 1.0% | 27% | |
| 46 | 0.5% | 26% | |
| 47 | 0.2% | 25% | |
| 48 | 0.1% | 25% | |
| 49 | 0.5% | 25% | |
| 50 | 2% | 24% | |
| 51 | 3% | 22% | Majority |
| 52 | 7% | 19% | |
| 53 | 11% | 12% | |
| 54 | 1.0% | 2% | |
| 55 | 0.6% | 0.6% | |
| 56 | 0.1% | 0.1% | |
| 57 | 0% | 0% |
Vienotība – Zaļo un Zemnieku savienība – Nacionālā apvienība „Visu Latvijai!”–„Tēvzemei un Brīvībai/LNNK” – Attīstībai–Par!
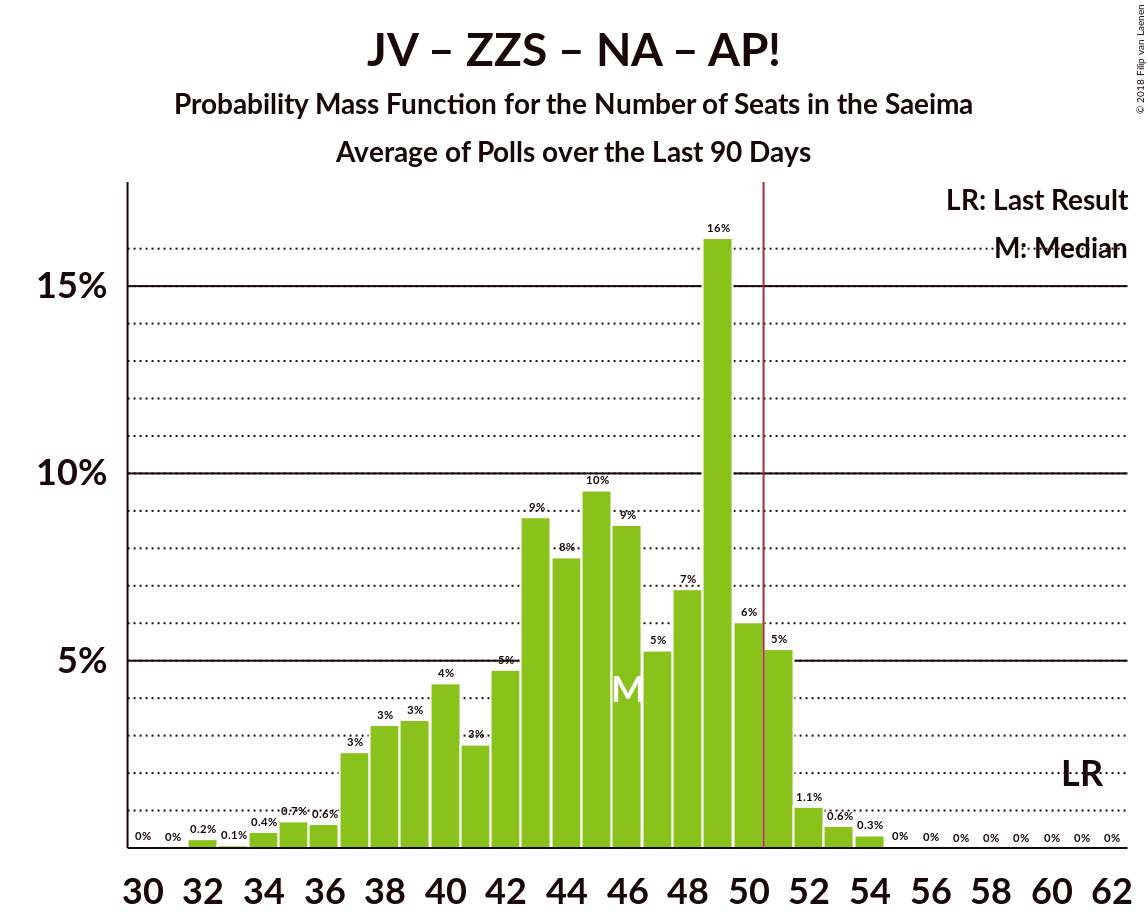
| Number of Seats | Probability | Accumulated | Special Marks |
|---|---|---|---|
| 30 | 0% | 100% | |
| 31 | 0% | 99.9% | |
| 32 | 0.2% | 99.9% | |
| 33 | 0.1% | 99.7% | |
| 34 | 0.4% | 99.6% | |
| 35 | 0.7% | 99.2% | |
| 36 | 0.6% | 98% | |
| 37 | 3% | 98% | |
| 38 | 3% | 95% | |
| 39 | 3% | 92% | |
| 40 | 4% | 89% | |
| 41 | 3% | 84% | |
| 42 | 5% | 81% | |
| 43 | 9% | 77% | |
| 44 | 8% | 68% | |
| 45 | 10% | 60% | |
| 46 | 9% | 51% | |
| 47 | 5% | 42% | Median |
| 48 | 7% | 37% | |
| 49 | 16% | 30% | |
| 50 | 6% | 13% | |
| 51 | 5% | 7% | Majority |
| 52 | 1.1% | 2% | |
| 53 | 0.6% | 1.0% | |
| 54 | 0.3% | 0.4% | |
| 55 | 0% | 0.1% | |
| 56 | 0% | 0% | |
| 57 | 0% | 0% | |
| 58 | 0% | 0% | |
| 59 | 0% | 0% | |
| 60 | 0% | 0% | |
| 61 | 0% | 0% | Last Result |
Sociāldemokrātiskā Partija “Saskaņa” – KPV LV
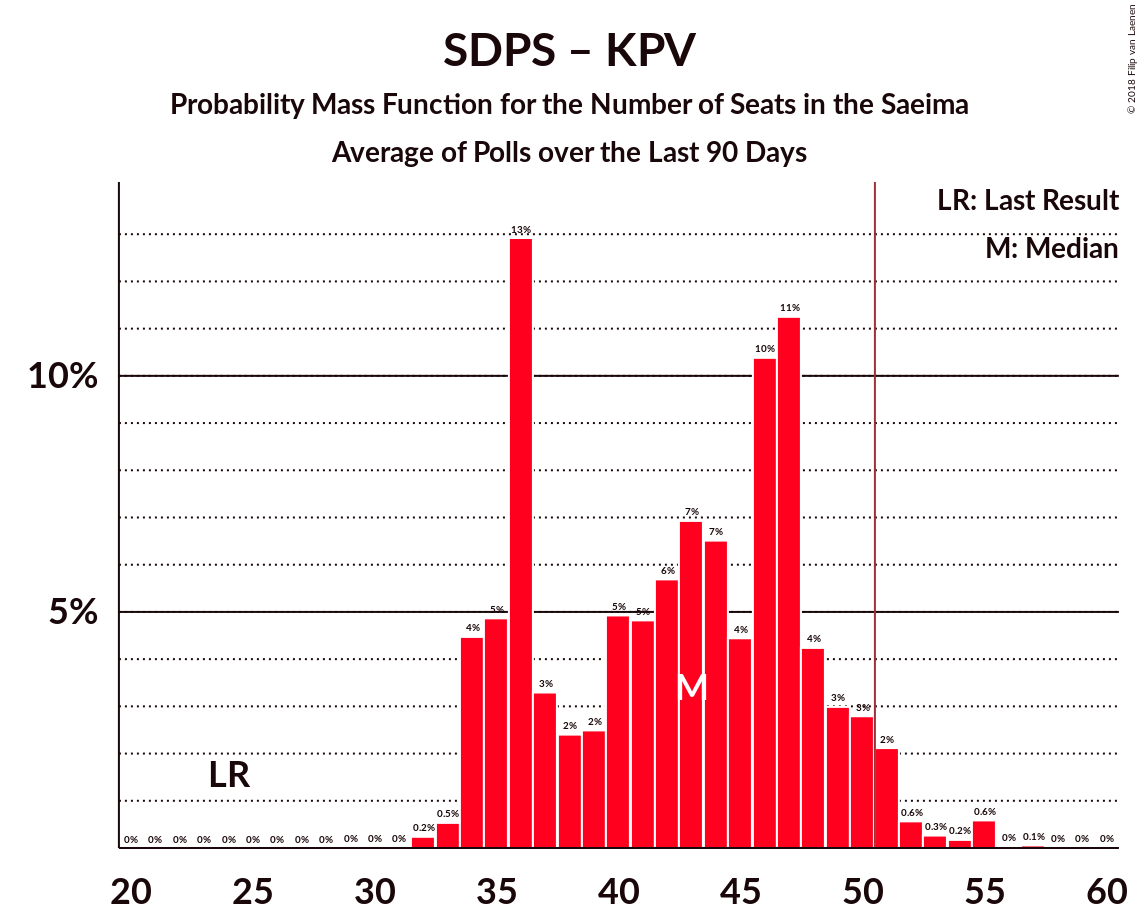
| Number of Seats | Probability | Accumulated | Special Marks |
|---|---|---|---|
| 24 | 0% | 100% | Last Result |
| 25 | 0% | 100% | |
| 26 | 0% | 100% | |
| 27 | 0% | 100% | |
| 28 | 0% | 100% | |
| 29 | 0% | 100% | |
| 30 | 0% | 100% | |
| 31 | 0% | 100% | |
| 32 | 0.2% | 100% | |
| 33 | 0.5% | 99.7% | |
| 34 | 4% | 99.2% | |
| 35 | 5% | 95% | |
| 36 | 13% | 90% | |
| 37 | 3% | 77% | |
| 38 | 2% | 74% | |
| 39 | 2% | 71% | |
| 40 | 5% | 69% | |
| 41 | 5% | 64% | |
| 42 | 6% | 59% | Median |
| 43 | 7% | 53% | |
| 44 | 7% | 46% | |
| 45 | 4% | 40% | |
| 46 | 10% | 35% | |
| 47 | 11% | 25% | |
| 48 | 4% | 14% | |
| 49 | 3% | 10% | |
| 50 | 3% | 7% | |
| 51 | 2% | 4% | Majority |
| 52 | 0.6% | 2% | |
| 53 | 0.3% | 1.1% | |
| 54 | 0.2% | 0.9% | |
| 55 | 0.6% | 0.7% | |
| 56 | 0% | 0.1% | |
| 57 | 0.1% | 0.1% | |
| 58 | 0% | 0% |
Zaļo un Zemnieku savienība – Nacionālā apvienība „Visu Latvijai!”–„Tēvzemei un Brīvībai/LNNK” – Jaunā konservatīvā partija
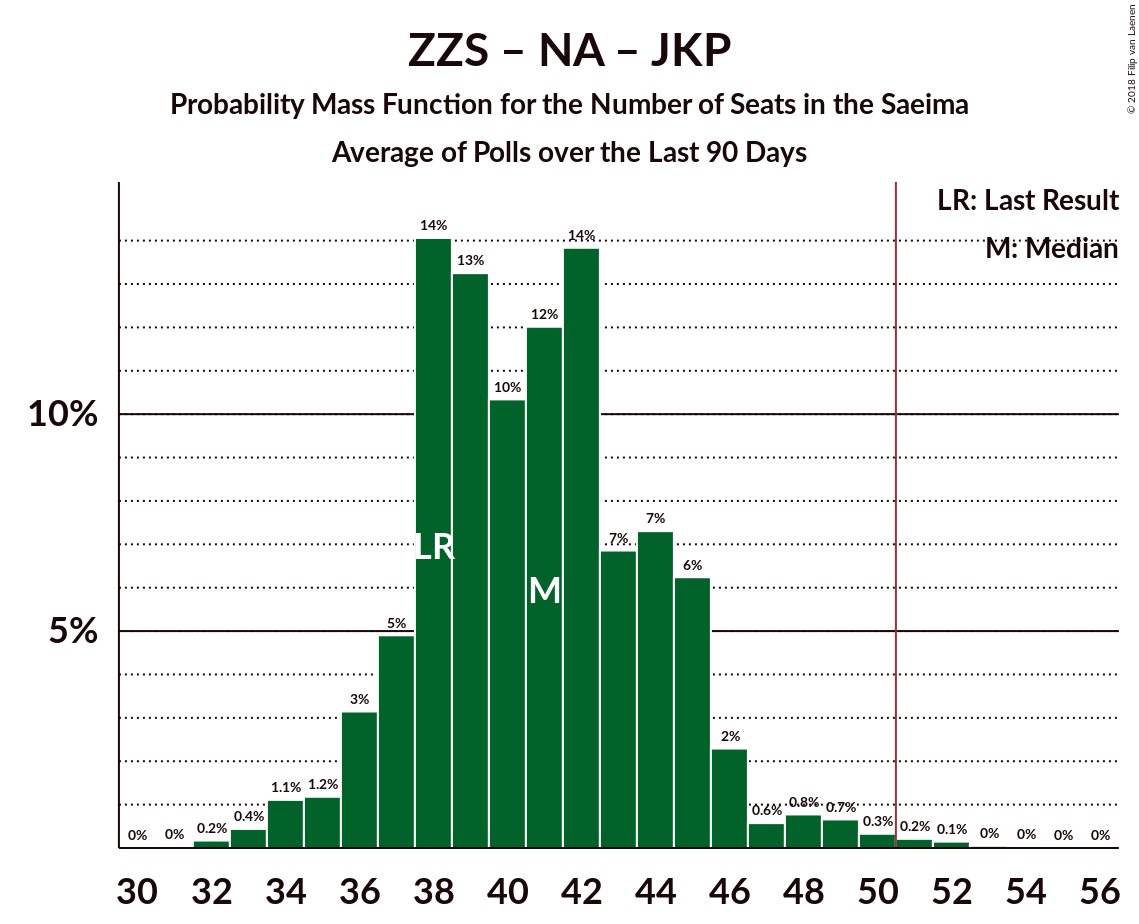
| Number of Seats | Probability | Accumulated | Special Marks |
|---|---|---|---|
| 31 | 0% | 100% | |
| 32 | 0.2% | 99.9% | |
| 33 | 0.4% | 99.8% | |
| 34 | 1.1% | 99.3% | |
| 35 | 1.2% | 98% | |
| 36 | 3% | 97% | |
| 37 | 5% | 94% | |
| 38 | 14% | 89% | Last Result |
| 39 | 13% | 75% | |
| 40 | 10% | 62% | |
| 41 | 12% | 51% | |
| 42 | 14% | 39% | Median |
| 43 | 7% | 25% | |
| 44 | 7% | 19% | |
| 45 | 6% | 11% | |
| 46 | 2% | 5% | |
| 47 | 0.6% | 3% | |
| 48 | 0.8% | 2% | |
| 49 | 0.7% | 1.5% | |
| 50 | 0.3% | 0.8% | |
| 51 | 0.2% | 0.5% | Majority |
| 52 | 0.1% | 0.3% | |
| 53 | 0% | 0.1% | |
| 54 | 0% | 0.1% | |
| 55 | 0% | 0% |
Zaļo un Zemnieku savienība – Nacionālā apvienība „Visu Latvijai!”–„Tēvzemei un Brīvībai/LNNK” – Attīstībai–Par!
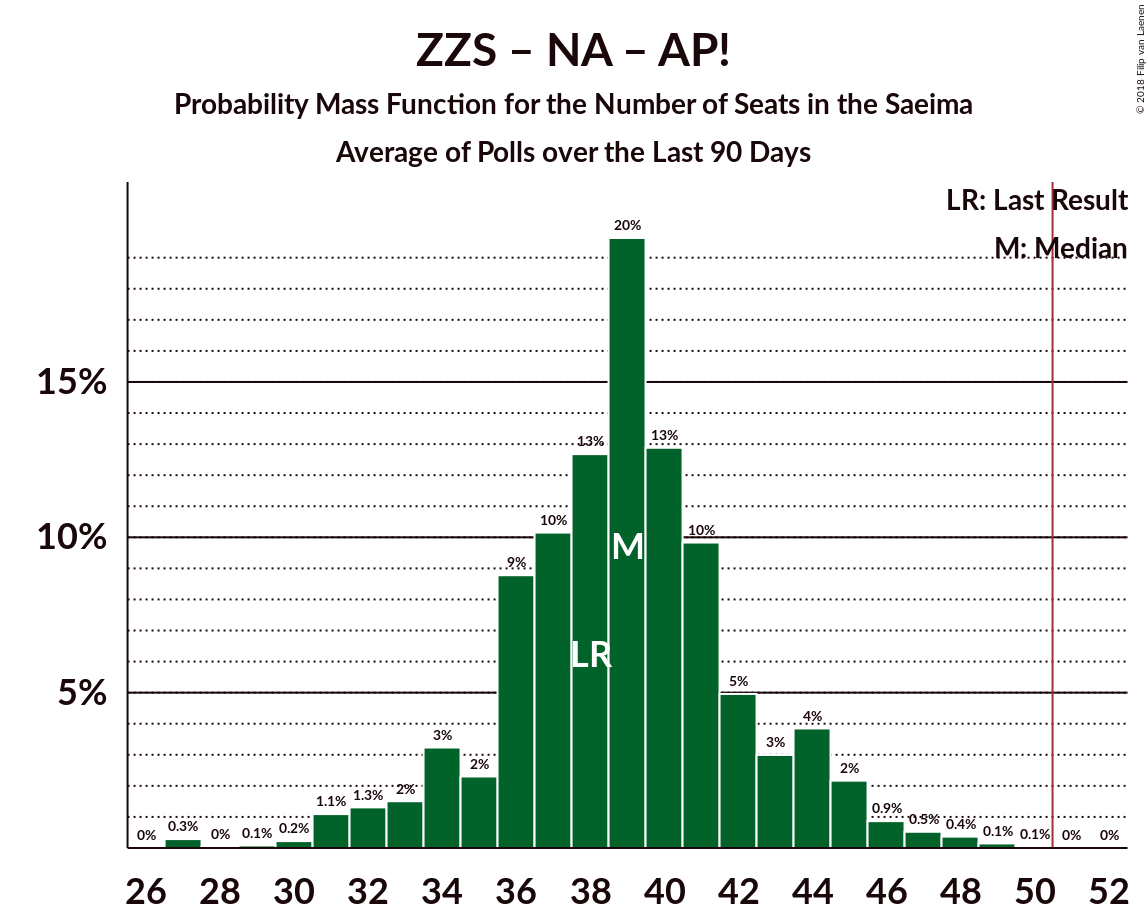
| Number of Seats | Probability | Accumulated | Special Marks |
|---|---|---|---|
| 27 | 0.3% | 100% | |
| 28 | 0% | 99.7% | |
| 29 | 0.1% | 99.6% | |
| 30 | 0.2% | 99.6% | |
| 31 | 1.1% | 99.3% | |
| 32 | 1.3% | 98% | |
| 33 | 2% | 97% | |
| 34 | 3% | 95% | |
| 35 | 2% | 92% | |
| 36 | 9% | 90% | |
| 37 | 10% | 81% | |
| 38 | 13% | 71% | Last Result |
| 39 | 20% | 58% | |
| 40 | 13% | 39% | Median |
| 41 | 10% | 26% | |
| 42 | 5% | 16% | |
| 43 | 3% | 11% | |
| 44 | 4% | 8% | |
| 45 | 2% | 4% | |
| 46 | 0.9% | 2% | |
| 47 | 0.5% | 1.1% | |
| 48 | 0.4% | 0.6% | |
| 49 | 0.1% | 0.2% | |
| 50 | 0.1% | 0.1% | |
| 51 | 0% | 0% | Majority |
Sociāldemokrātiskā Partija “Saskaņa” – Attīstībai–Par!
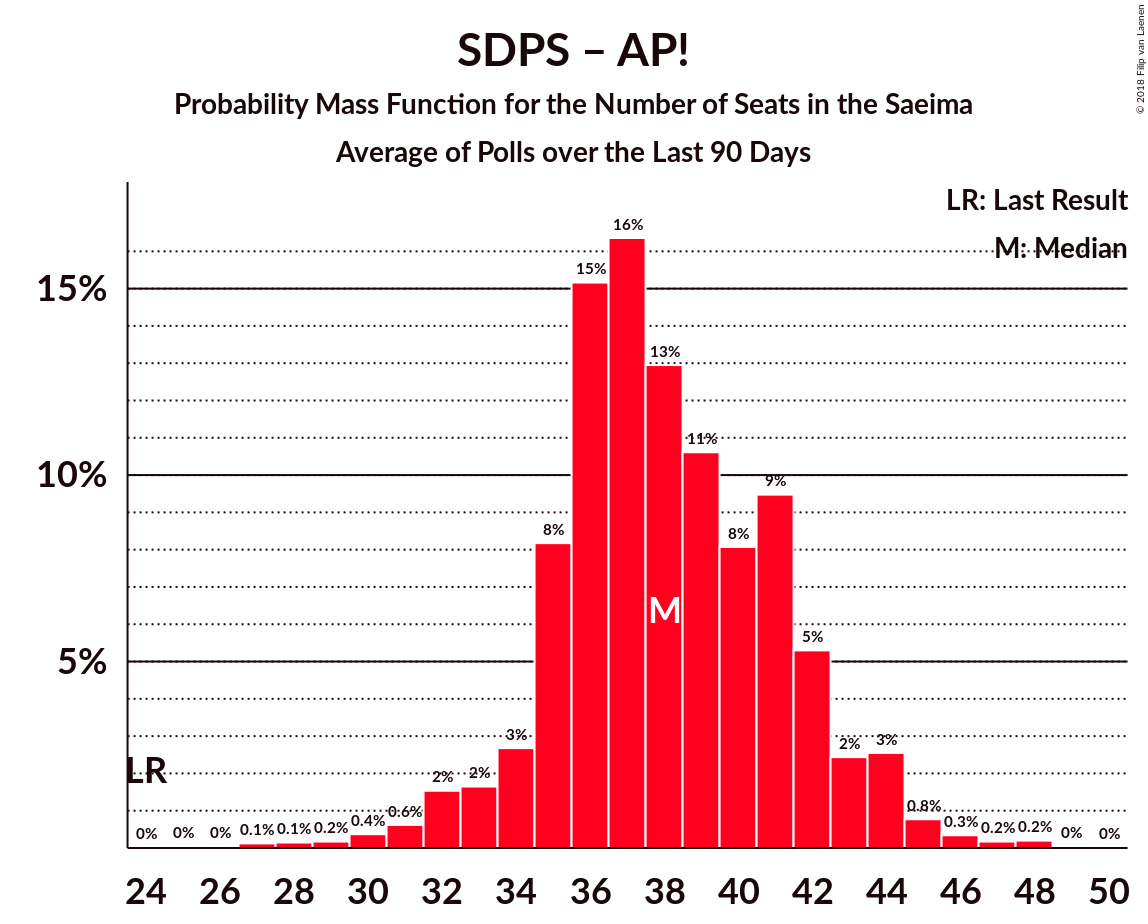
| Number of Seats | Probability | Accumulated | Special Marks |
|---|---|---|---|
| 24 | 0% | 100% | Last Result |
| 25 | 0% | 100% | |
| 26 | 0% | 100% | |
| 27 | 0.1% | 99.9% | |
| 28 | 0.1% | 99.8% | |
| 29 | 0.2% | 99.6% | |
| 30 | 0.4% | 99.5% | |
| 31 | 0.6% | 99.1% | |
| 32 | 2% | 98% | |
| 33 | 2% | 97% | |
| 34 | 3% | 95% | |
| 35 | 8% | 93% | |
| 36 | 15% | 84% | |
| 37 | 16% | 69% | |
| 38 | 13% | 53% | Median |
| 39 | 11% | 40% | |
| 40 | 8% | 29% | |
| 41 | 9% | 21% | |
| 42 | 5% | 12% | |
| 43 | 2% | 7% | |
| 44 | 3% | 4% | |
| 45 | 0.8% | 2% | |
| 46 | 0.3% | 0.8% | |
| 47 | 0.2% | 0.4% | |
| 48 | 0.2% | 0.2% | |
| 49 | 0% | 0% |
Vienotība – Zaļo un Zemnieku savienība – Nacionālā apvienība „Visu Latvijai!”–„Tēvzemei un Brīvībai/LNNK”
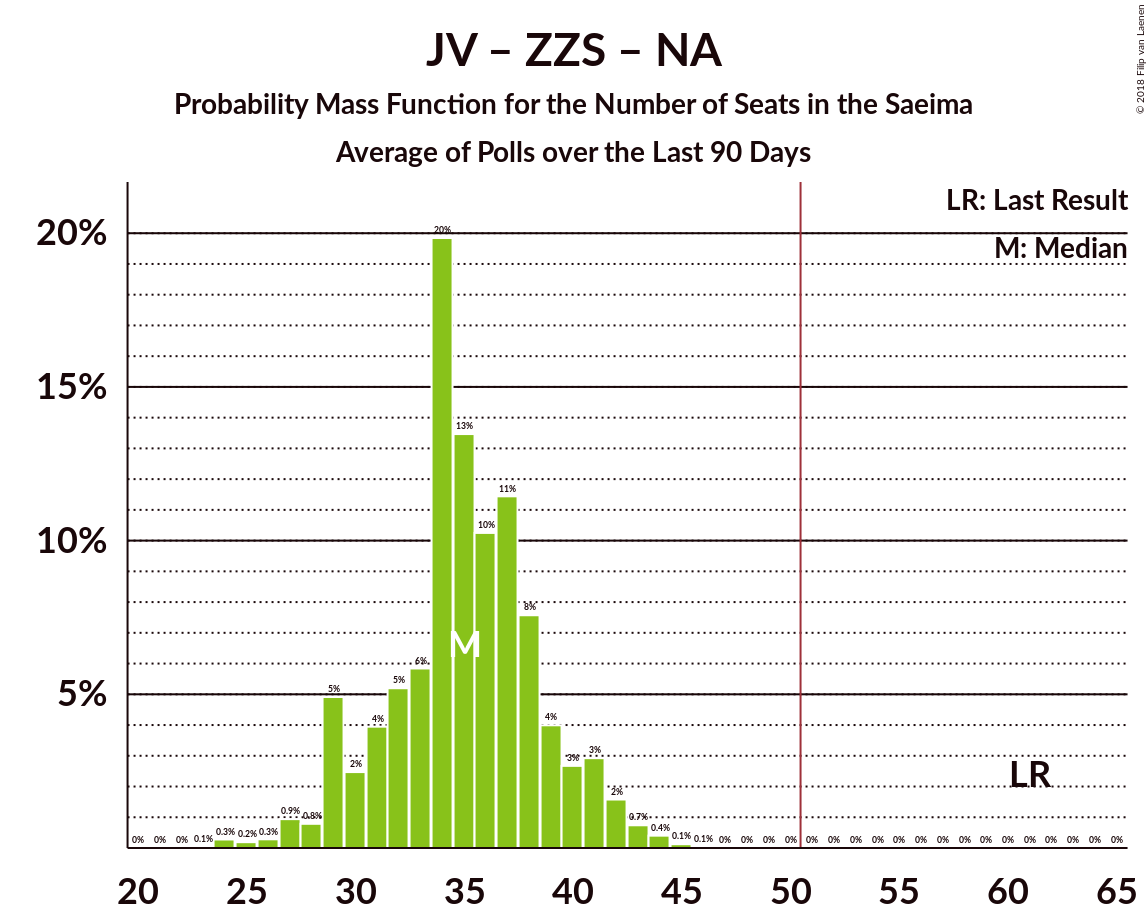
| Number of Seats | Probability | Accumulated | Special Marks |
|---|---|---|---|
| 23 | 0.1% | 100% | |
| 24 | 0.3% | 99.9% | |
| 25 | 0.2% | 99.6% | |
| 26 | 0.3% | 99.5% | |
| 27 | 0.9% | 99.2% | |
| 28 | 0.8% | 98% | |
| 29 | 5% | 97% | |
| 30 | 2% | 93% | |
| 31 | 4% | 90% | |
| 32 | 5% | 86% | |
| 33 | 6% | 81% | |
| 34 | 20% | 75% | |
| 35 | 13% | 55% | |
| 36 | 10% | 42% | |
| 37 | 11% | 32% | Median |
| 38 | 8% | 20% | |
| 39 | 4% | 13% | |
| 40 | 3% | 9% | |
| 41 | 3% | 6% | |
| 42 | 2% | 3% | |
| 43 | 0.7% | 1.3% | |
| 44 | 0.4% | 0.6% | |
| 45 | 0.1% | 0.2% | |
| 46 | 0.1% | 0.1% | |
| 47 | 0% | 0% | |
| 48 | 0% | 0% | |
| 49 | 0% | 0% | |
| 50 | 0% | 0% | |
| 51 | 0% | 0% | Majority |
| 52 | 0% | 0% | |
| 53 | 0% | 0% | |
| 54 | 0% | 0% | |
| 55 | 0% | 0% | |
| 56 | 0% | 0% | |
| 57 | 0% | 0% | |
| 58 | 0% | 0% | |
| 59 | 0% | 0% | |
| 60 | 0% | 0% | |
| 61 | 0% | 0% | Last Result |
Technical Information
- Number of polls included in this average: 4
- Lowest number of simulations done in a poll included in this average: 1,048,576
- Total number of simulations done in the polls included in this average: 4,194,304
- Error estimate: 4.54%