Opinion Poll by Ipsos for Het Laatste Nieuws, Le Soir, RTL TVi and VTM, 11–17 September 2024
Voting Intentions | Seats | Coalitions | Technical Information
Voting Intentions
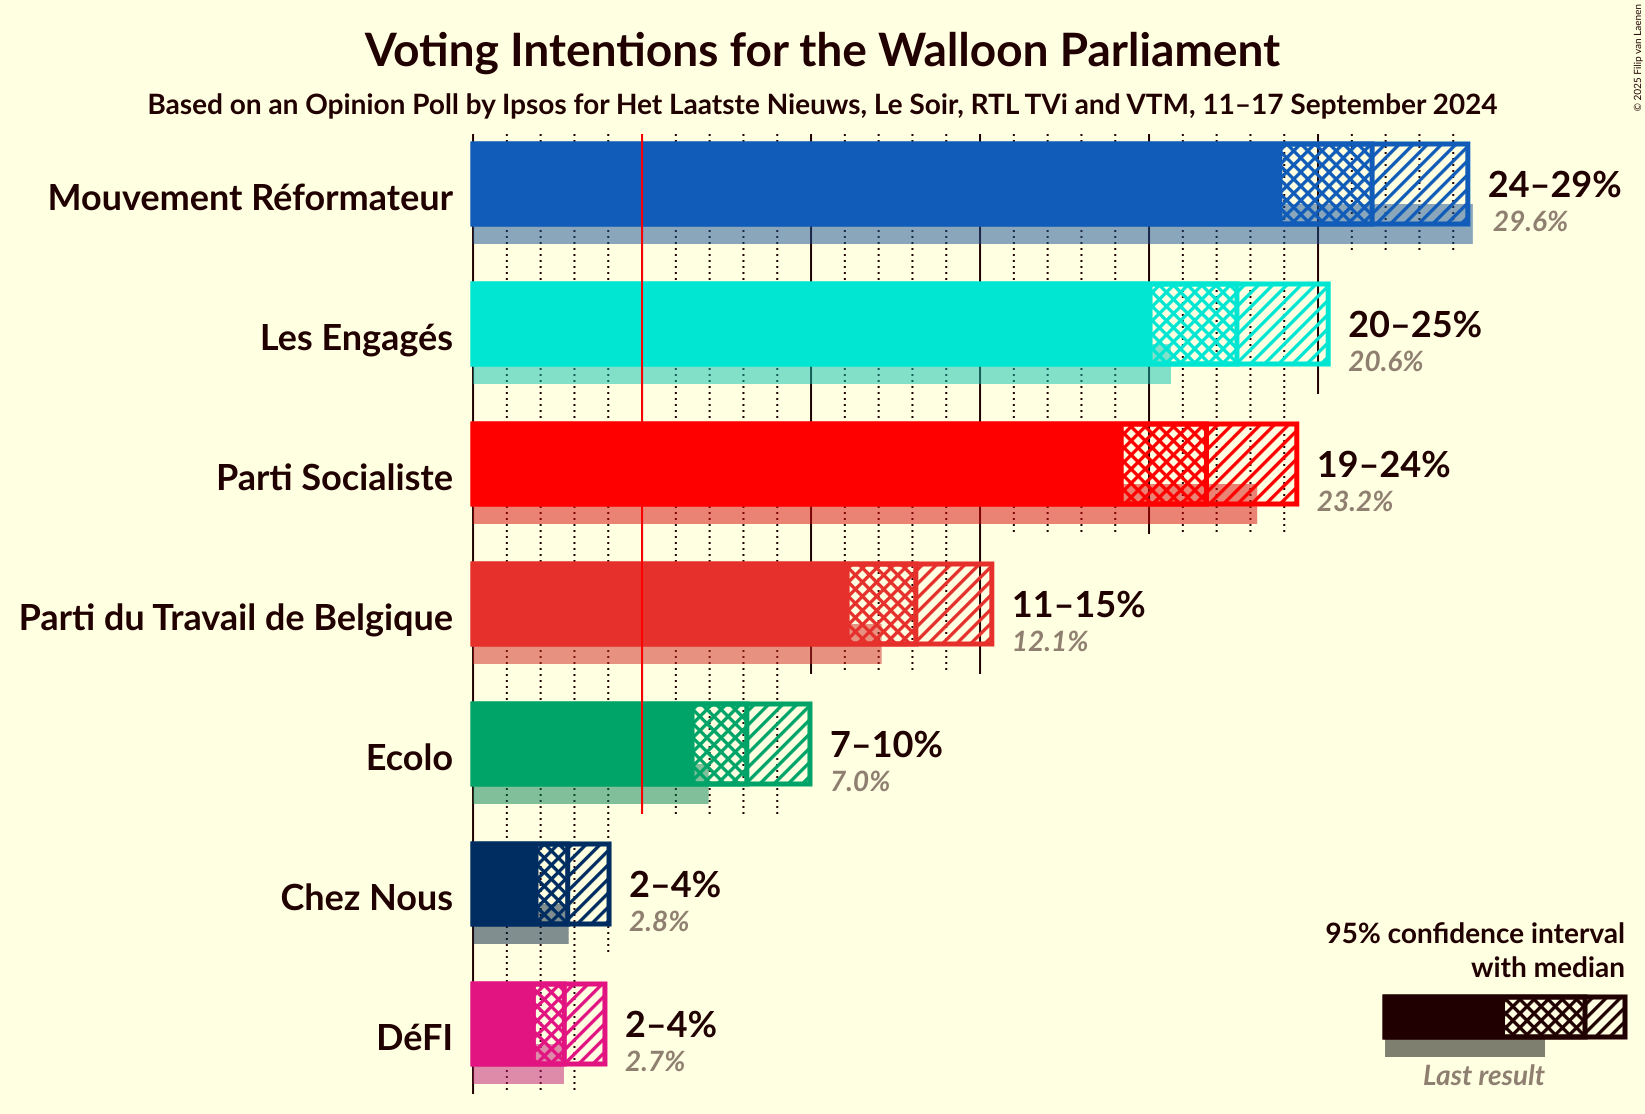
Confidence Intervals
| Party | Last Result | Poll Result | 80% Confidence Interval | 90% Confidence Interval | 95% Confidence Interval | 99% Confidence Interval |
|---|---|---|---|---|---|---|
| Mouvement Réformateur | 29.6% | 26.6% | 24.9–28.5% | 24.4–29.0% | 23.9–29.4% | 23.1–30.3% |
| Les Engagés | 20.6% | 22.6% | 21.0–24.4% | 20.5–24.9% | 20.1–25.3% | 19.3–26.2% |
| Parti Socialiste | 23.2% | 21.7% | 20.1–23.4% | 19.6–23.9% | 19.3–24.4% | 18.5–25.2% |
| Parti du Travail de Belgique | 12.1% | 13.1% | 11.8–14.6% | 11.4–15.0% | 11.1–15.3% | 10.6–16.1% |
| Ecolo | 7.0% | 8.1% | 7.1–9.3% | 6.8–9.7% | 6.6–10.0% | 6.1–10.6% |
| Chez Nous | 2.8% | 2.8% | 2.2–3.6% | 2.1–3.8% | 1.9–4.0% | 1.7–4.4% |
| DéFI | 2.7% | 2.7% | 2.1–3.5% | 2.0–3.7% | 1.9–3.9% | 1.6–4.3% |
Note: The poll result column reflects the actual value used in the calculations. Published results may vary slightly, and in addition be rounded to fewer digits.
Seats
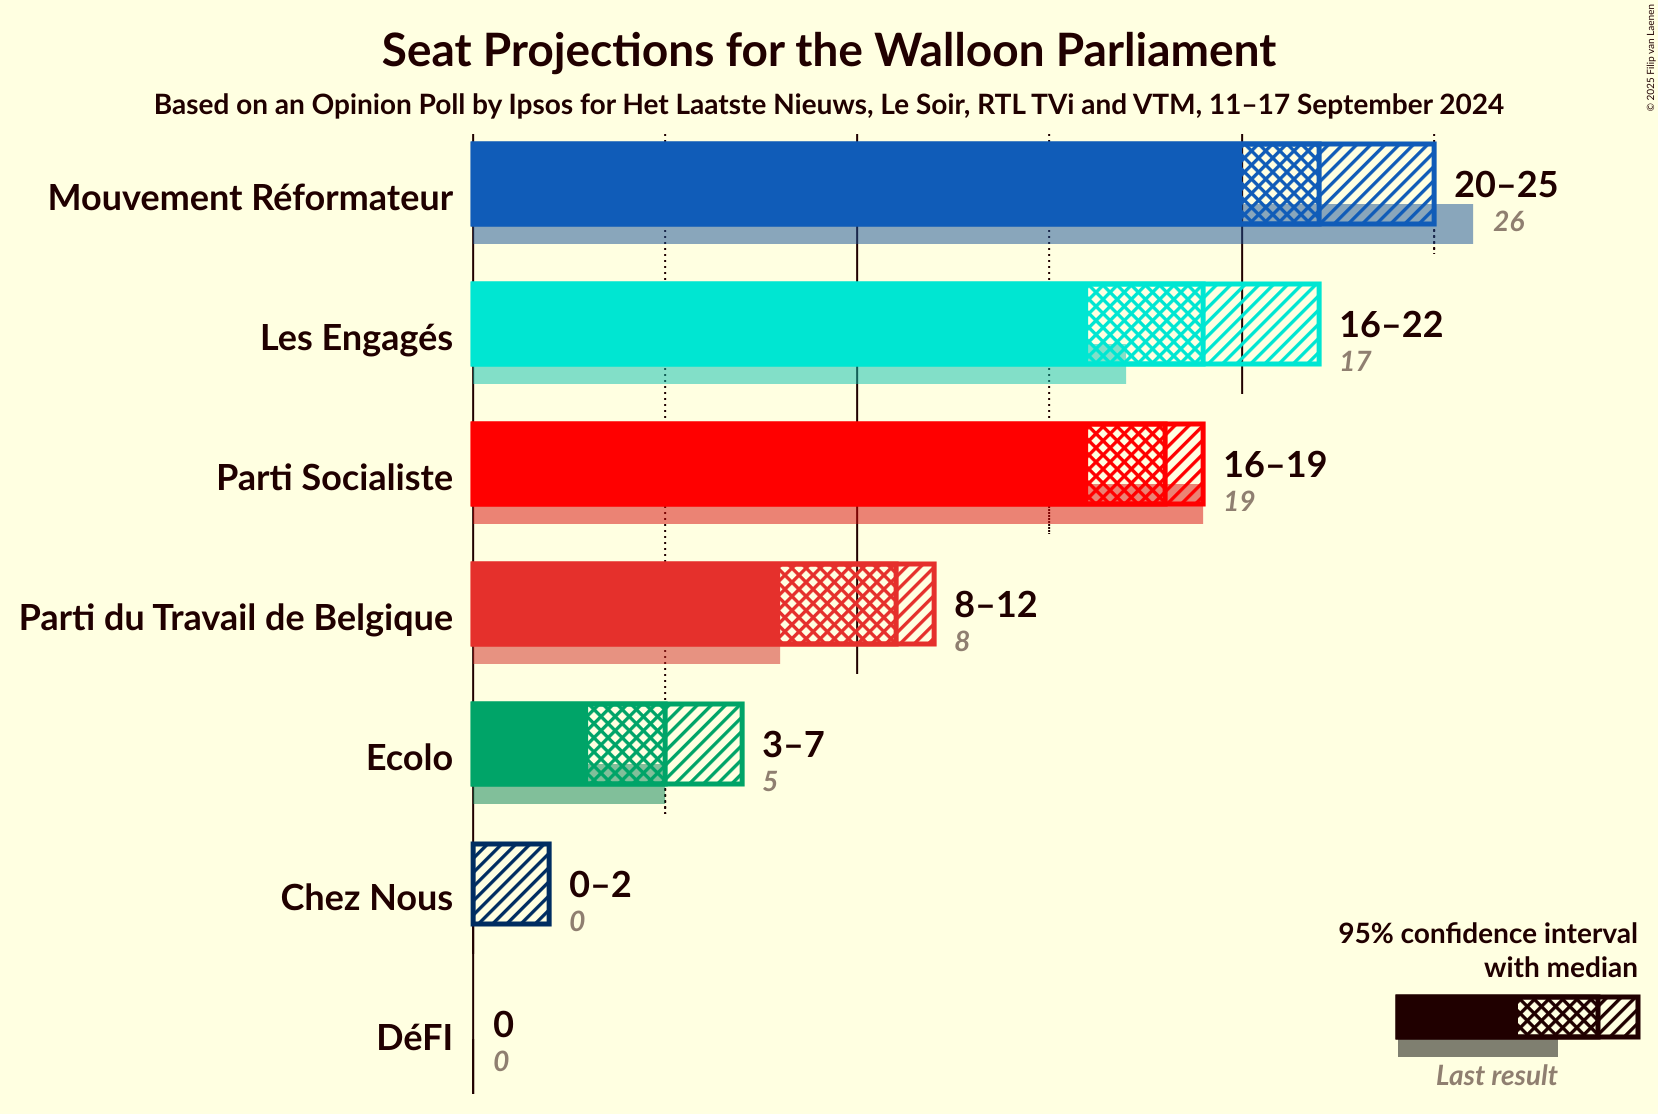
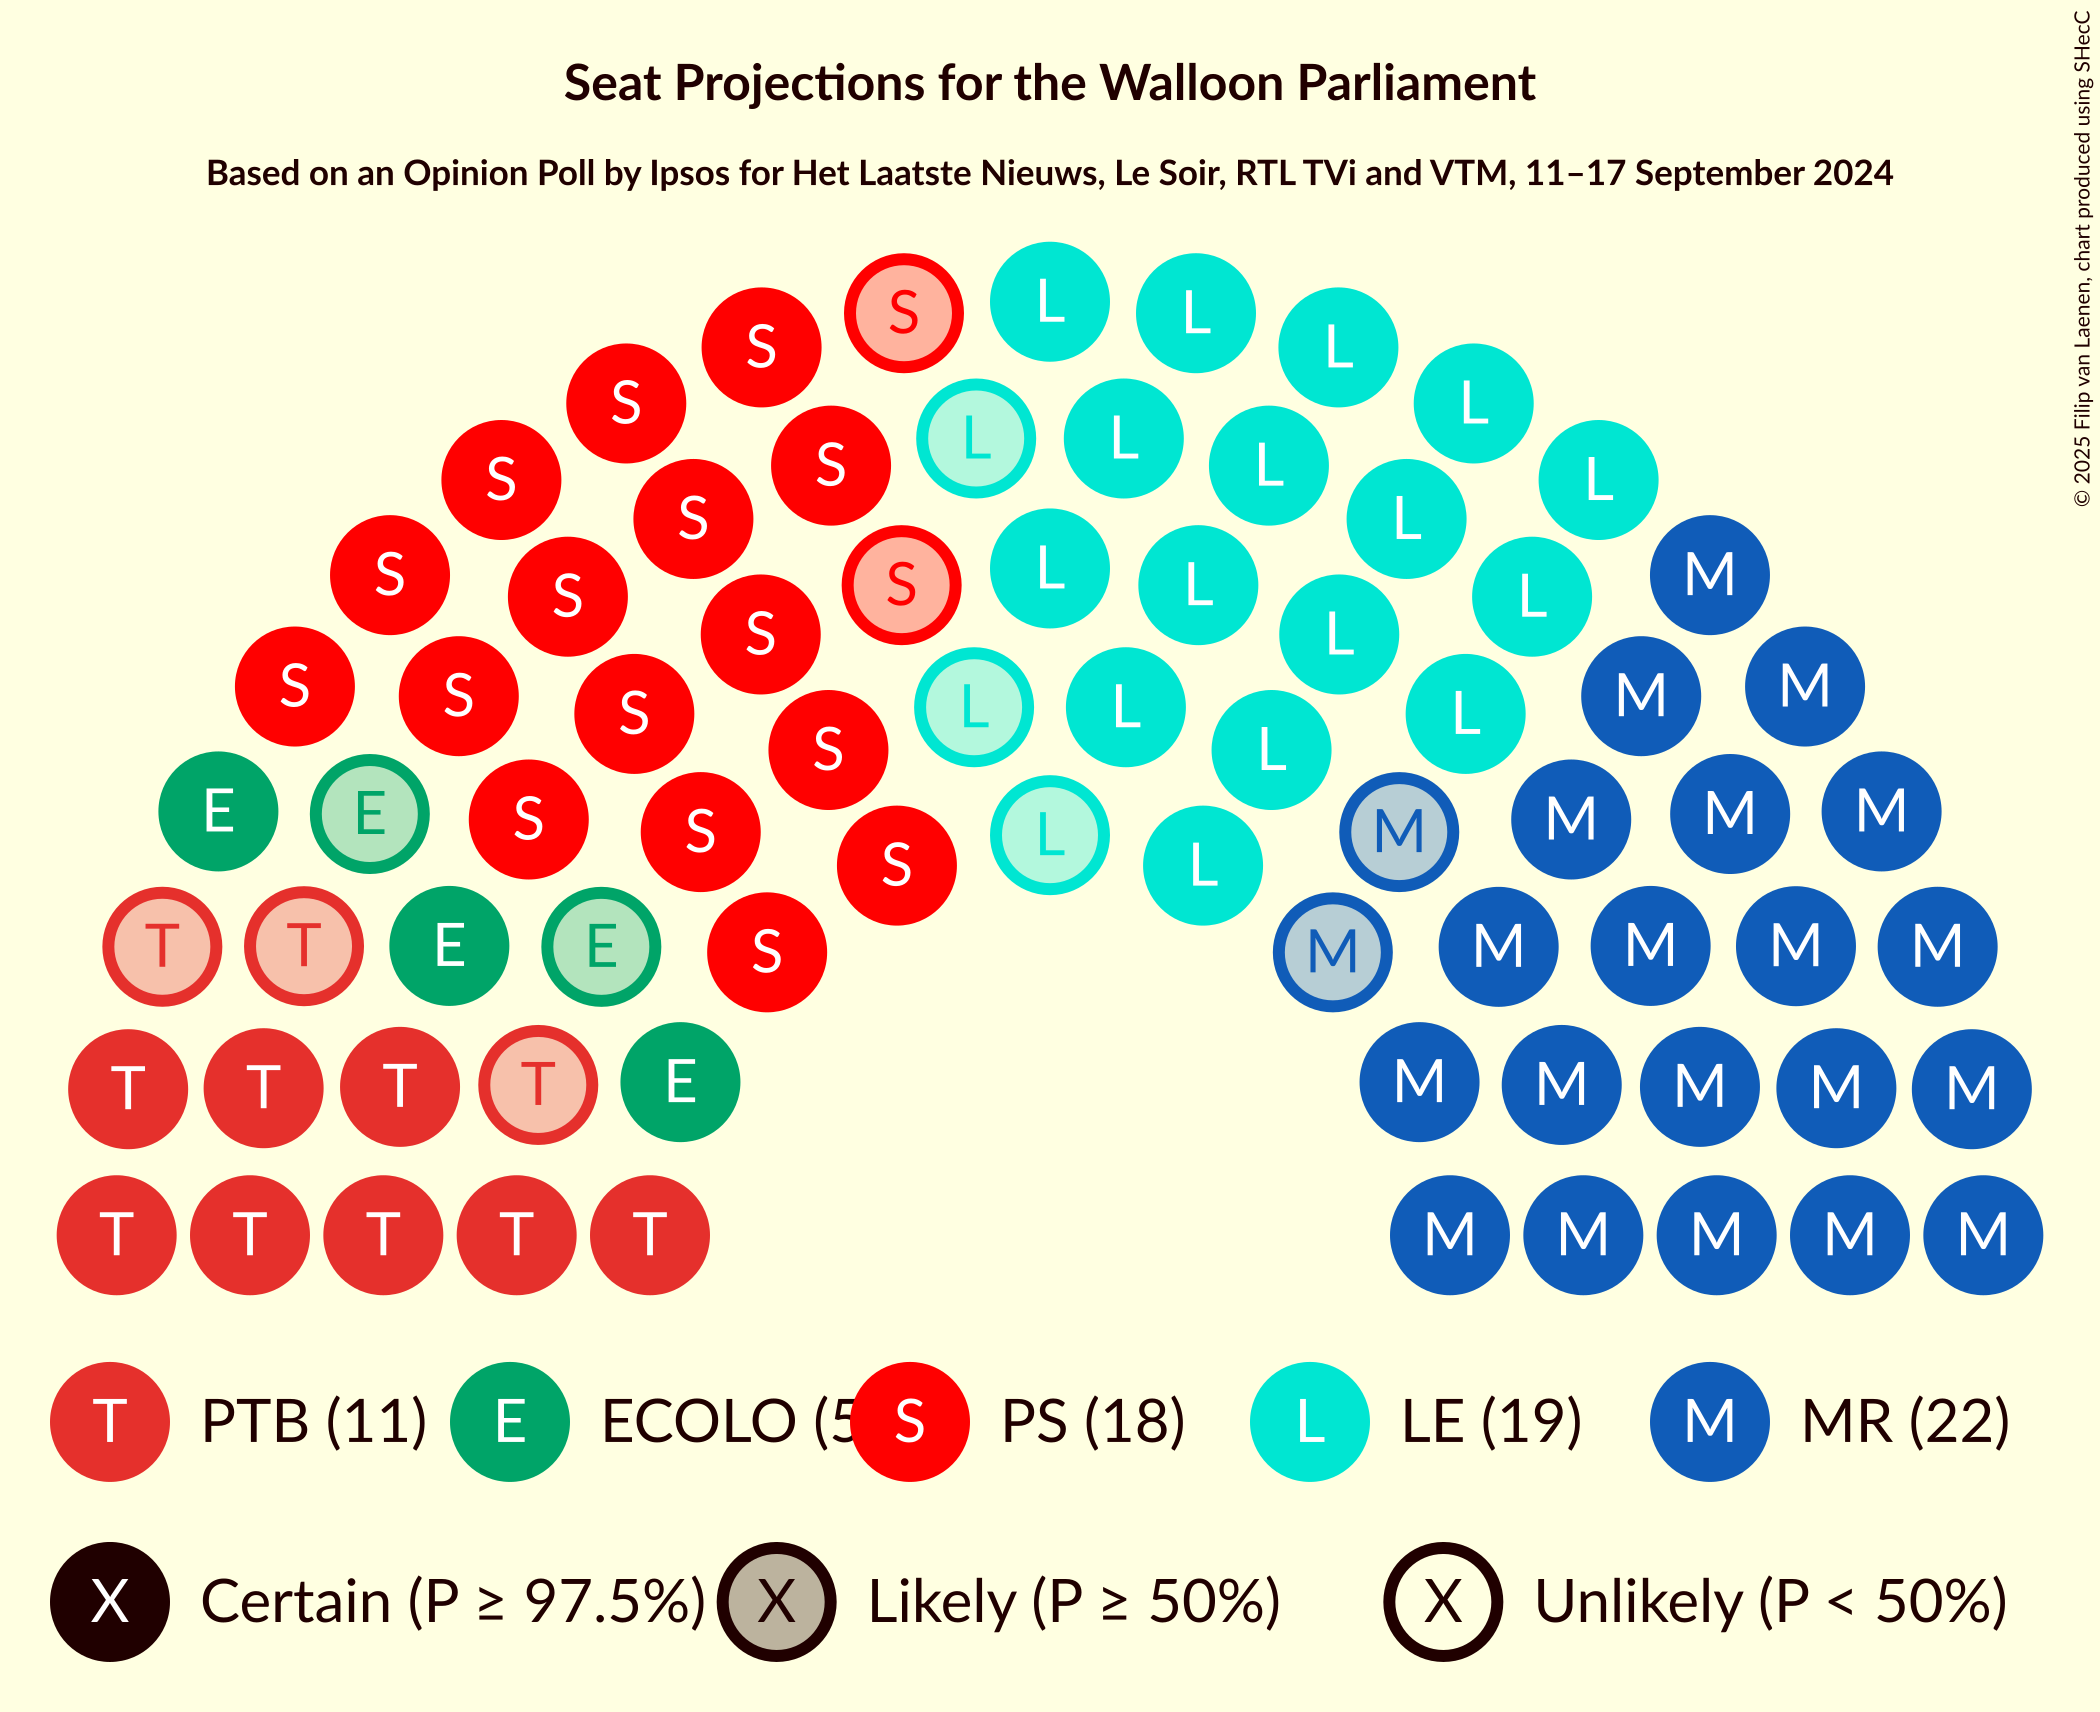
Confidence Intervals
| Party | Last Result | Median | 80% Confidence Interval | 90% Confidence Interval | 95% Confidence Interval | 99% Confidence Interval |
|---|---|---|---|---|---|---|
| Mouvement Réformateur | 26 | 22 | 21–24 | 21–25 | 20–25 | 20–27 |
| Les Engagés | 17 | 19 | 18–21 | 17–21 | 16–22 | 15–22 |
| Parti Socialiste | 19 | 18 | 17–19 | 16–19 | 16–19 | 16–21 |
| Parti du Travail de Belgique | 8 | 11 | 8–11 | 8–11 | 8–12 | 8–13 |
| Ecolo | 5 | 5 | 5–6 | 4–6 | 3–7 | 1–8 |
| Chez Nous | 0 | 0 | 0–2 | 0–2 | 0–2 | 0–3 |
| DéFI | 0 | 0 | 0 | 0 | 0 | 0 |
Mouvement Réformateur
For a full overview of the results for this party, see the Mouvement Réformateur page.
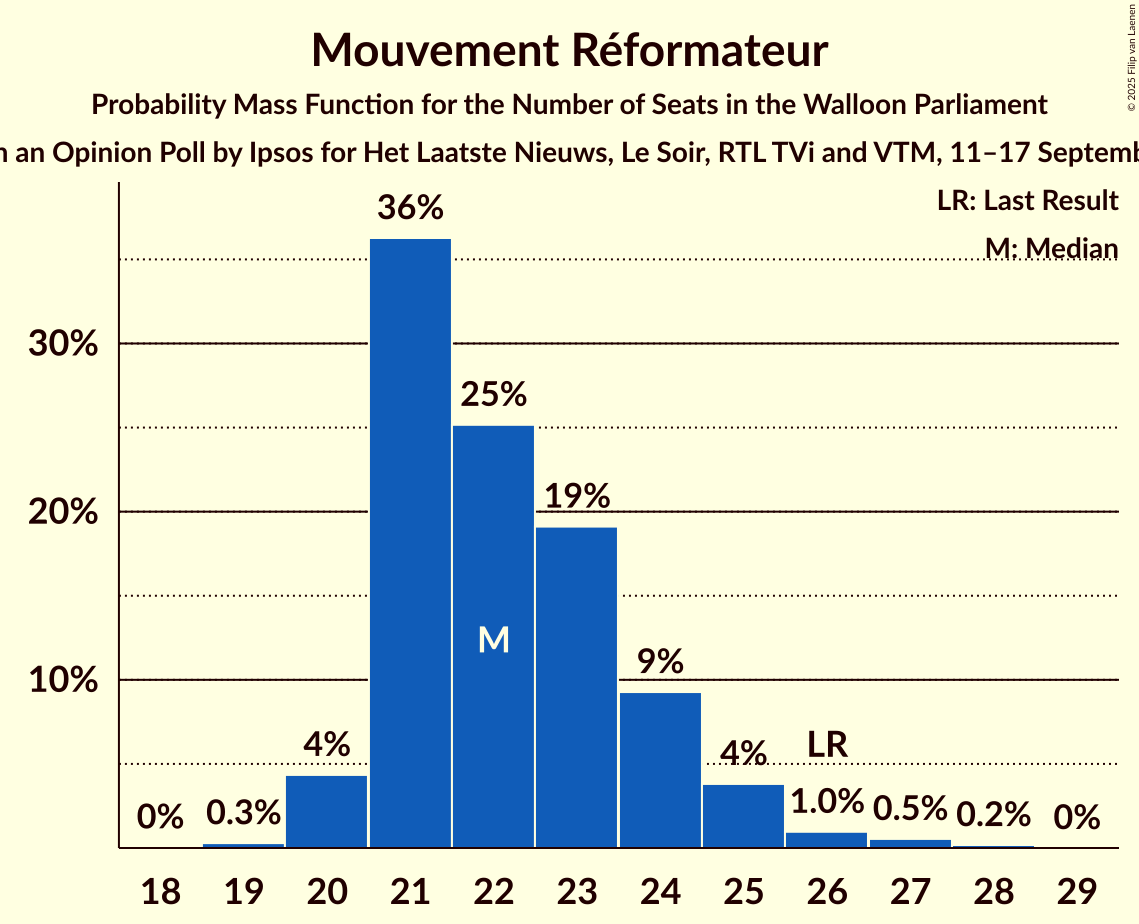
| Number of Seats | Probability | Accumulated | Special Marks |
|---|---|---|---|
| 19 | 0.3% | 100% | |
| 20 | 4% | 99.7% | |
| 21 | 36% | 95% | |
| 22 | 25% | 59% | Median |
| 23 | 19% | 34% | |
| 24 | 9% | 15% | |
| 25 | 4% | 5% | |
| 26 | 1.0% | 2% | Last Result |
| 27 | 0.5% | 0.7% | |
| 28 | 0.2% | 0.2% | |
| 29 | 0% | 0% |
Les Engagés
For a full overview of the results for this party, see the Les Engagés page.
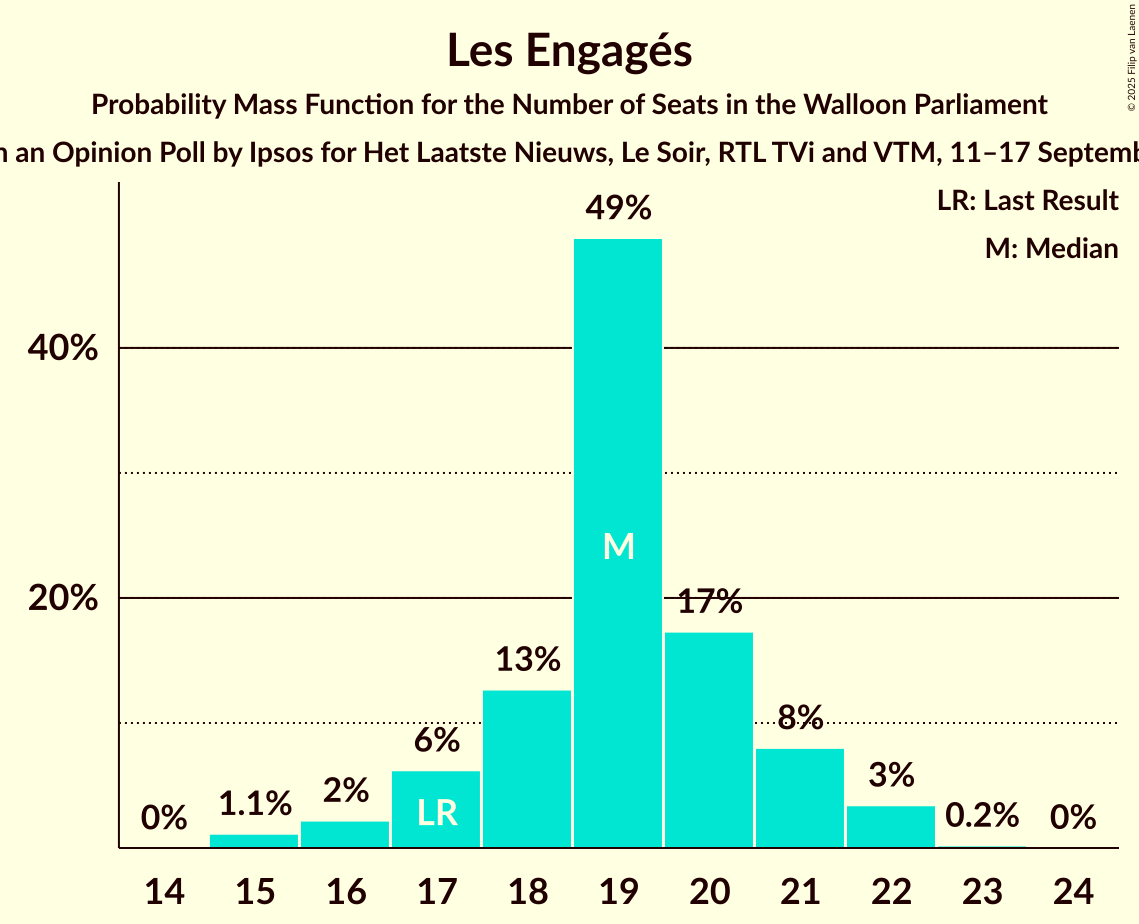
| Number of Seats | Probability | Accumulated | Special Marks |
|---|---|---|---|
| 15 | 1.1% | 100% | |
| 16 | 2% | 98.9% | |
| 17 | 6% | 97% | Last Result |
| 18 | 13% | 90% | |
| 19 | 49% | 78% | Median |
| 20 | 17% | 29% | |
| 21 | 8% | 12% | |
| 22 | 3% | 4% | |
| 23 | 0.2% | 0.2% | |
| 24 | 0% | 0% |
Parti Socialiste
For a full overview of the results for this party, see the Parti Socialiste page.
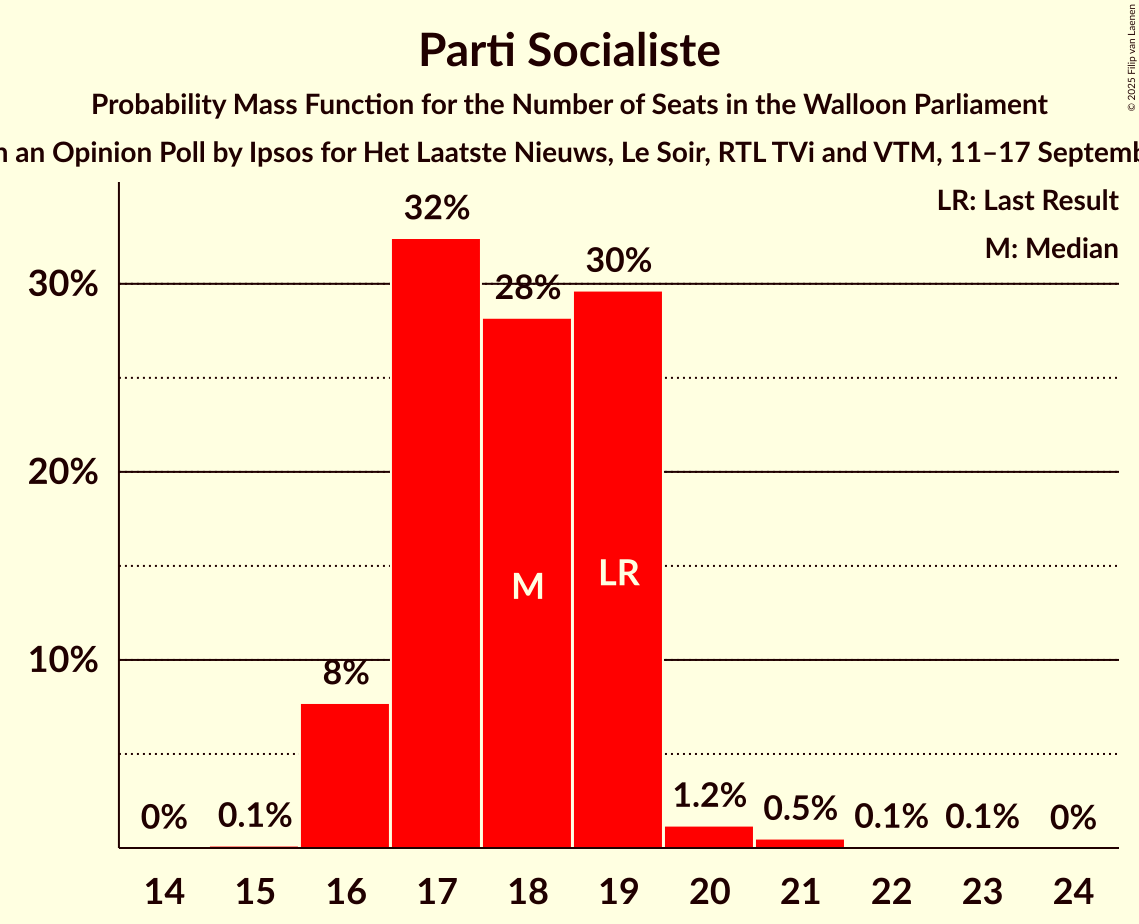
| Number of Seats | Probability | Accumulated | Special Marks |
|---|---|---|---|
| 15 | 0.1% | 100% | |
| 16 | 8% | 99.8% | |
| 17 | 32% | 92% | |
| 18 | 28% | 60% | Median |
| 19 | 30% | 31% | Last Result |
| 20 | 1.2% | 2% | |
| 21 | 0.5% | 0.6% | |
| 22 | 0.1% | 0.1% | |
| 23 | 0.1% | 0.1% | |
| 24 | 0% | 0% |
Parti du Travail de Belgique
For a full overview of the results for this party, see the Parti du Travail de Belgique page.
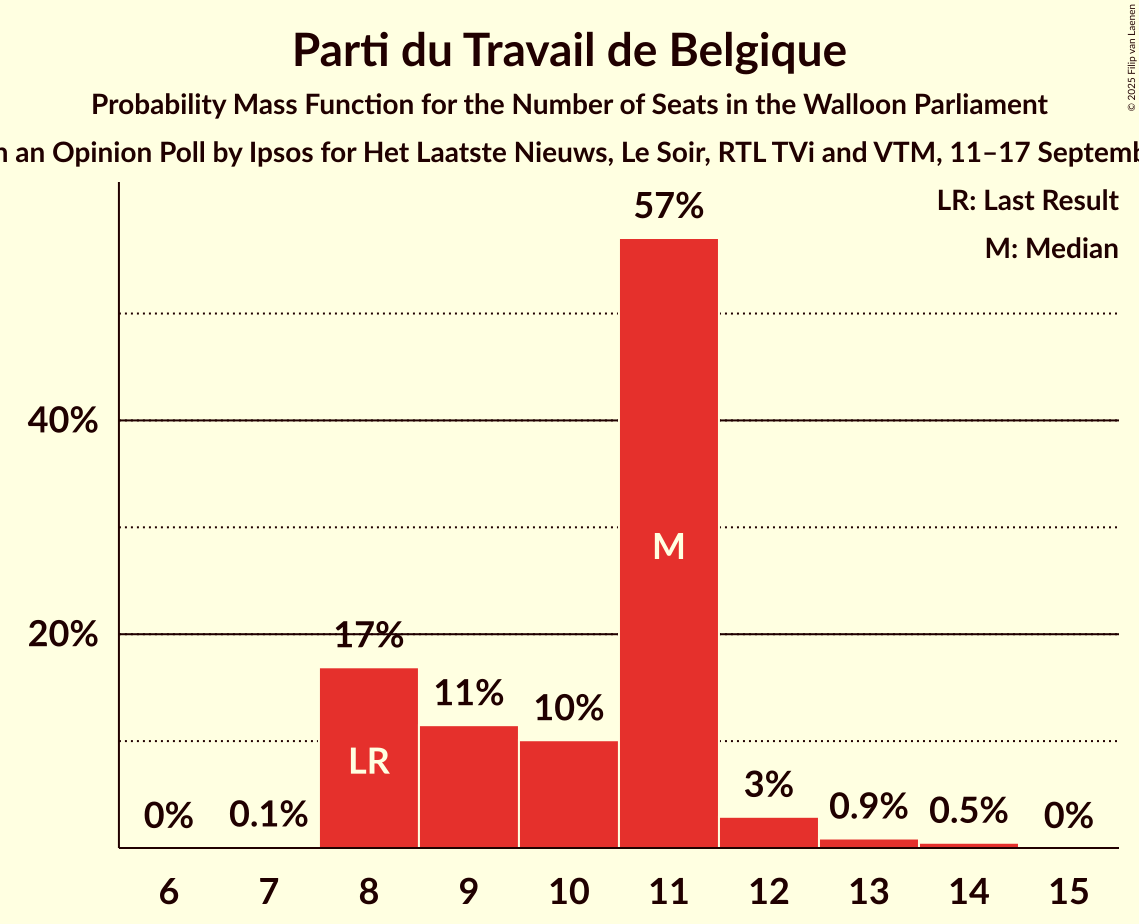
| Number of Seats | Probability | Accumulated | Special Marks |
|---|---|---|---|
| 7 | 0.1% | 100% | |
| 8 | 17% | 99.8% | Last Result |
| 9 | 11% | 83% | |
| 10 | 10% | 71% | |
| 11 | 57% | 61% | Median |
| 12 | 3% | 4% | |
| 13 | 0.9% | 1.4% | |
| 14 | 0.5% | 0.5% | |
| 15 | 0% | 0% |
Ecolo
For a full overview of the results for this party, see the Ecolo page.
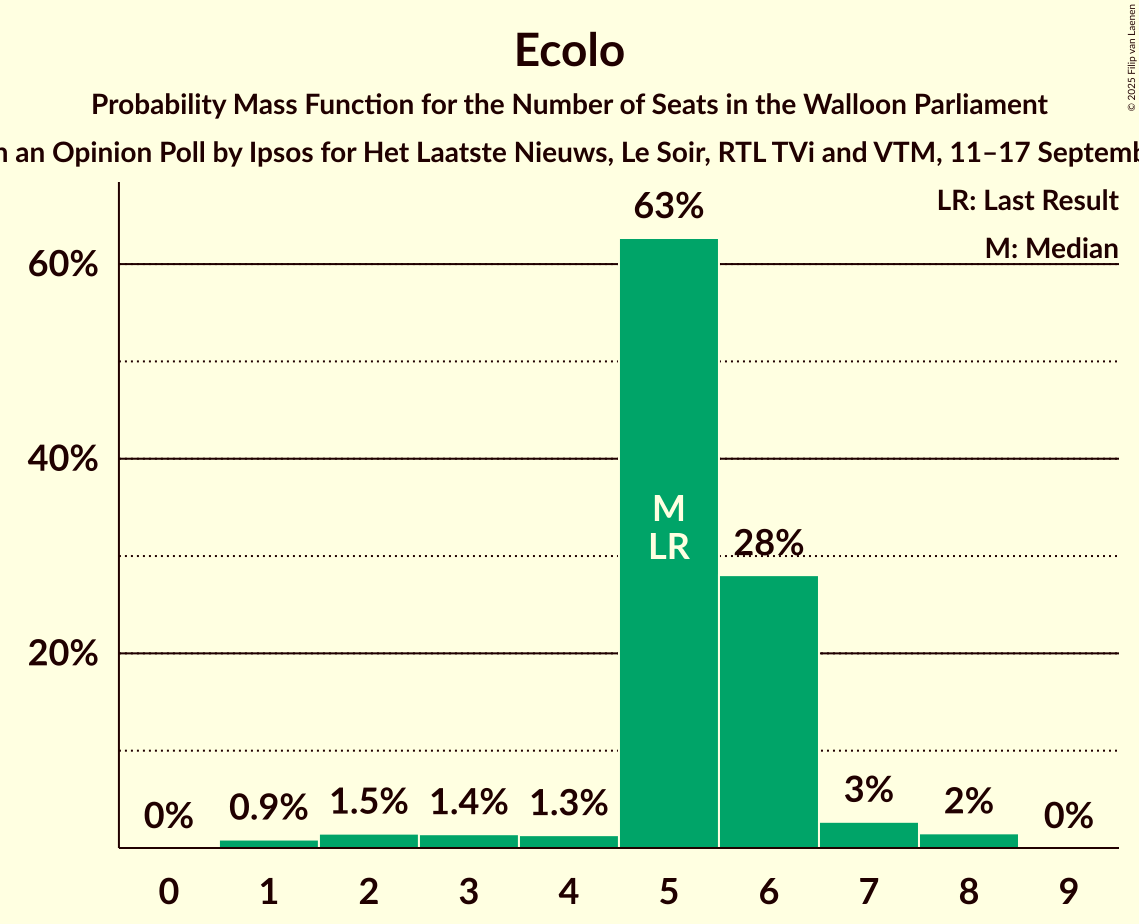
| Number of Seats | Probability | Accumulated | Special Marks |
|---|---|---|---|
| 1 | 0.9% | 100% | |
| 2 | 1.5% | 99.1% | |
| 3 | 1.4% | 98% | |
| 4 | 1.3% | 96% | |
| 5 | 63% | 95% | Last Result, Median |
| 6 | 28% | 32% | |
| 7 | 3% | 4% | |
| 8 | 2% | 2% | |
| 9 | 0% | 0% |
Chez Nous
For a full overview of the results for this party, see the Chez Nous page.
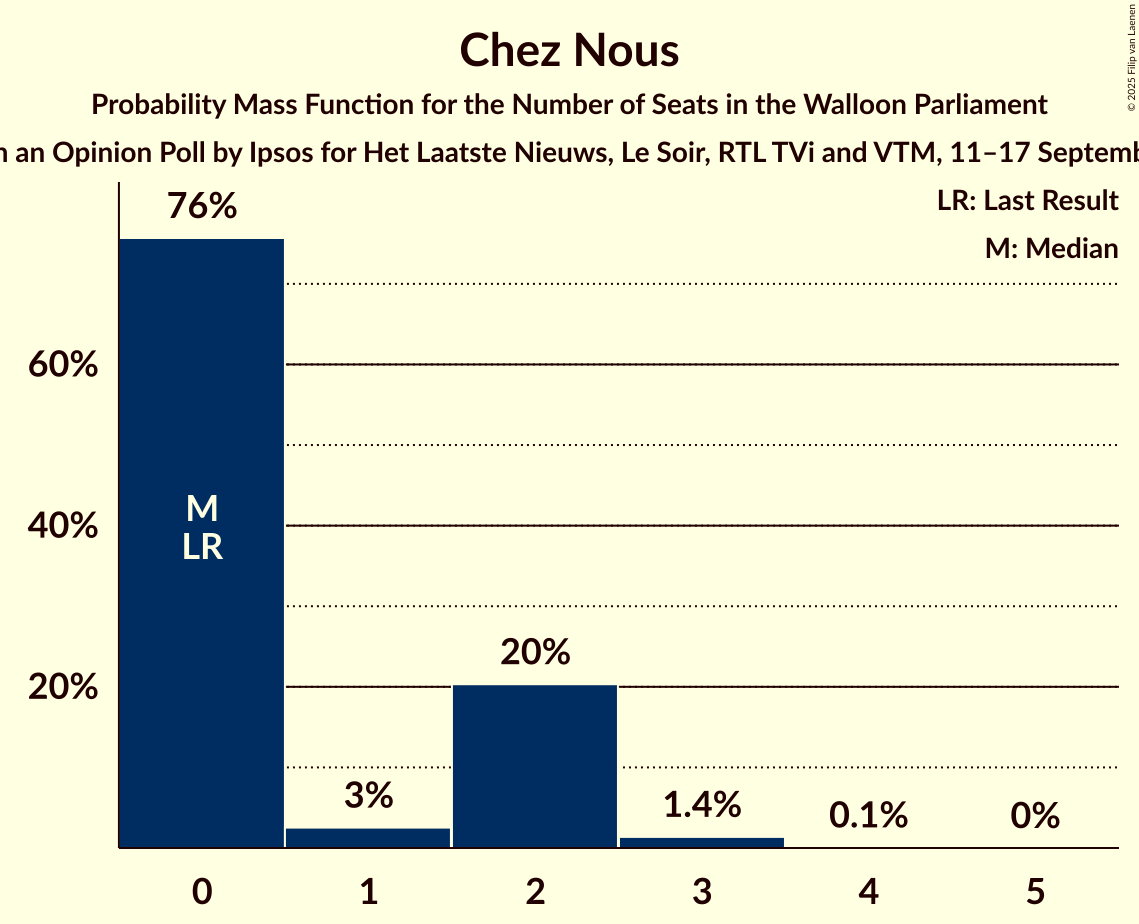
| Number of Seats | Probability | Accumulated | Special Marks |
|---|---|---|---|
| 0 | 76% | 100% | Last Result, Median |
| 1 | 3% | 24% | |
| 2 | 20% | 22% | |
| 3 | 1.4% | 1.5% | |
| 4 | 0.1% | 0.1% | |
| 5 | 0% | 0% |
DéFI
For a full overview of the results for this party, see the DéFI page.
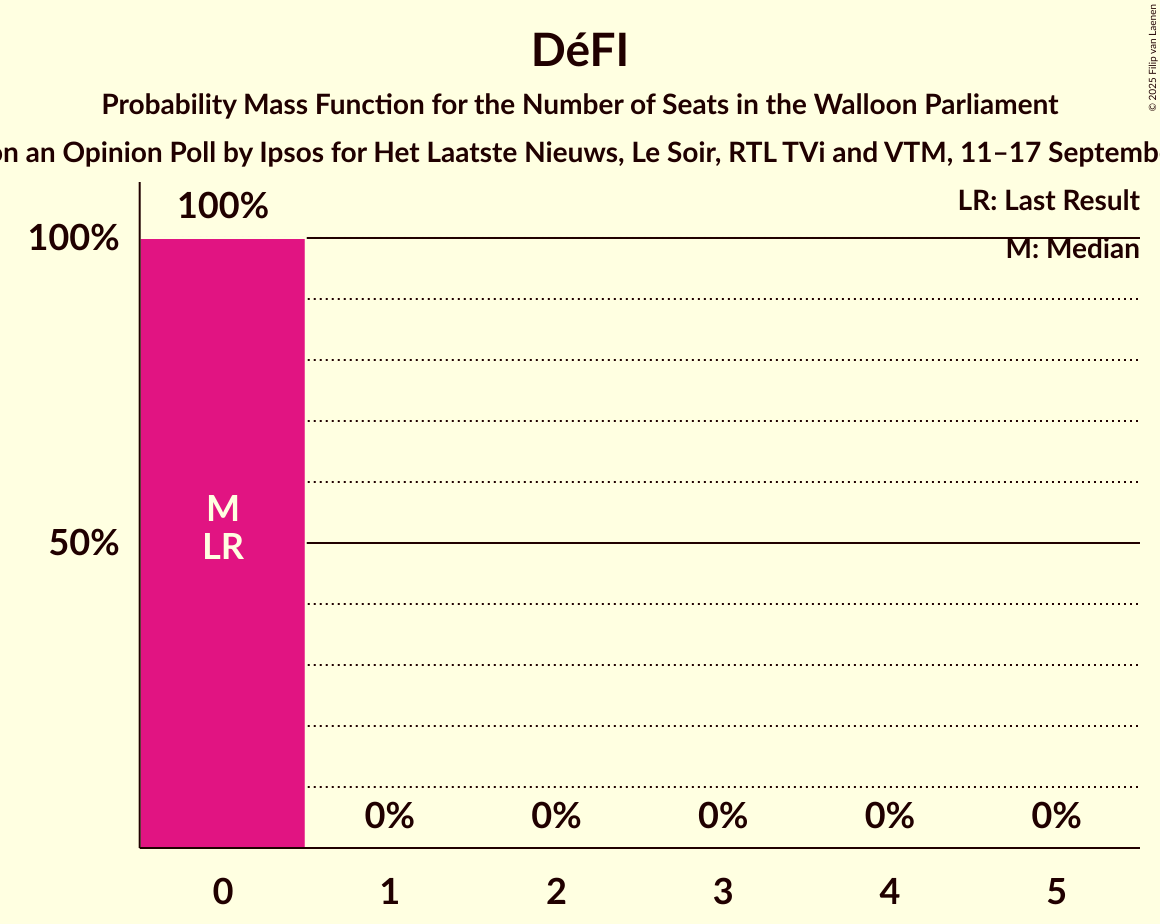
| Number of Seats | Probability | Accumulated | Special Marks |
|---|---|---|---|
| 0 | 100% | 100% | Last Result, Median |
Coalitions
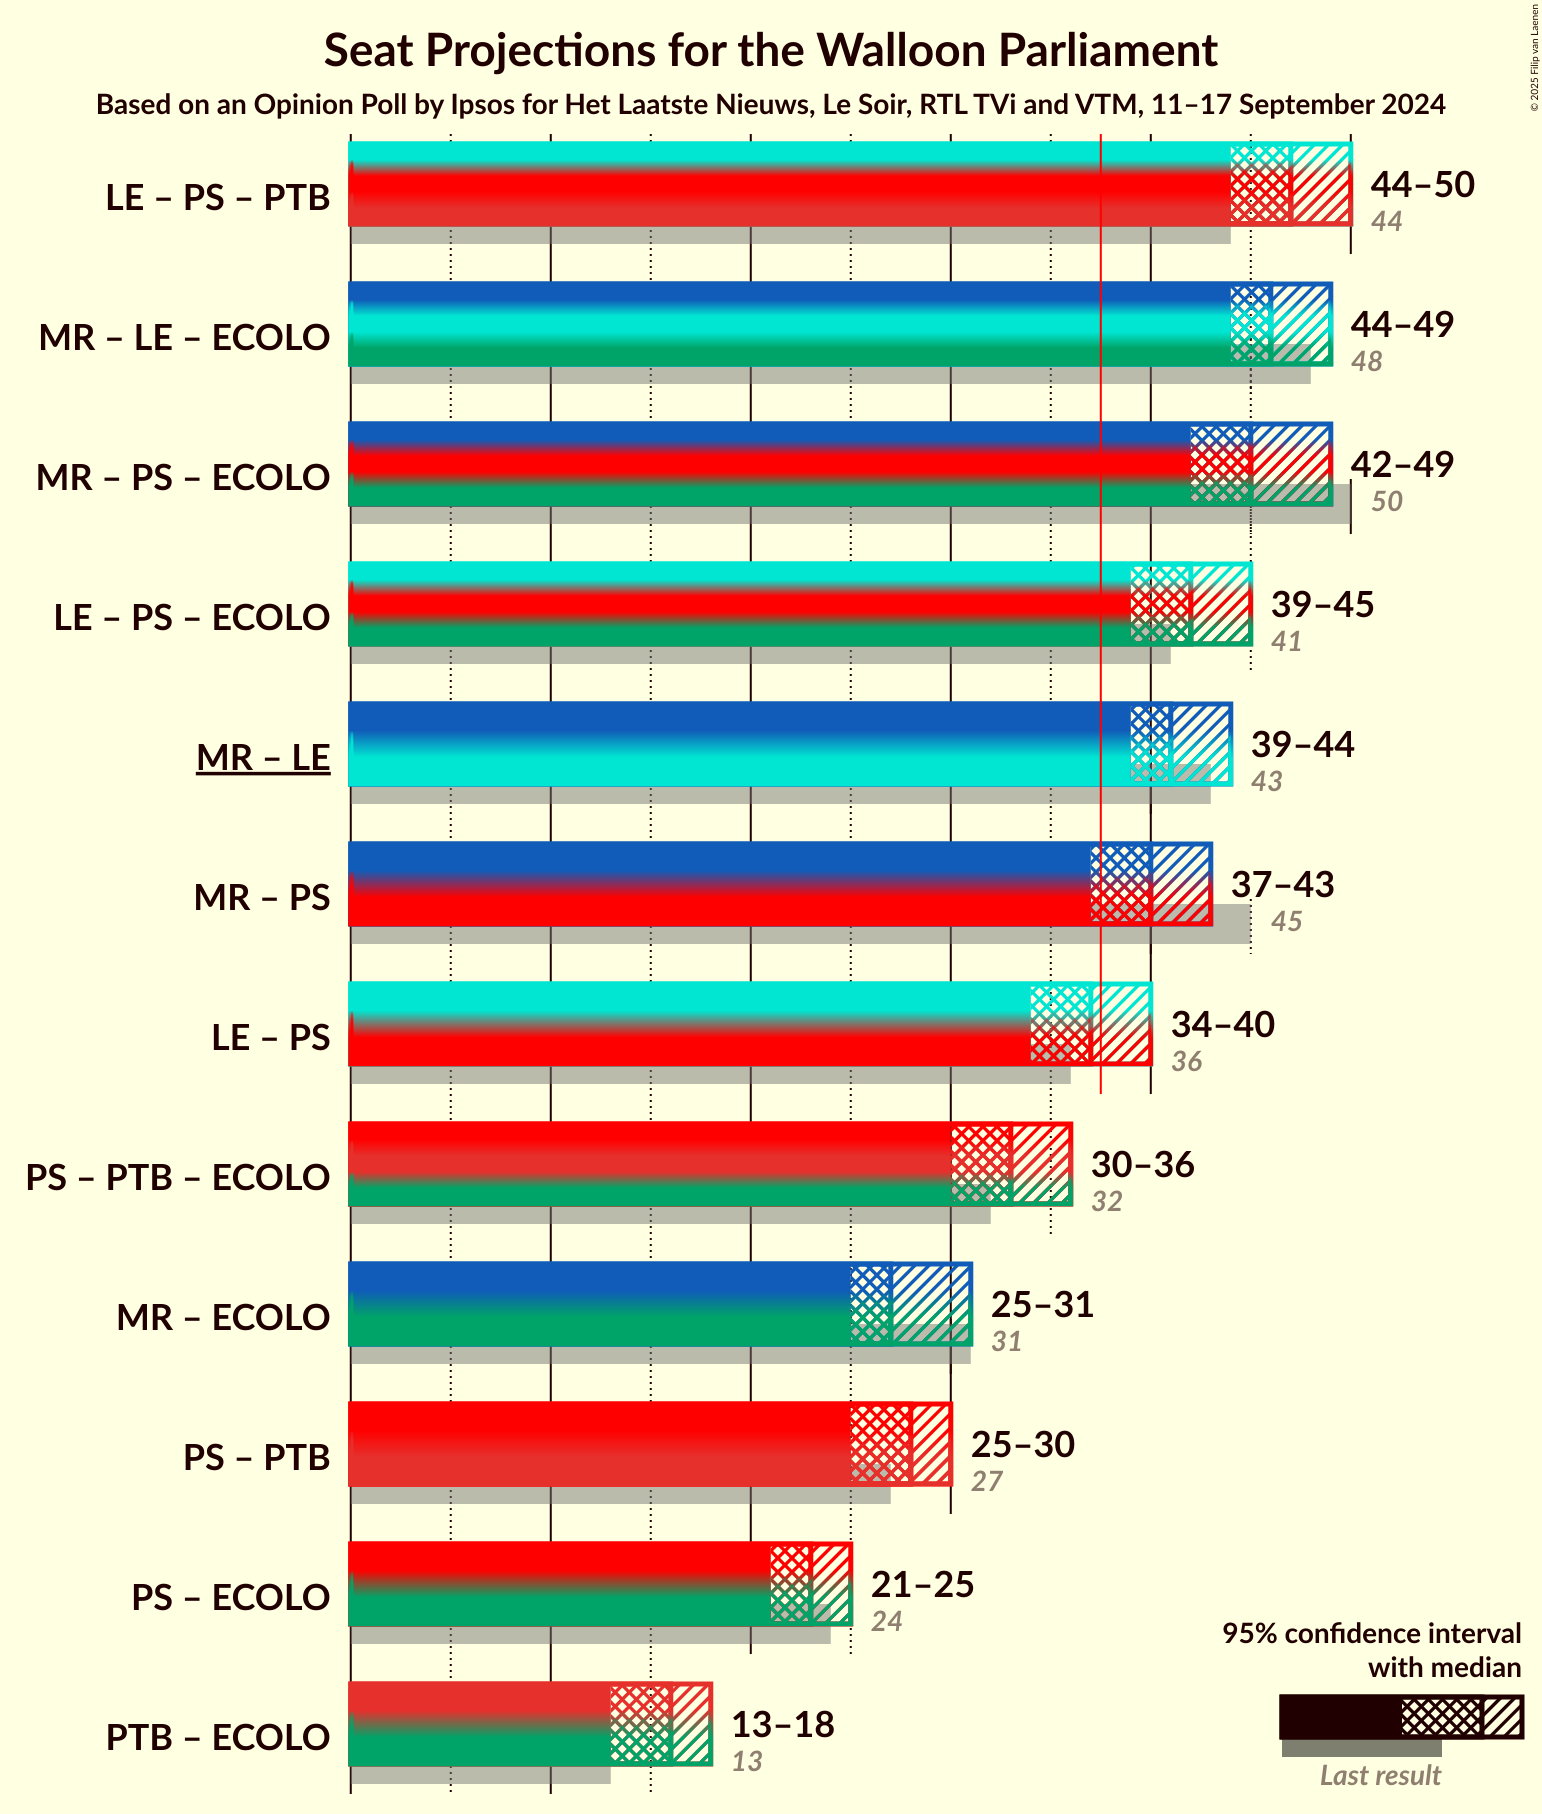
Confidence Intervals
| Coalition | Last Result | Median | Majority? | 80% Confidence Interval | 90% Confidence Interval | 95% Confidence Interval | 99% Confidence Interval |
|---|---|---|---|---|---|---|---|
| Les Engagés – Parti Socialiste – Parti du Travail de Belgique | 44 | 47 | 100% | 45–49 | 44–49 | 44–50 | 42–51 |
| Mouvement Réformateur – Les Engagés – Ecolo | 48 | 46 | 100% | 45–48 | 45–49 | 44–49 | 43–50 |
| Mouvement Réformateur – Parti Socialiste – Ecolo | 50 | 45 | 100% | 43–47 | 43–48 | 42–49 | 41–50 |
| Les Engagés – Parti Socialiste – Ecolo | 41 | 42 | 99.5% | 40–44 | 40–45 | 39–45 | 37–46 |
| Mouvement Réformateur – Les Engagés | 43 | 41 | 99.4% | 40–43 | 39–44 | 39–44 | 37–45 |
| Mouvement Réformateur – Parti Socialiste | 45 | 40 | 96% | 38–42 | 38–43 | 37–43 | 37–45 |
| Les Engagés – Parti Socialiste | 36 | 37 | 39% | 35–39 | 35–39 | 34–40 | 33–41 |
| Parti Socialiste – Parti du Travail de Belgique – Ecolo | 32 | 33 | 0.2% | 31–35 | 31–35 | 30–36 | 29–37 |
| Mouvement Réformateur – Ecolo | 31 | 27 | 0% | 26–29 | 26–30 | 25–31 | 23–32 |
| Parti Socialiste – Parti du Travail de Belgique | 27 | 28 | 0% | 26–30 | 26–30 | 25–30 | 24–31 |
| Parti Socialiste – Ecolo | 24 | 23 | 0% | 22–24 | 21–25 | 21–25 | 19–27 |
| Parti du Travail de Belgique – Ecolo | 13 | 16 | 0% | 13–17 | 13–17 | 13–18 | 12–19 |
Les Engagés – Parti Socialiste – Parti du Travail de Belgique
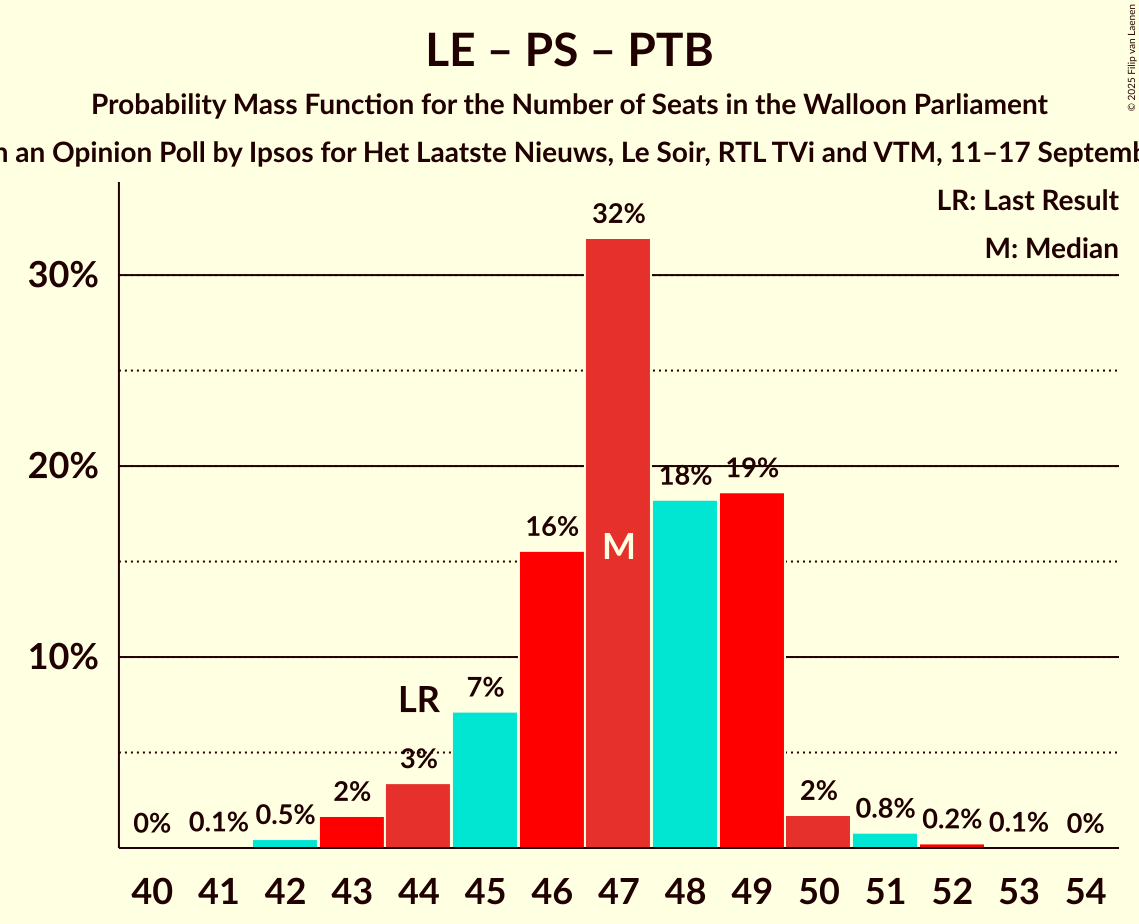
| Number of Seats | Probability | Accumulated | Special Marks |
|---|---|---|---|
| 41 | 0.1% | 100% | |
| 42 | 0.5% | 99.9% | |
| 43 | 2% | 99.4% | |
| 44 | 3% | 98% | Last Result |
| 45 | 7% | 94% | |
| 46 | 16% | 87% | |
| 47 | 32% | 72% | |
| 48 | 18% | 40% | Median |
| 49 | 19% | 21% | |
| 50 | 2% | 3% | |
| 51 | 0.8% | 1.1% | |
| 52 | 0.2% | 0.3% | |
| 53 | 0.1% | 0.1% | |
| 54 | 0% | 0% |
Mouvement Réformateur – Les Engagés – Ecolo
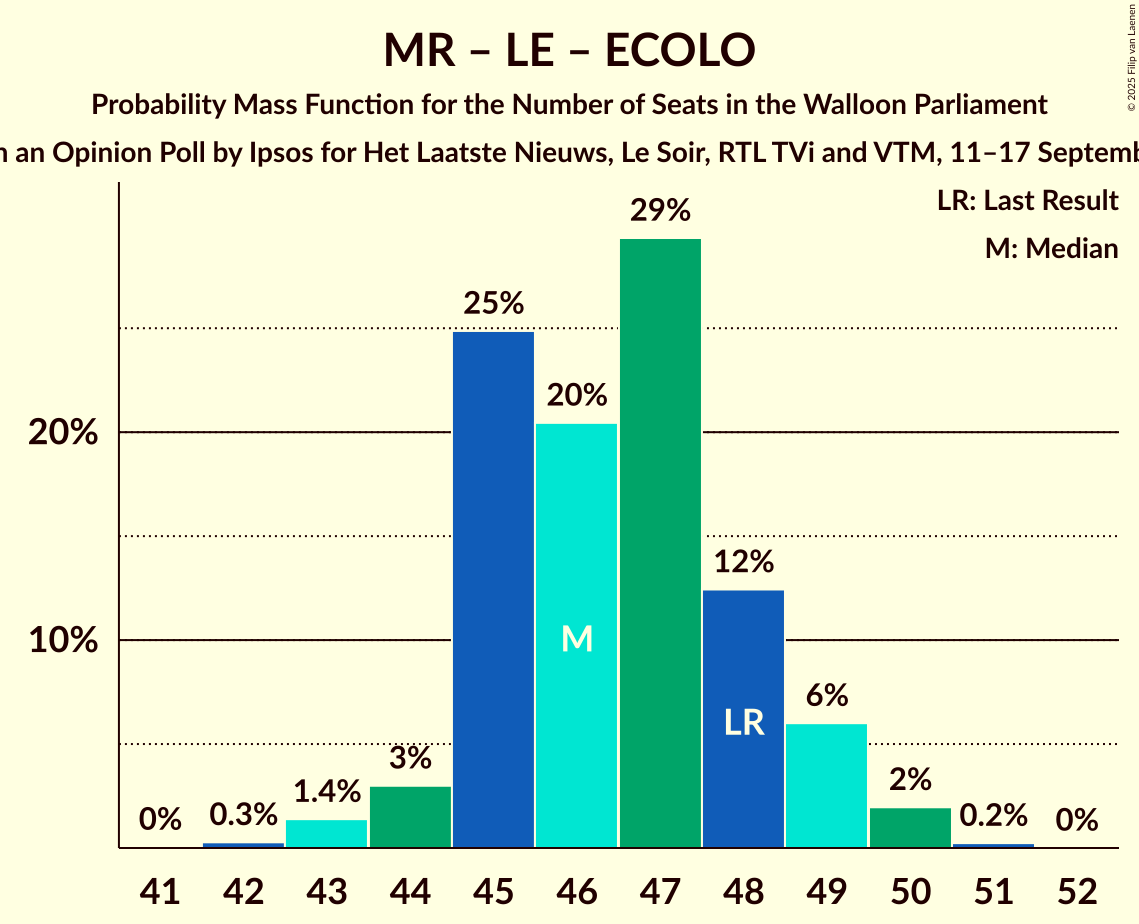
| Number of Seats | Probability | Accumulated | Special Marks |
|---|---|---|---|
| 41 | 0% | 100% | |
| 42 | 0.3% | 99.9% | |
| 43 | 1.4% | 99.7% | |
| 44 | 3% | 98% | |
| 45 | 25% | 95% | |
| 46 | 20% | 70% | Median |
| 47 | 29% | 50% | |
| 48 | 12% | 21% | Last Result |
| 49 | 6% | 8% | |
| 50 | 2% | 2% | |
| 51 | 0.2% | 0.2% | |
| 52 | 0% | 0% |
Mouvement Réformateur – Parti Socialiste – Ecolo
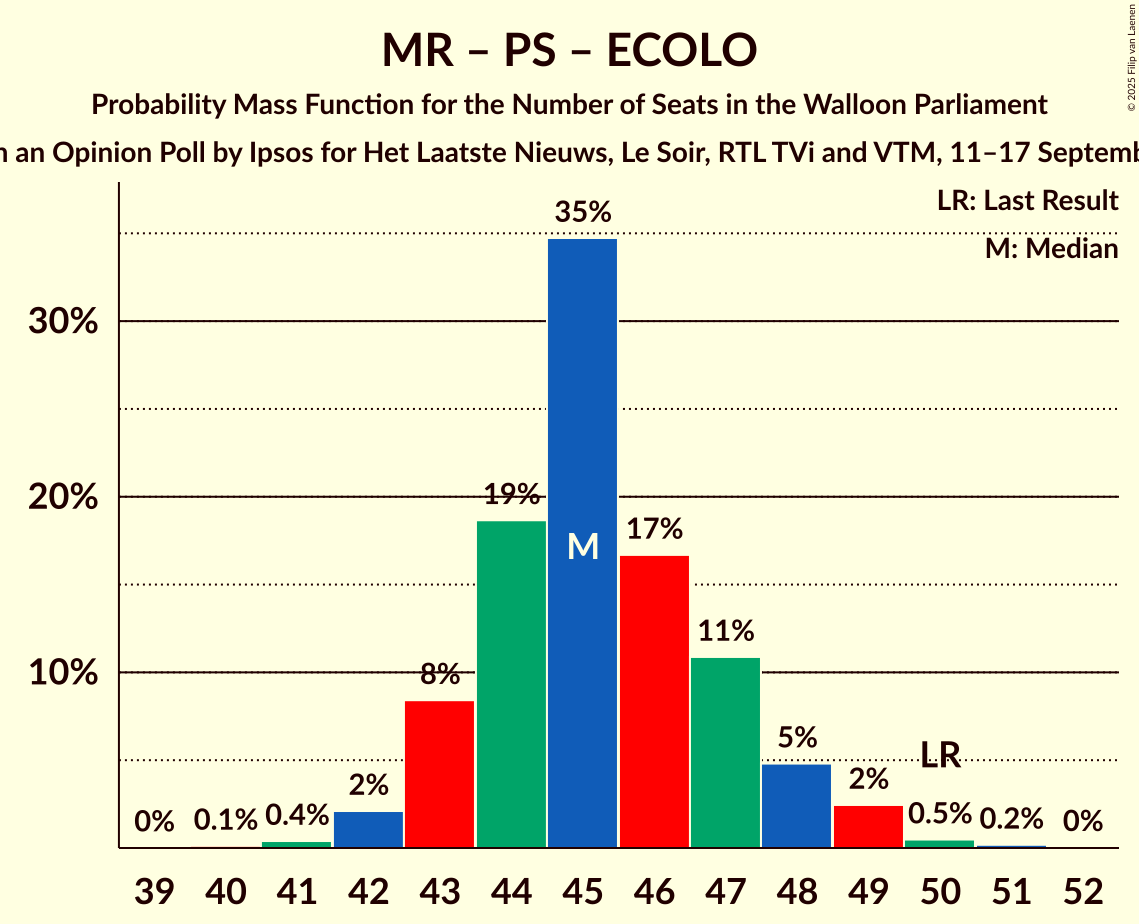
| Number of Seats | Probability | Accumulated | Special Marks |
|---|---|---|---|
| 40 | 0.1% | 100% | |
| 41 | 0.4% | 99.8% | |
| 42 | 2% | 99.5% | |
| 43 | 8% | 97% | |
| 44 | 19% | 89% | |
| 45 | 35% | 70% | Median |
| 46 | 17% | 36% | |
| 47 | 11% | 19% | |
| 48 | 5% | 8% | |
| 49 | 2% | 3% | |
| 50 | 0.5% | 0.7% | Last Result |
| 51 | 0.2% | 0.2% | |
| 52 | 0% | 0% |
Les Engagés – Parti Socialiste – Ecolo
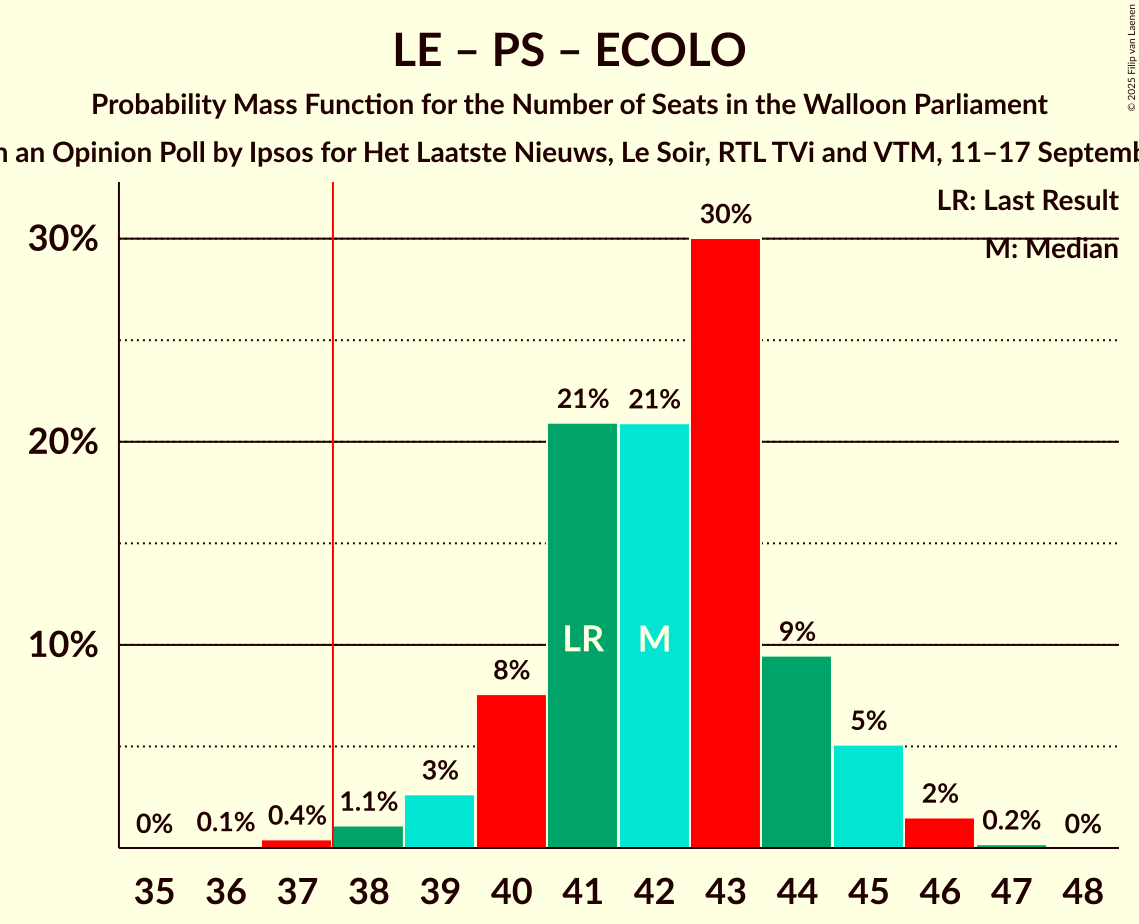
| Number of Seats | Probability | Accumulated | Special Marks |
|---|---|---|---|
| 36 | 0.1% | 100% | |
| 37 | 0.4% | 99.9% | |
| 38 | 1.1% | 99.5% | Majority |
| 39 | 3% | 98% | |
| 40 | 8% | 96% | |
| 41 | 21% | 88% | Last Result |
| 42 | 21% | 67% | Median |
| 43 | 30% | 46% | |
| 44 | 9% | 16% | |
| 45 | 5% | 7% | |
| 46 | 2% | 2% | |
| 47 | 0.2% | 0.2% | |
| 48 | 0% | 0% |
Mouvement Réformateur – Les Engagés
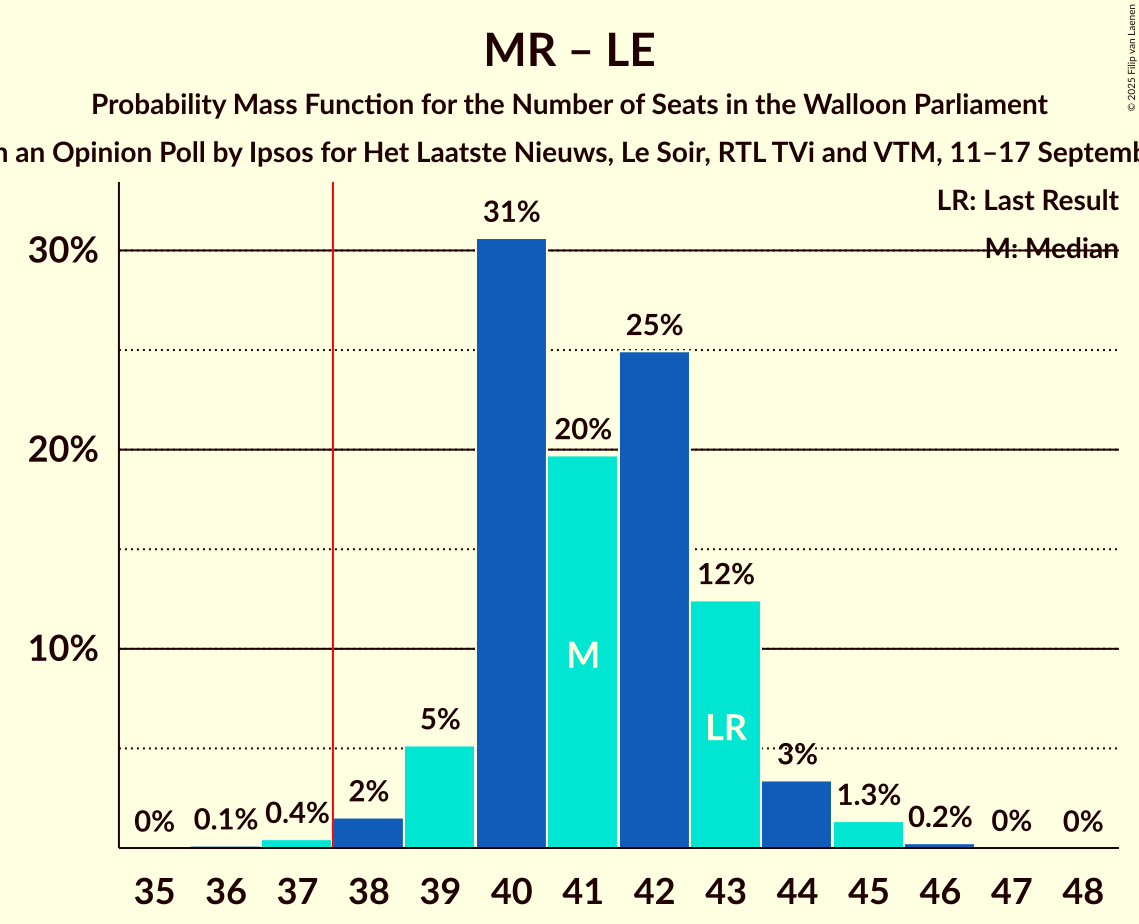
| Number of Seats | Probability | Accumulated | Special Marks |
|---|---|---|---|
| 36 | 0.1% | 100% | |
| 37 | 0.4% | 99.9% | |
| 38 | 2% | 99.4% | Majority |
| 39 | 5% | 98% | |
| 40 | 31% | 93% | |
| 41 | 20% | 62% | Median |
| 42 | 25% | 42% | |
| 43 | 12% | 17% | Last Result |
| 44 | 3% | 5% | |
| 45 | 1.3% | 2% | |
| 46 | 0.2% | 0.3% | |
| 47 | 0% | 0.1% | |
| 48 | 0% | 0% |
Mouvement Réformateur – Parti Socialiste
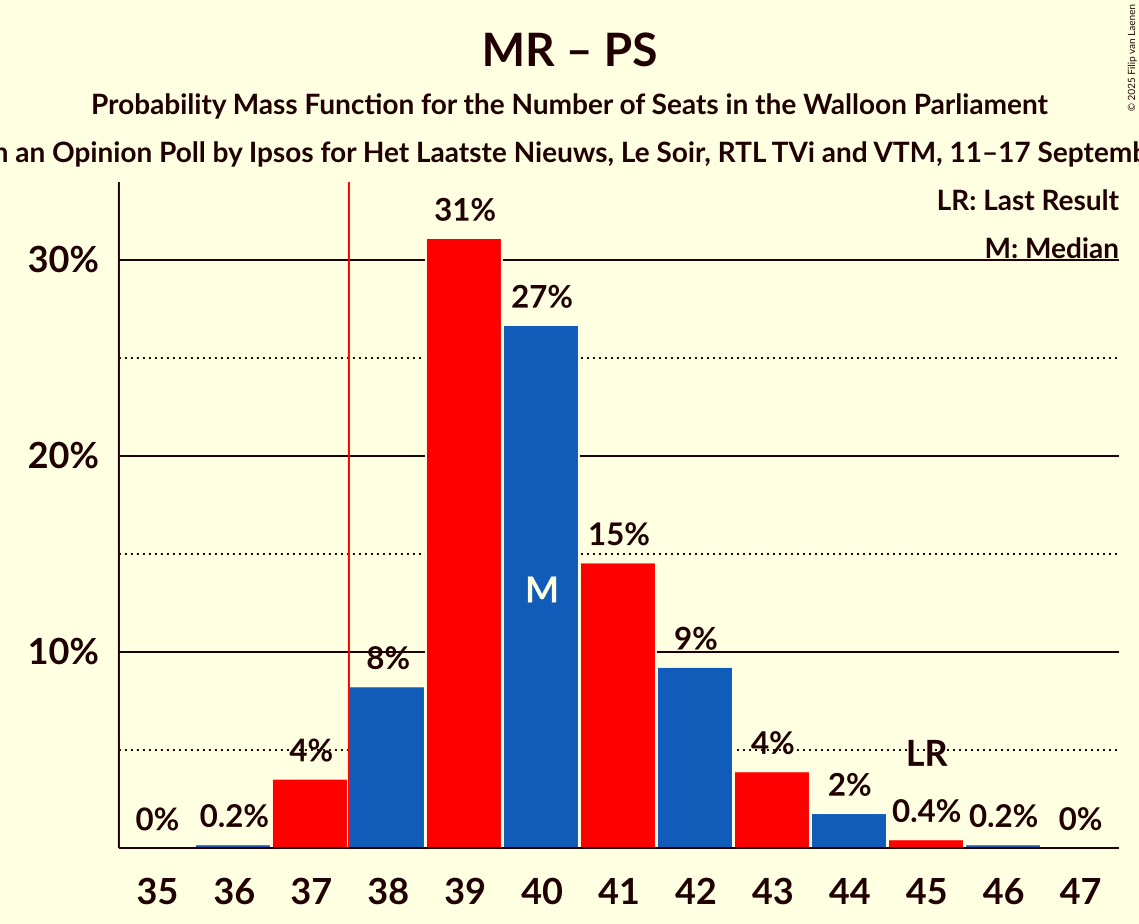
| Number of Seats | Probability | Accumulated | Special Marks |
|---|---|---|---|
| 36 | 0.2% | 100% | |
| 37 | 4% | 99.8% | |
| 38 | 8% | 96% | Majority |
| 39 | 31% | 88% | |
| 40 | 27% | 57% | Median |
| 41 | 15% | 30% | |
| 42 | 9% | 16% | |
| 43 | 4% | 6% | |
| 44 | 2% | 2% | |
| 45 | 0.4% | 0.7% | Last Result |
| 46 | 0.2% | 0.2% | |
| 47 | 0% | 0% |
Les Engagés – Parti Socialiste
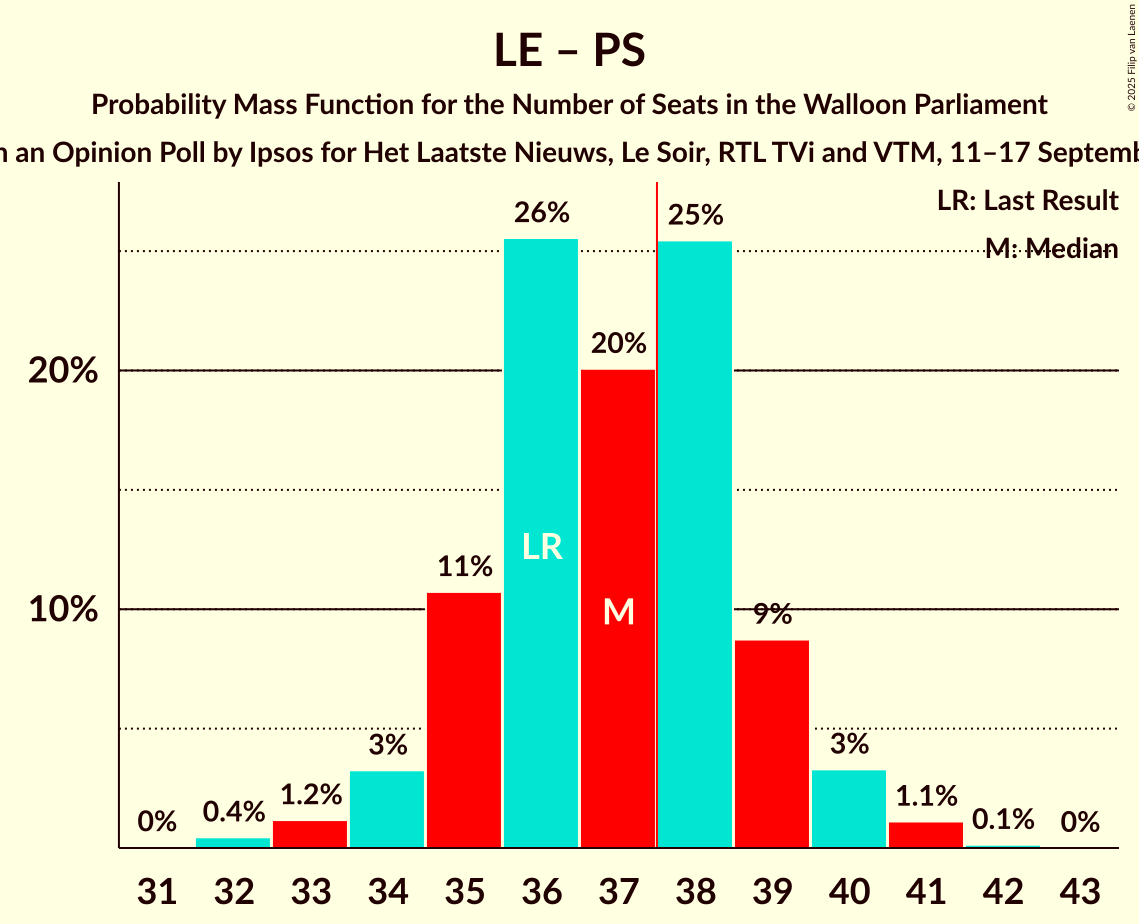
| Number of Seats | Probability | Accumulated | Special Marks |
|---|---|---|---|
| 32 | 0.4% | 100% | |
| 33 | 1.2% | 99.5% | |
| 34 | 3% | 98% | |
| 35 | 11% | 95% | |
| 36 | 26% | 84% | Last Result |
| 37 | 20% | 59% | Median |
| 38 | 25% | 39% | Majority |
| 39 | 9% | 13% | |
| 40 | 3% | 5% | |
| 41 | 1.1% | 1.3% | |
| 42 | 0.1% | 0.2% | |
| 43 | 0% | 0% |
Parti Socialiste – Parti du Travail de Belgique – Ecolo
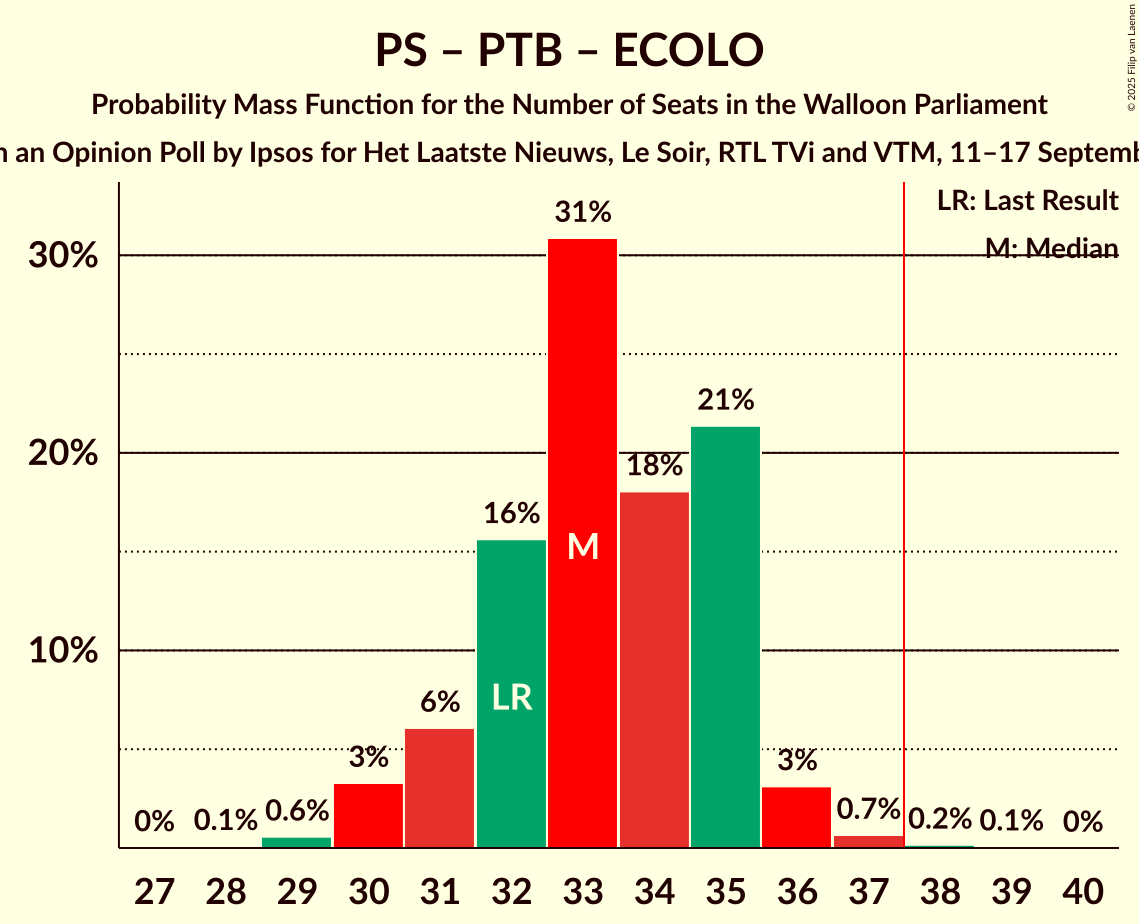
| Number of Seats | Probability | Accumulated | Special Marks |
|---|---|---|---|
| 28 | 0.1% | 100% | |
| 29 | 0.6% | 99.9% | |
| 30 | 3% | 99.3% | |
| 31 | 6% | 96% | |
| 32 | 16% | 90% | Last Result |
| 33 | 31% | 74% | |
| 34 | 18% | 43% | Median |
| 35 | 21% | 25% | |
| 36 | 3% | 4% | |
| 37 | 0.7% | 0.9% | |
| 38 | 0.2% | 0.2% | Majority |
| 39 | 0.1% | 0.1% | |
| 40 | 0% | 0% |
Mouvement Réformateur – Ecolo
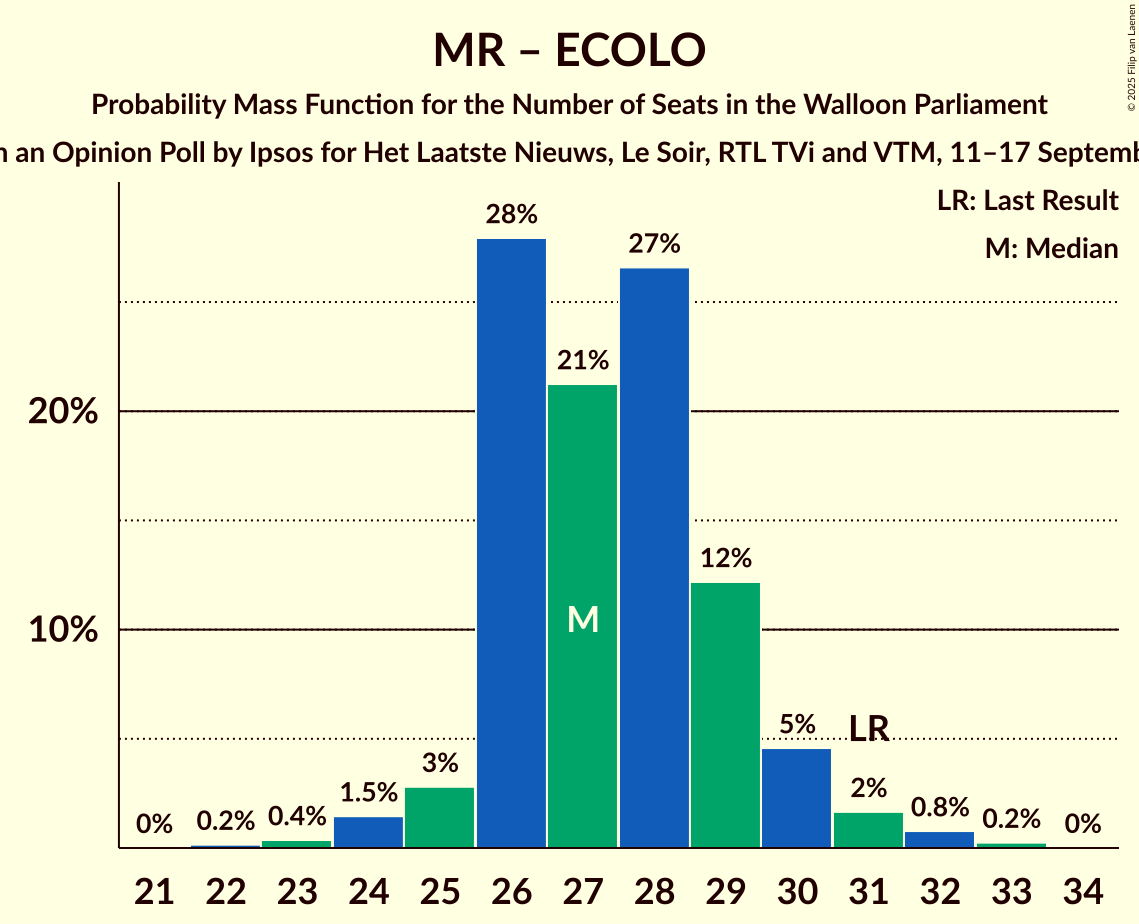
| Number of Seats | Probability | Accumulated | Special Marks |
|---|---|---|---|
| 22 | 0.2% | 100% | |
| 23 | 0.4% | 99.8% | |
| 24 | 1.5% | 99.5% | |
| 25 | 3% | 98% | |
| 26 | 28% | 95% | |
| 27 | 21% | 67% | Median |
| 28 | 27% | 46% | |
| 29 | 12% | 19% | |
| 30 | 5% | 7% | |
| 31 | 2% | 3% | Last Result |
| 32 | 0.8% | 1.0% | |
| 33 | 0.2% | 0.3% | |
| 34 | 0% | 0% |
Parti Socialiste – Parti du Travail de Belgique
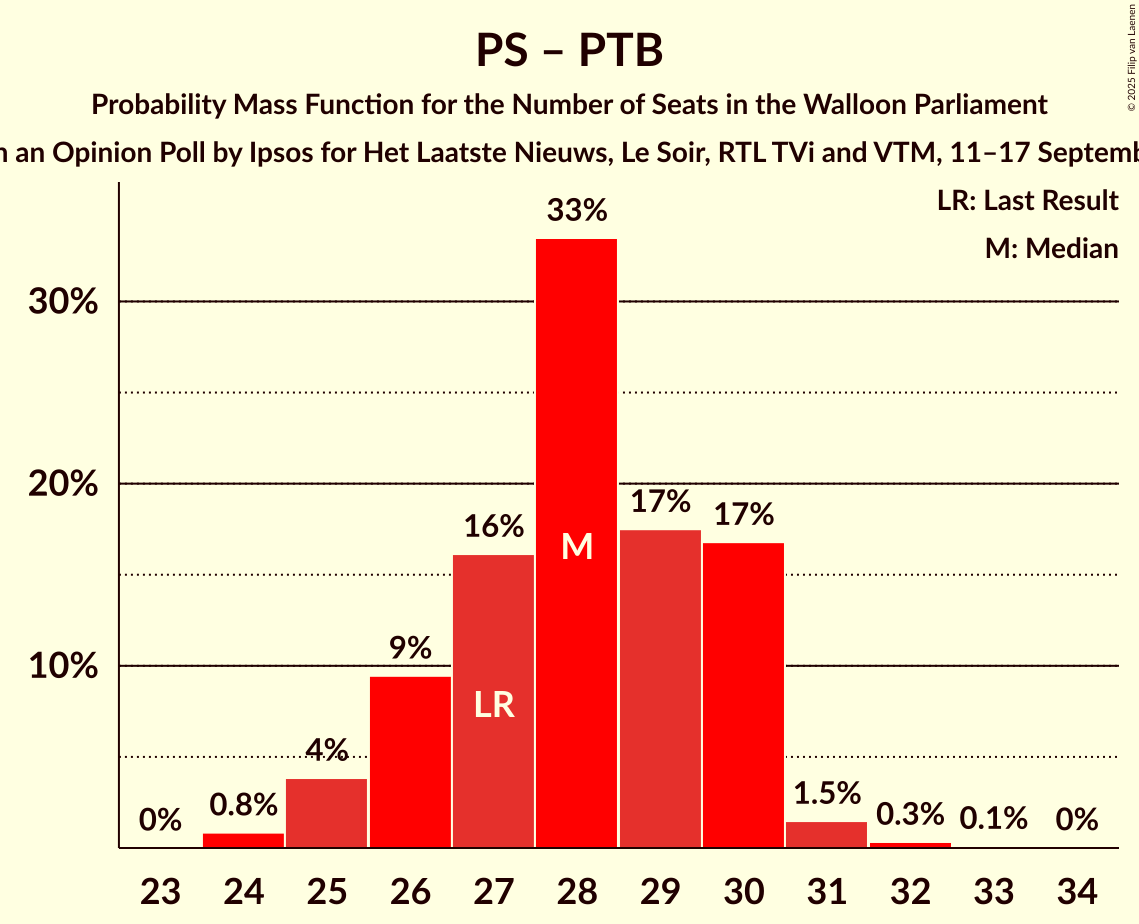
| Number of Seats | Probability | Accumulated | Special Marks |
|---|---|---|---|
| 24 | 0.8% | 100% | |
| 25 | 4% | 99.1% | |
| 26 | 9% | 95% | |
| 27 | 16% | 86% | Last Result |
| 28 | 33% | 70% | |
| 29 | 17% | 36% | Median |
| 30 | 17% | 19% | |
| 31 | 1.5% | 2% | |
| 32 | 0.3% | 0.5% | |
| 33 | 0.1% | 0.1% | |
| 34 | 0% | 0% |
Parti Socialiste – Ecolo
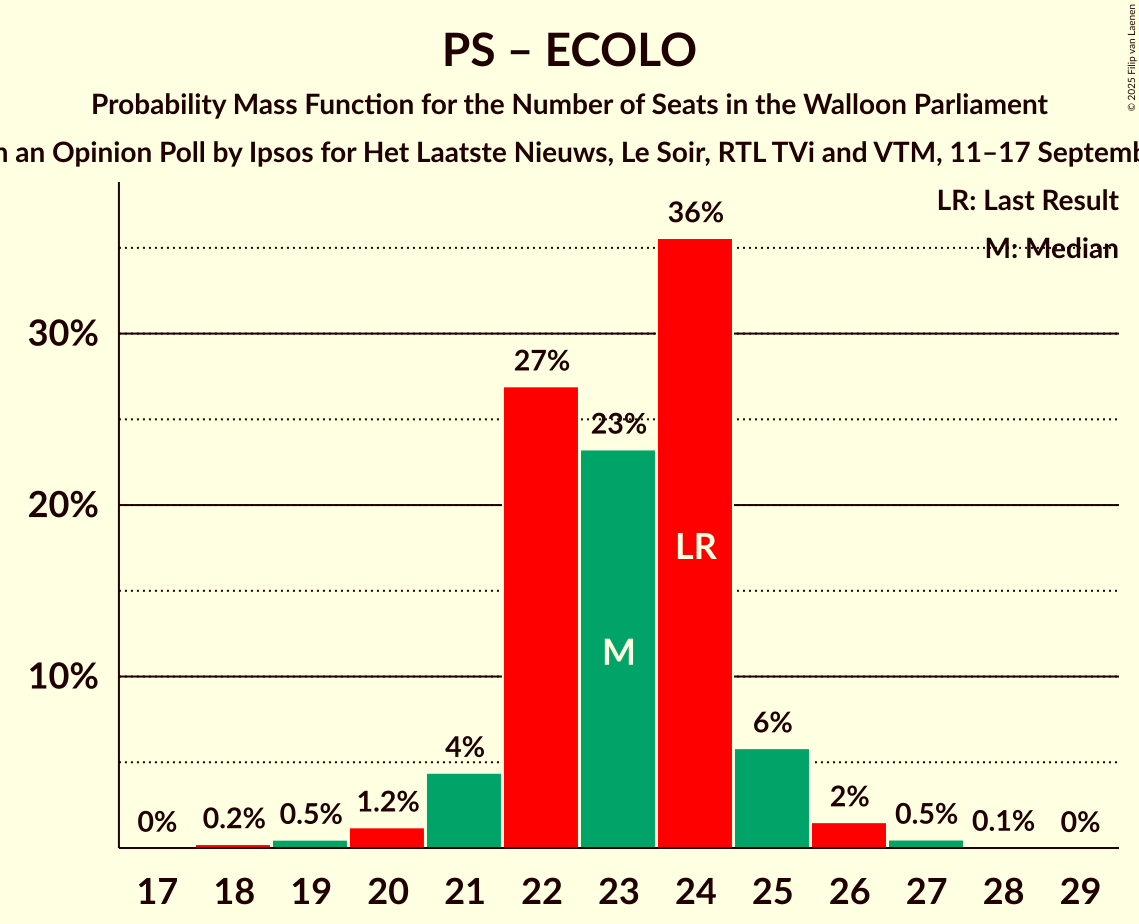
| Number of Seats | Probability | Accumulated | Special Marks |
|---|---|---|---|
| 18 | 0.2% | 100% | |
| 19 | 0.5% | 99.7% | |
| 20 | 1.2% | 99.3% | |
| 21 | 4% | 98% | |
| 22 | 27% | 94% | |
| 23 | 23% | 67% | Median |
| 24 | 36% | 43% | Last Result |
| 25 | 6% | 8% | |
| 26 | 2% | 2% | |
| 27 | 0.5% | 0.6% | |
| 28 | 0.1% | 0.1% | |
| 29 | 0% | 0% |
Parti du Travail de Belgique – Ecolo
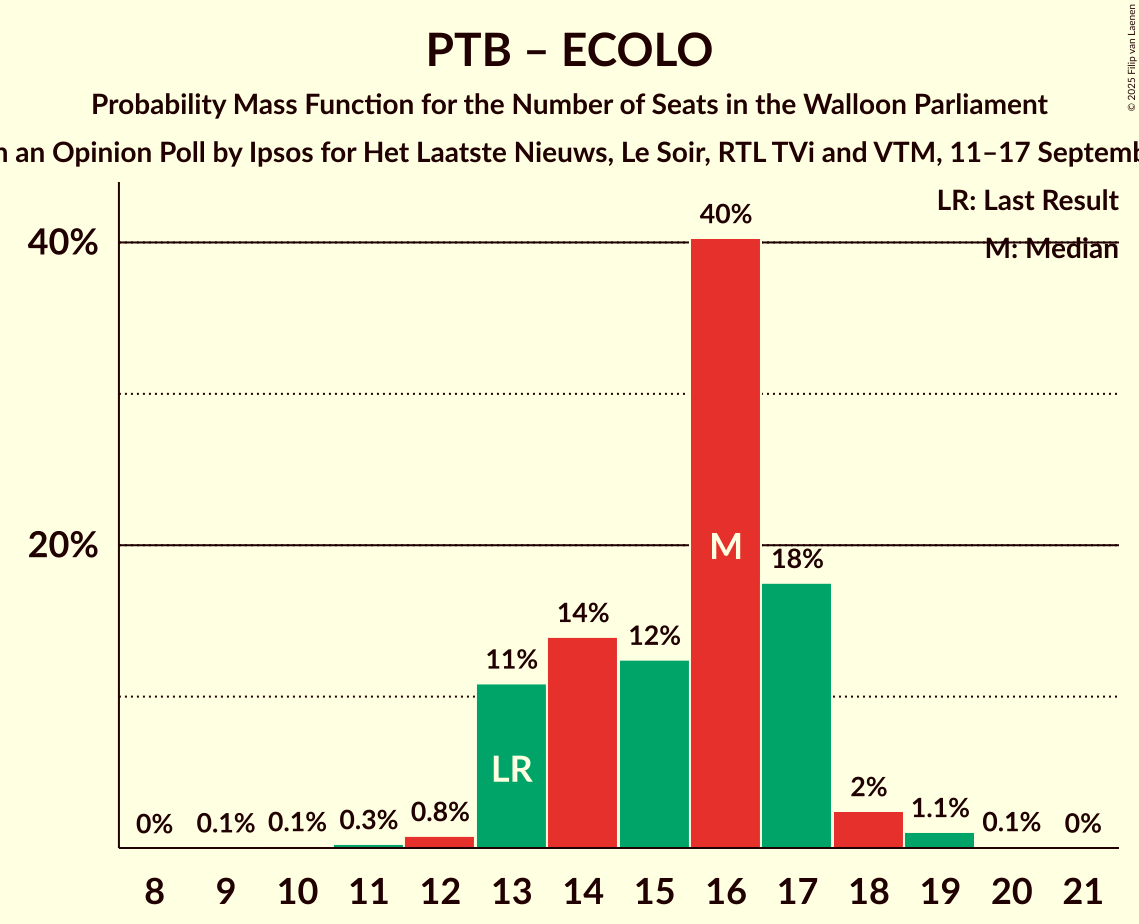
| Number of Seats | Probability | Accumulated | Special Marks |
|---|---|---|---|
| 9 | 0.1% | 100% | |
| 10 | 0.1% | 99.9% | |
| 11 | 0.3% | 99.8% | |
| 12 | 0.8% | 99.5% | |
| 13 | 11% | 98.7% | Last Result |
| 14 | 14% | 88% | |
| 15 | 12% | 74% | |
| 16 | 40% | 61% | Median |
| 17 | 18% | 21% | |
| 18 | 2% | 4% | |
| 19 | 1.1% | 1.2% | |
| 20 | 0.1% | 0.2% | |
| 21 | 0% | 0% |
Technical Information
Opinion Poll
- Polling firm: Ipsos
- Commissioner(s): Het Laatste Nieuws, Le Soir, RTL TVi and VTM
- Fieldwork period: 11–17 September 2024
Calculations
- Sample size: 1000
- Simulations done: 2,097,152
- Error estimate: 0.69%