Poll Average
Voting Intentions | Seats | Coalitions | Technical Information
Summary
The table below lists the polls on which the average is based. They are the most recent polls (less than 90 days old) registered and analyzed so far.
| Period | Polling firm/Commissioner(s) | MR | PS | LE | PTB | ECOLO | CN | DÉFI | CC | RMC |
|---|---|---|---|---|---|---|---|---|---|---|
| 9 June 2024 | General Election | 29.6% 26 |
23.2% 19 |
20.6% 17 |
12.1% 8 |
7.0% 5 |
2.8% 0 |
2.7% 0 |
1.6% 0 |
0.3% 0 |
| N/A | Poll Average | 19–24% 15–20 |
26–32% 21–27 |
15–20% 12–15 |
17–22% 14–17 |
6–9% 1–6 |
2–4% 0–2 |
2–4% 0 |
N/A N/A |
N/A N/A |
| 1–9 December 2025 | Ipsos Het Laatste Nieuws, Le Soir, RTL TVi and VTM |
19–24% 15–20 |
26–32% 21–27 |
15–20% 12–15 |
17–22% 14–17 |
6–9% 1–6 |
2–4% 0–2 |
2–4% 0 |
N/A N/A |
N/A N/A |
| 9 June 2024 | General Election | 29.6% 26 |
23.2% 19 |
20.6% 17 |
12.1% 8 |
7.0% 5 |
2.8% 0 |
2.7% 0 |
1.6% 0 |
0.3% 0 |
Only polls for which at least the sample size has been published are included in the table above.
Legend:
- Top half of each row: Voting intentions (95% confidence interval)
- Bottom half of each row: Seat projections for the Walloon Parliament (95% confidence interval)
- MR: Mouvement Réformateur
- PS: Parti Socialiste
- LE: Les Engagés
- PTB: Parti du Travail de Belgique
- ECOLO: Ecolo
- CN: Chez Nous
- DÉFI: DéFI
- CC: Collectif Citoyen
- RMC: Reprise en Main Citoyenne
- N/A (single party): Party not included the published results
- N/A (entire row): Calculation for this opinion poll not started yet
Voting Intentions

Confidence Intervals
| Party | Last Result | Median | 80% Confidence Interval | 90% Confidence Interval | 95% Confidence Interval | 99% Confidence Interval |
|---|---|---|---|---|---|---|
| Mouvement Réformateur | 29.6% | 21.4% | 19.7–23.1% | 19.3–23.6% | 18.9–24.0% | 18.2–24.8% |
| Parti Socialiste | 23.2% | 29.0% | 27.2–30.9% | 26.7–31.4% | 26.3–31.9% | 25.4–32.8% |
| Les Engagés | 20.6% | 17.3% | 15.8–18.9% | 15.4–19.3% | 15.0–19.7% | 14.4–20.5% |
| Parti du Travail de Belgique | 12.1% | 19.6% | 18.0–21.2% | 17.6–21.7% | 17.2–22.1% | 16.5–22.9% |
| Ecolo | 7.0% | 7.4% | 6.4–8.5% | 6.1–8.9% | 5.9–9.2% | 5.5–9.7% |
| Chez Nous | 2.8% | 2.9% | 2.2–3.6% | 2.1–3.8% | 1.9–4.0% | 1.7–4.4% |
| DéFI | 2.7% | 2.8% | 2.1–3.5% | 2.0–3.7% | 1.9–3.9% | 1.6–4.3% |
| Collectif Citoyen | 1.6% | N/A | N/A | N/A | N/A | N/A |
| Reprise en Main Citoyenne | 0.3% | N/A | N/A | N/A | N/A | N/A |
Mouvement Réformateur
For a full overview of the results for this party, see the Mouvement Réformateur page.
| Voting Intentions | Probability | Accumulated | Special Marks |
|---|---|---|---|
| 15.5–16.5% | 0% | 100% | |
| 16.5–17.5% | 0.1% | 100% | |
| 17.5–18.5% | 1.1% | 99.9% | |
| 18.5–19.5% | 6% | 98.8% | |
| 19.5–20.5% | 18% | 92% | |
| 20.5–21.5% | 30% | 74% | Median |
| 21.5–22.5% | 26% | 45% | |
| 22.5–23.5% | 13% | 18% | |
| 23.5–24.5% | 4% | 5% | |
| 24.5–25.5% | 0.8% | 0.9% | |
| 25.5–26.5% | 0.1% | 0.1% | |
| 26.5–27.5% | 0% | 0% | |
| 27.5–28.5% | 0% | 0% | |
| 28.5–29.5% | 0% | 0% | |
| 29.5–30.5% | 0% | 0% | Last Result |
Parti Socialiste
For a full overview of the results for this party, see the Parti Socialiste page.
| Voting Intentions | Probability | Accumulated | Special Marks |
|---|---|---|---|
| 22.5–23.5% | 0% | 100% | Last Result |
| 23.5–24.5% | 0.1% | 100% | |
| 24.5–25.5% | 0.6% | 99.9% | |
| 25.5–26.5% | 3% | 99.4% | |
| 26.5–27.5% | 11% | 96% | |
| 27.5–28.5% | 22% | 85% | |
| 28.5–29.5% | 27% | 64% | Median |
| 29.5–30.5% | 21% | 36% | |
| 30.5–31.5% | 11% | 15% | |
| 31.5–32.5% | 3% | 4% | |
| 32.5–33.5% | 0.7% | 0.8% | |
| 33.5–34.5% | 0.1% | 0.1% | |
| 34.5–35.5% | 0% | 0% |
Les Engagés
For a full overview of the results for this party, see the Les Engagés page.
| Voting Intentions | Probability | Accumulated | Special Marks |
|---|---|---|---|
| 12.5–13.5% | 0% | 100% | |
| 13.5–14.5% | 0.8% | 100% | |
| 14.5–15.5% | 6% | 99.2% | |
| 15.5–16.5% | 20% | 93% | |
| 16.5–17.5% | 32% | 73% | Median |
| 17.5–18.5% | 27% | 42% | |
| 18.5–19.5% | 12% | 15% | |
| 19.5–20.5% | 3% | 3% | |
| 20.5–21.5% | 0.4% | 0.5% | Last Result |
| 21.5–22.5% | 0% | 0% |
Parti du Travail de Belgique
For a full overview of the results for this party, see the Parti du Travail de Belgique page.
| Voting Intentions | Probability | Accumulated | Special Marks |
|---|---|---|---|
| 11.5–12.5% | 0% | 100% | Last Result |
| 12.5–13.5% | 0% | 100% | |
| 13.5–14.5% | 0% | 100% | |
| 14.5–15.5% | 0% | 100% | |
| 15.5–16.5% | 0.5% | 100% | |
| 16.5–17.5% | 4% | 99.4% | |
| 17.5–18.5% | 15% | 95% | |
| 18.5–19.5% | 29% | 80% | |
| 19.5–20.5% | 29% | 51% | Median |
| 20.5–21.5% | 16% | 22% | |
| 21.5–22.5% | 5% | 6% | |
| 22.5–23.5% | 1.0% | 1.1% | |
| 23.5–24.5% | 0.1% | 0.1% | |
| 24.5–25.5% | 0% | 0% |
Ecolo
For a full overview of the results for this party, see the Ecolo page.
| Voting Intentions | Probability | Accumulated | Special Marks |
|---|---|---|---|
| 3.5–4.5% | 0% | 100% | |
| 4.5–5.5% | 0.6% | 100% | |
| 5.5–6.5% | 13% | 99.4% | |
| 6.5–7.5% | 42% | 87% | Last Result, Median |
| 7.5–8.5% | 35% | 45% | |
| 8.5–9.5% | 9% | 10% | |
| 9.5–10.5% | 0.8% | 0.9% | |
| 10.5–11.5% | 0% | 0% |
Chez Nous
For a full overview of the results for this party, see the Chez Nous page.
| Voting Intentions | Probability | Accumulated | Special Marks |
|---|---|---|---|
| 0.5–1.5% | 0.1% | 100% | |
| 1.5–2.5% | 27% | 99.9% | |
| 2.5–3.5% | 62% | 73% | Last Result, Median |
| 3.5–4.5% | 11% | 11% | |
| 4.5–5.5% | 0.3% | 0.3% | |
| 5.5–6.5% | 0% | 0% |
DéFI
For a full overview of the results for this party, see the DéFI page.
| Voting Intentions | Probability | Accumulated | Special Marks |
|---|---|---|---|
| 0.0–0.5% | 0% | 100% | |
| 0.5–1.5% | 0.3% | 100% | |
| 1.5–2.5% | 34% | 99.7% | |
| 2.5–3.5% | 58% | 66% | Last Result, Median |
| 3.5–4.5% | 8% | 8% | |
| 4.5–5.5% | 0.2% | 0.2% | |
| 5.5–6.5% | 0% | 0% |
Seats
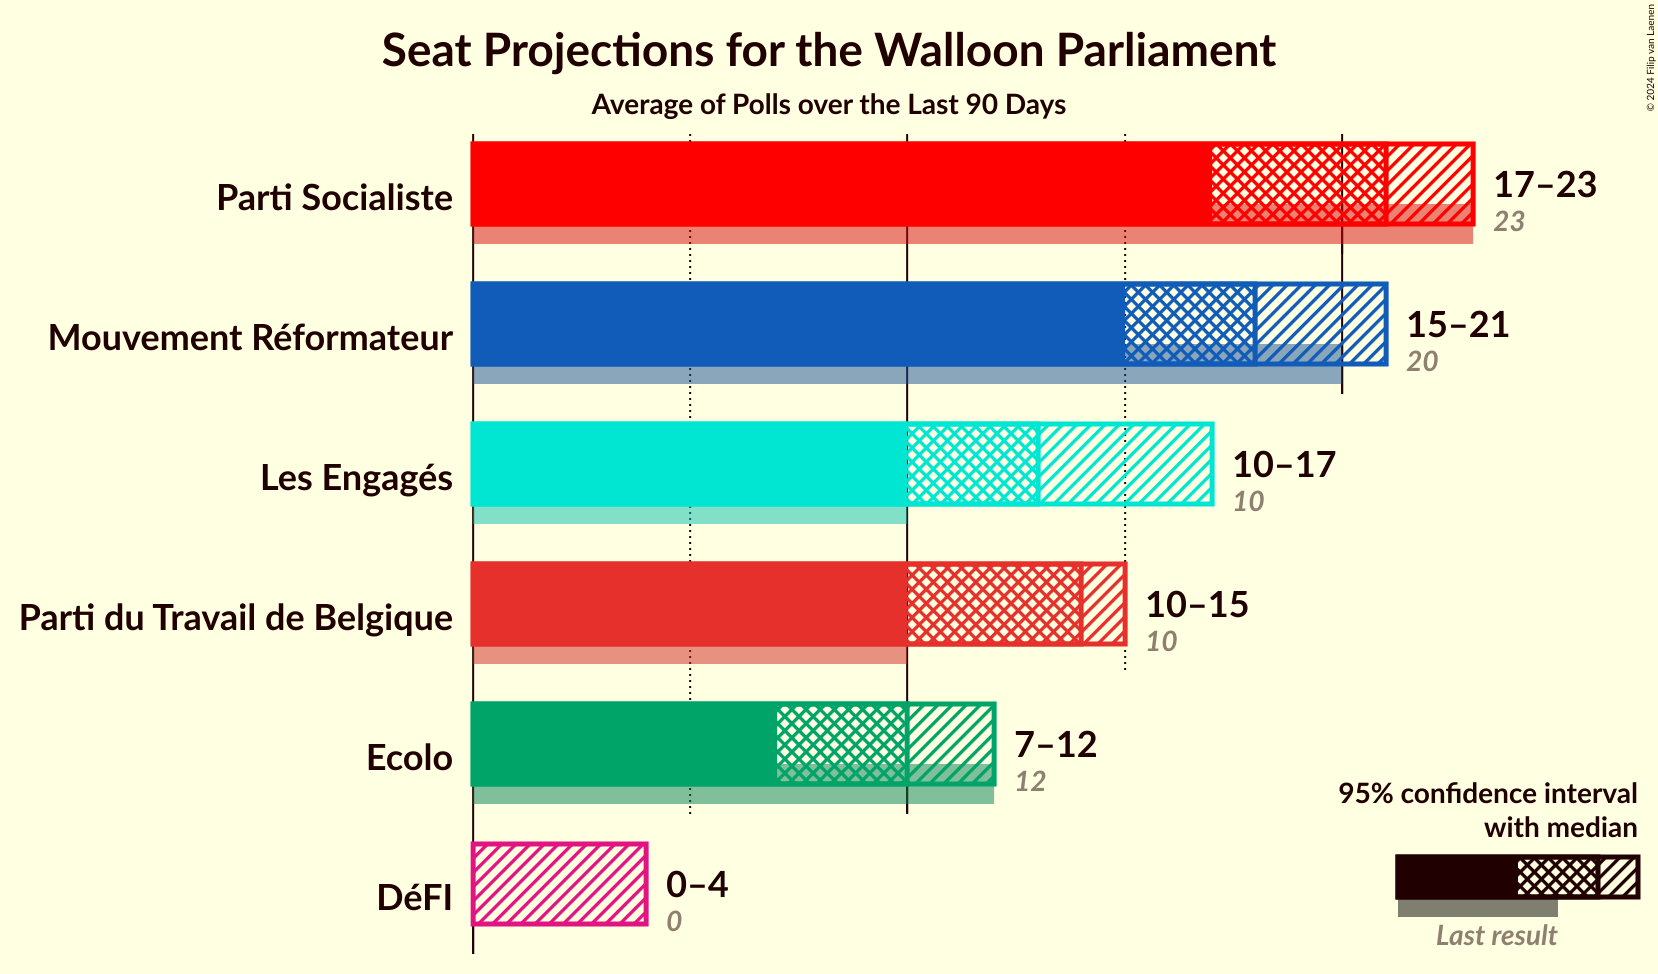
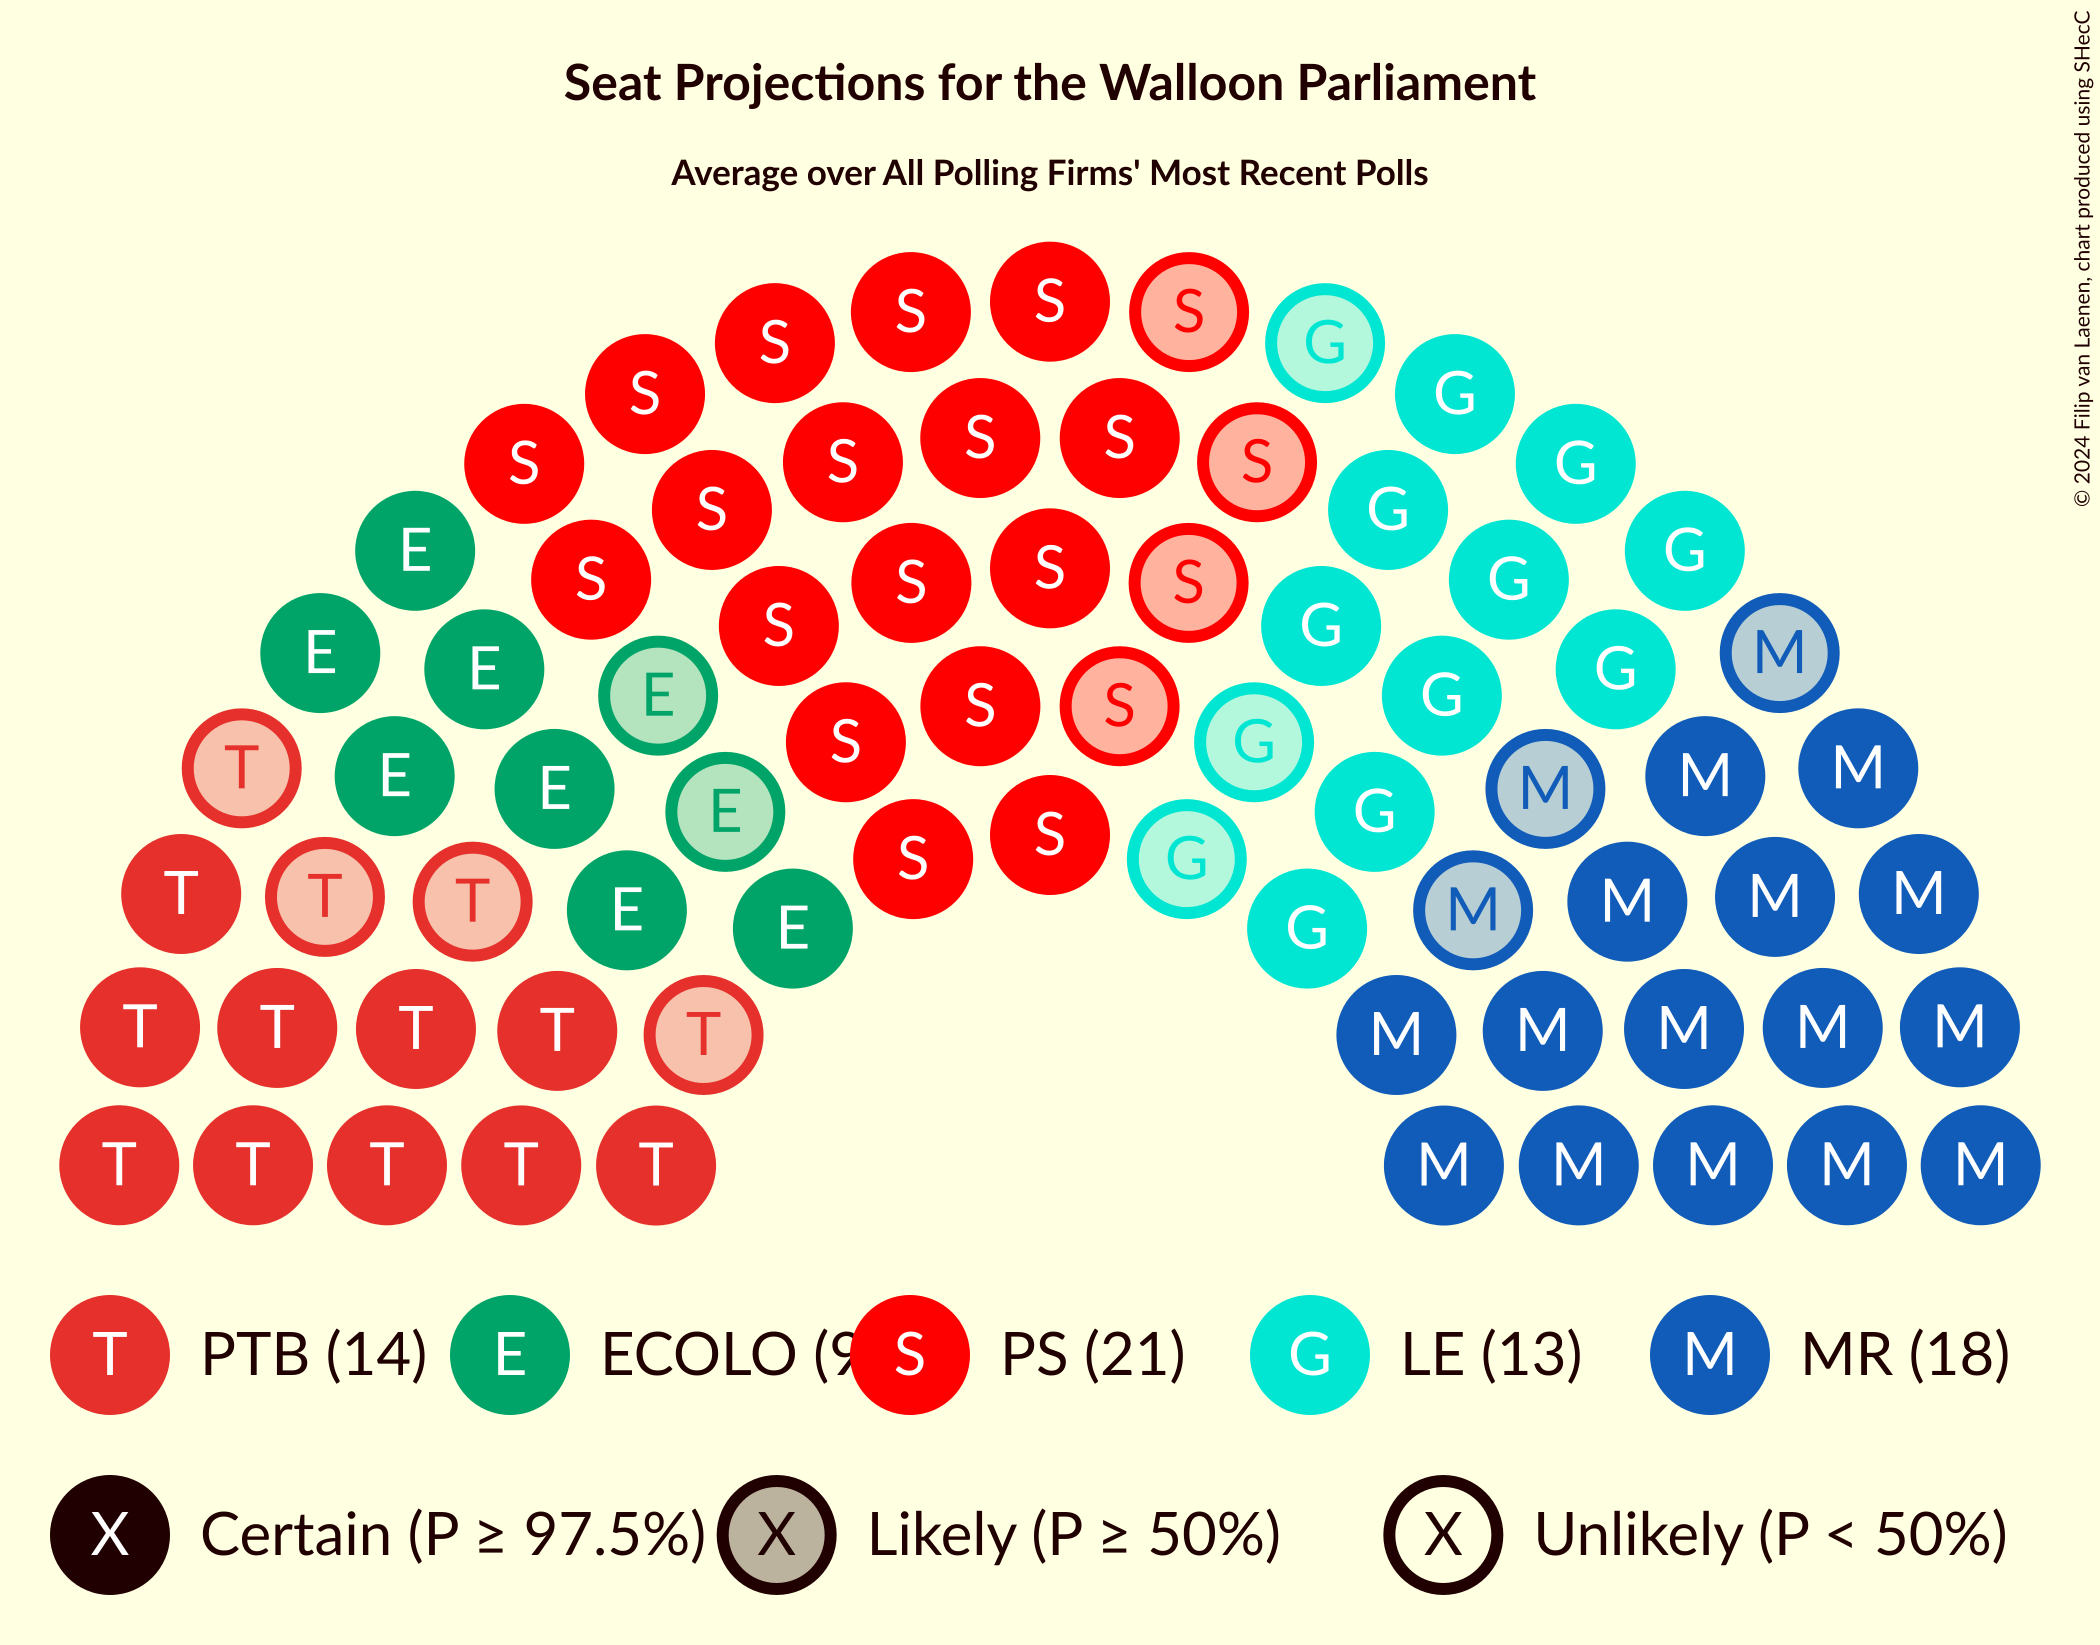
Confidence Intervals
| Party | Last Result | Median | 80% Confidence Interval | 90% Confidence Interval | 95% Confidence Interval | 99% Confidence Interval |
|---|---|---|---|---|---|---|
| Mouvement Réformateur | 26 | 17 | 16–19 | 15–20 | 15–20 | 14–20 |
| Parti Socialiste | 19 | 24 | 23–26 | 22–26 | 21–27 | 20–27 |
| Les Engagés | 17 | 14 | 13–15 | 12–15 | 12–15 | 11–16 |
| Parti du Travail de Belgique | 8 | 15 | 14–16 | 14–17 | 14–17 | 13–18 |
| Ecolo | 5 | 5 | 2–5 | 2–5 | 1–6 | 1–6 |
| Chez Nous | 0 | 0 | 0–2 | 0–2 | 0–2 | 0–2 |
| DéFI | 0 | 0 | 0 | 0 | 0 | 0 |
| Collectif Citoyen | 0 | N/A | N/A | N/A | N/A | N/A |
| Reprise en Main Citoyenne | 0 | N/A | N/A | N/A | N/A | N/A |
Mouvement Réformateur
For a full overview of the results for this party, see the Mouvement Réformateur page.
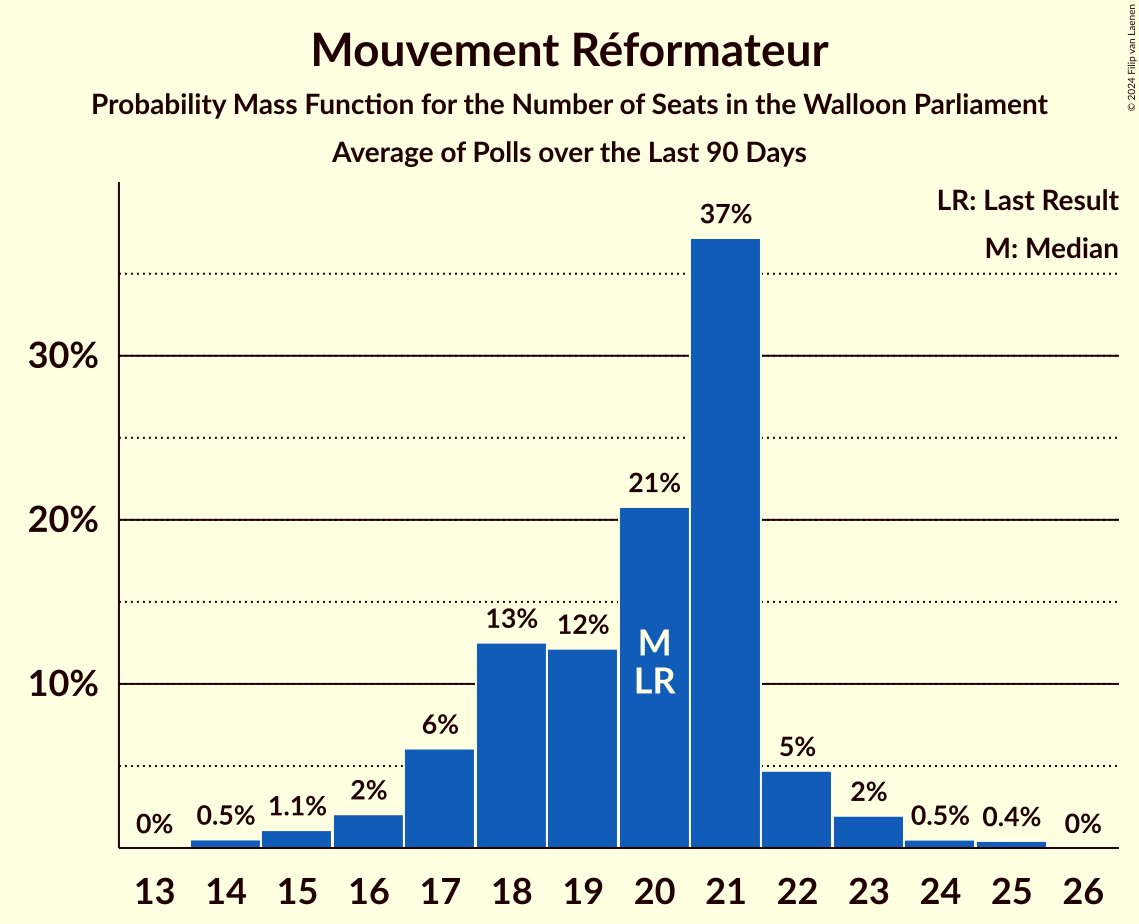
| Number of Seats | Probability | Accumulated | Special Marks |
|---|---|---|---|
| 13 | 0.1% | 100% | |
| 14 | 1.1% | 99.9% | |
| 15 | 4% | 98.8% | |
| 16 | 7% | 95% | |
| 17 | 47% | 88% | Median |
| 18 | 21% | 41% | |
| 19 | 12% | 20% | |
| 20 | 7% | 8% | |
| 21 | 0.2% | 0.3% | |
| 22 | 0% | 0% | |
| 23 | 0% | 0% | |
| 24 | 0% | 0% | |
| 25 | 0% | 0% | |
| 26 | 0% | 0% | Last Result |
Parti Socialiste
For a full overview of the results for this party, see the Parti Socialiste page.
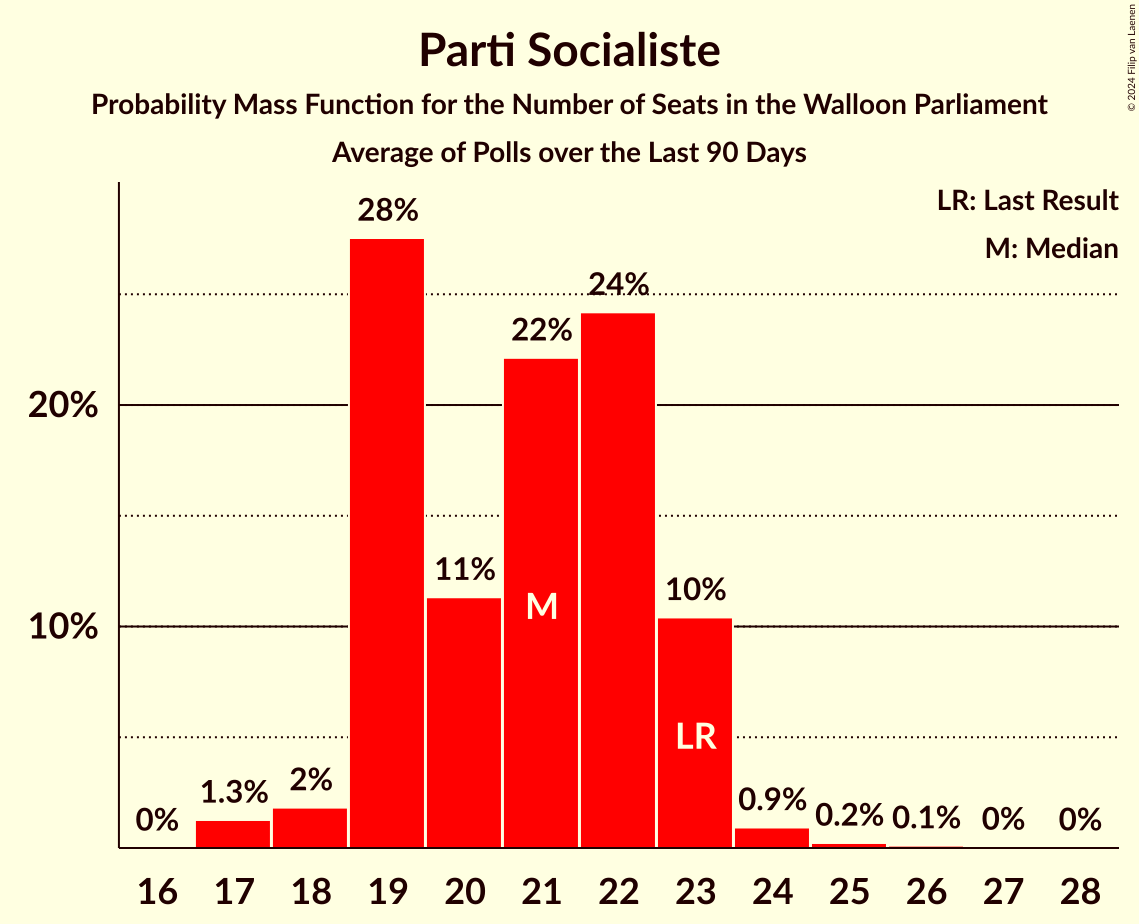
| Number of Seats | Probability | Accumulated | Special Marks |
|---|---|---|---|
| 19 | 0.1% | 100% | Last Result |
| 20 | 0.7% | 99.9% | |
| 21 | 2% | 99.2% | |
| 22 | 4% | 97% | |
| 23 | 42% | 94% | |
| 24 | 21% | 51% | Median |
| 25 | 17% | 31% | |
| 26 | 11% | 13% | |
| 27 | 2% | 3% | |
| 28 | 0.3% | 0.4% | |
| 29 | 0.1% | 0.1% | |
| 30 | 0% | 0% |
Les Engagés
For a full overview of the results for this party, see the Les Engagés page.
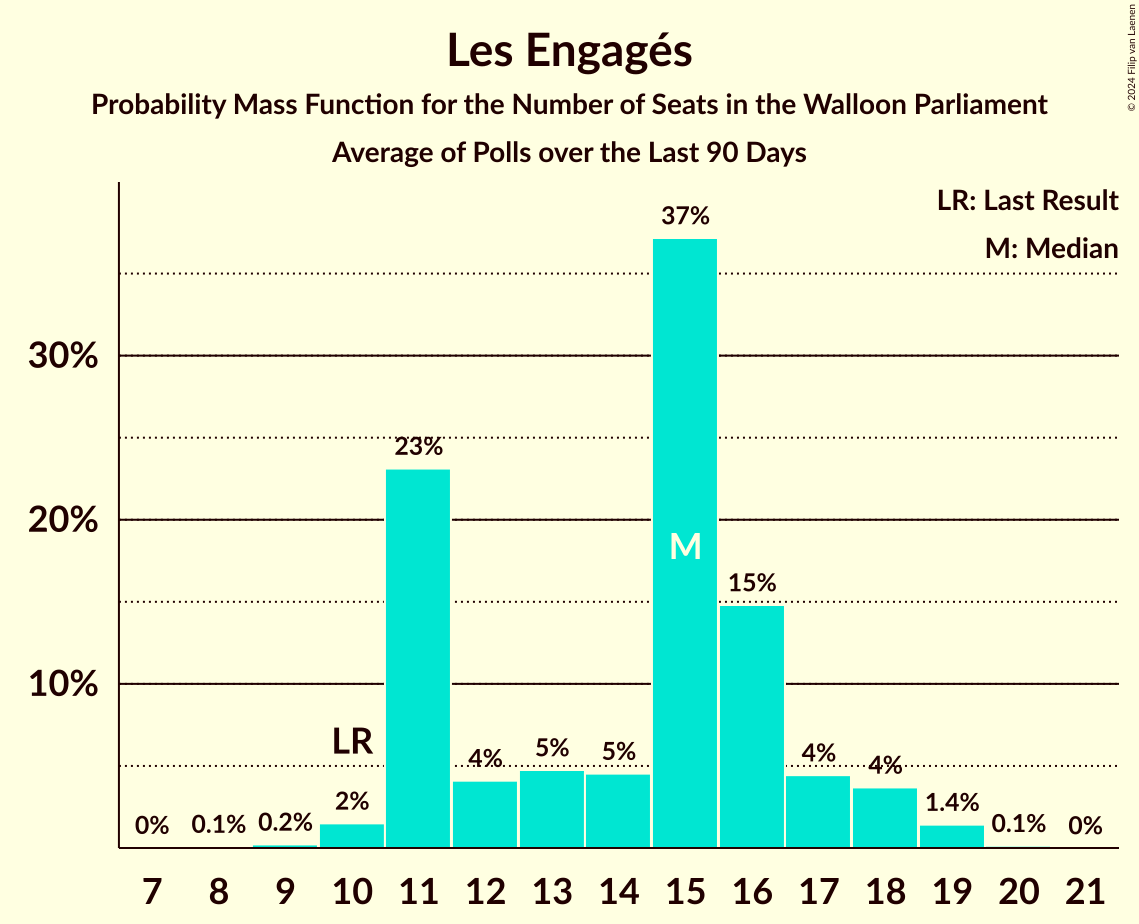
| Number of Seats | Probability | Accumulated | Special Marks |
|---|---|---|---|
| 11 | 1.0% | 100% | |
| 12 | 7% | 99.0% | |
| 13 | 24% | 92% | |
| 14 | 24% | 68% | Median |
| 15 | 43% | 43% | |
| 16 | 0.4% | 0.6% | |
| 17 | 0.1% | 0.2% | Last Result |
| 18 | 0% | 0.1% | |
| 19 | 0% | 0% |
Parti du Travail de Belgique
For a full overview of the results for this party, see the Parti du Travail de Belgique page.
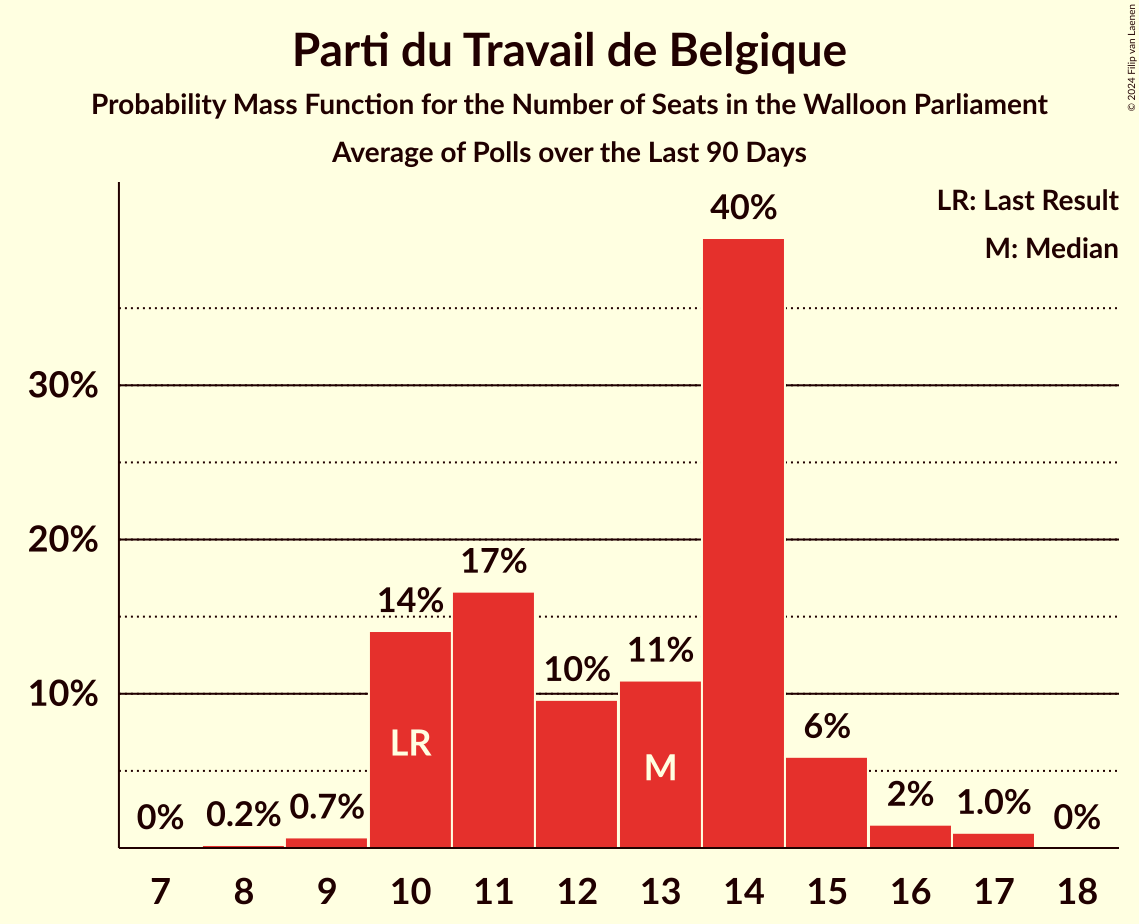
| Number of Seats | Probability | Accumulated | Special Marks |
|---|---|---|---|
| 8 | 0% | 100% | Last Result |
| 9 | 0% | 100% | |
| 10 | 0% | 100% | |
| 11 | 0% | 100% | |
| 12 | 0.2% | 100% | |
| 13 | 0.7% | 99.7% | |
| 14 | 32% | 99.1% | |
| 15 | 30% | 67% | Median |
| 16 | 31% | 38% | |
| 17 | 6% | 7% | |
| 18 | 0.9% | 1.3% | |
| 19 | 0.4% | 0.5% | |
| 20 | 0.1% | 0.1% | |
| 21 | 0% | 0% |
Ecolo
For a full overview of the results for this party, see the Ecolo page.
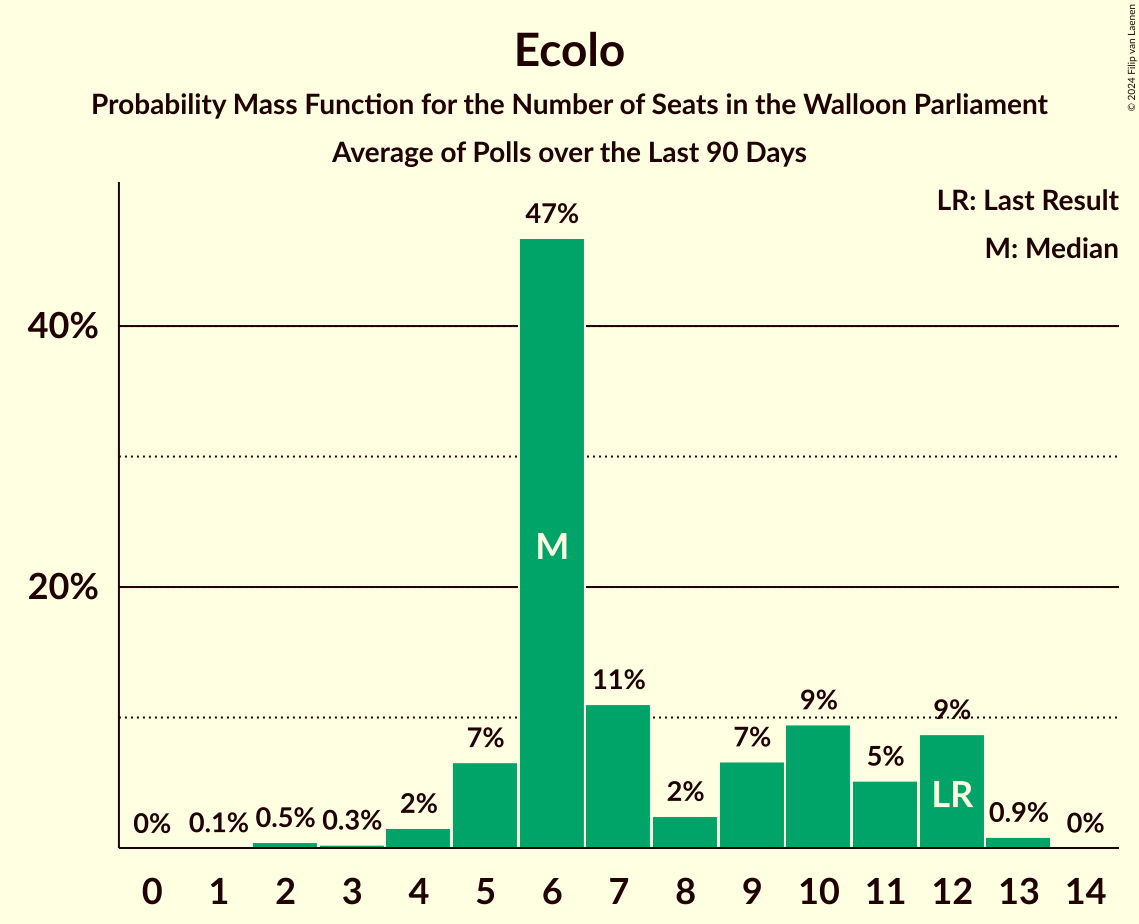
| Number of Seats | Probability | Accumulated | Special Marks |
|---|---|---|---|
| 1 | 4% | 100% | |
| 2 | 7% | 96% | |
| 3 | 18% | 89% | |
| 4 | 13% | 70% | |
| 5 | 55% | 57% | Last Result, Median |
| 6 | 2% | 3% | |
| 7 | 0.4% | 0.4% | |
| 8 | 0.1% | 0.1% | |
| 9 | 0% | 0% |
Chez Nous
For a full overview of the results for this party, see the Chez Nous page.
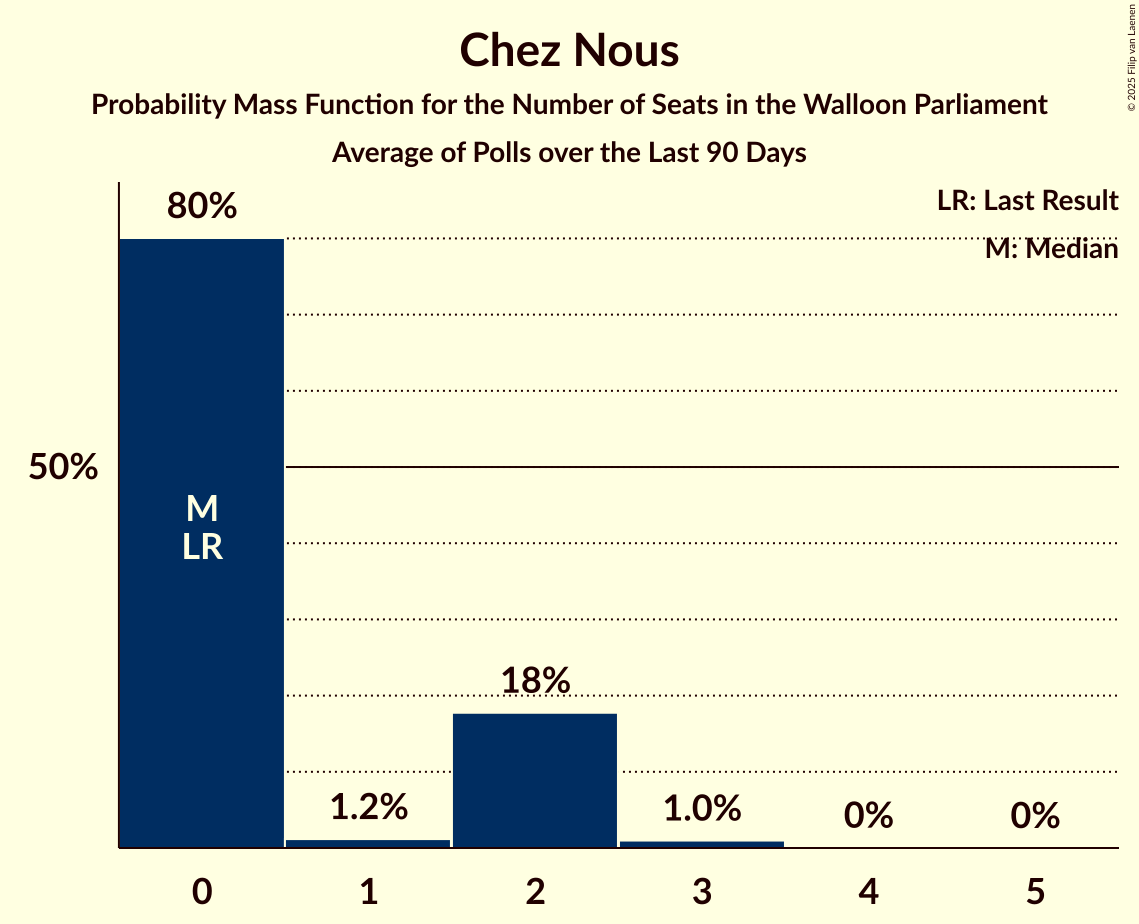
| Number of Seats | Probability | Accumulated | Special Marks |
|---|---|---|---|
| 0 | 84% | 100% | Last Result, Median |
| 1 | 2% | 16% | |
| 2 | 14% | 15% | |
| 3 | 0.5% | 0.5% | |
| 4 | 0% | 0% |
DéFI
For a full overview of the results for this party, see the DéFI page.
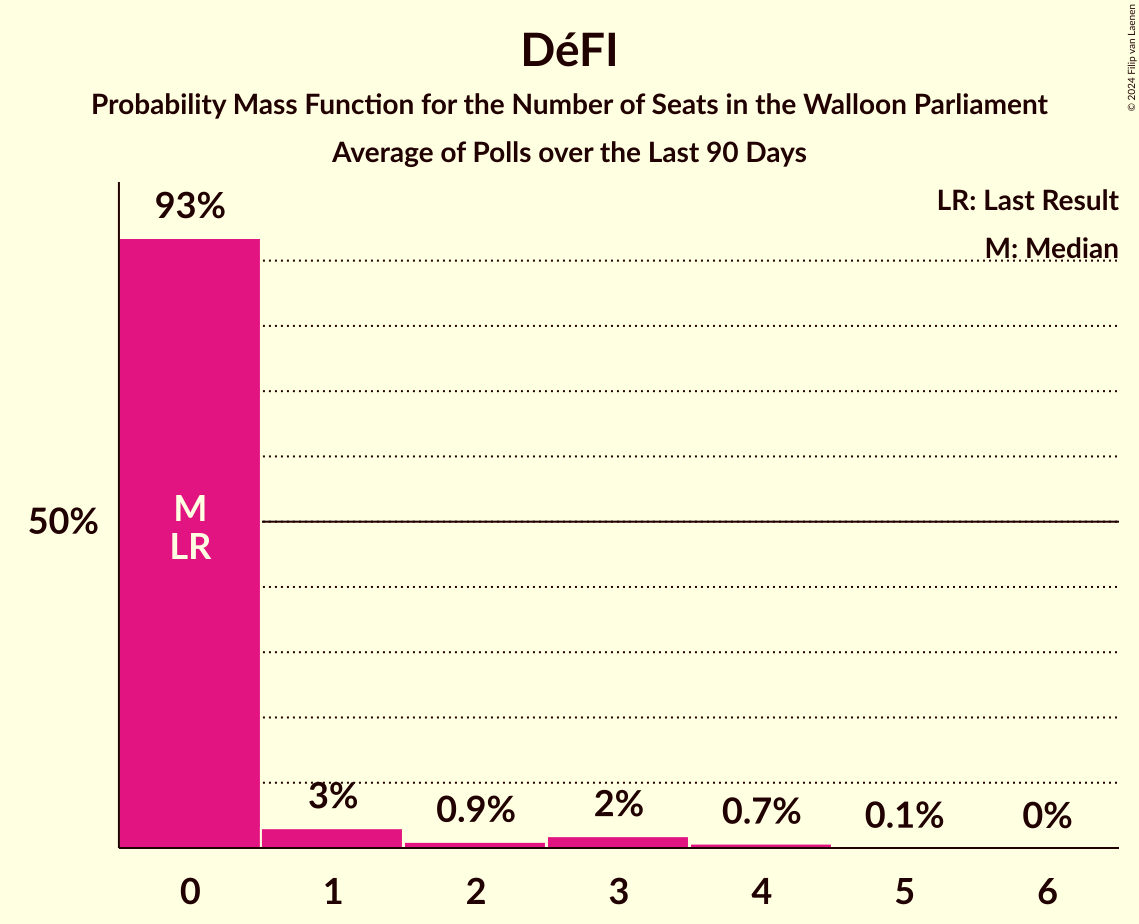
| Number of Seats | Probability | Accumulated | Special Marks |
|---|---|---|---|
| 0 | 100% | 100% | Last Result, Median |
Collectif Citoyen
For a full overview of the results for this party, see the Collectif Citoyen page.

Reprise en Main Citoyenne
For a full overview of the results for this party, see the Reprise en Main Citoyenne page.

Coalitions
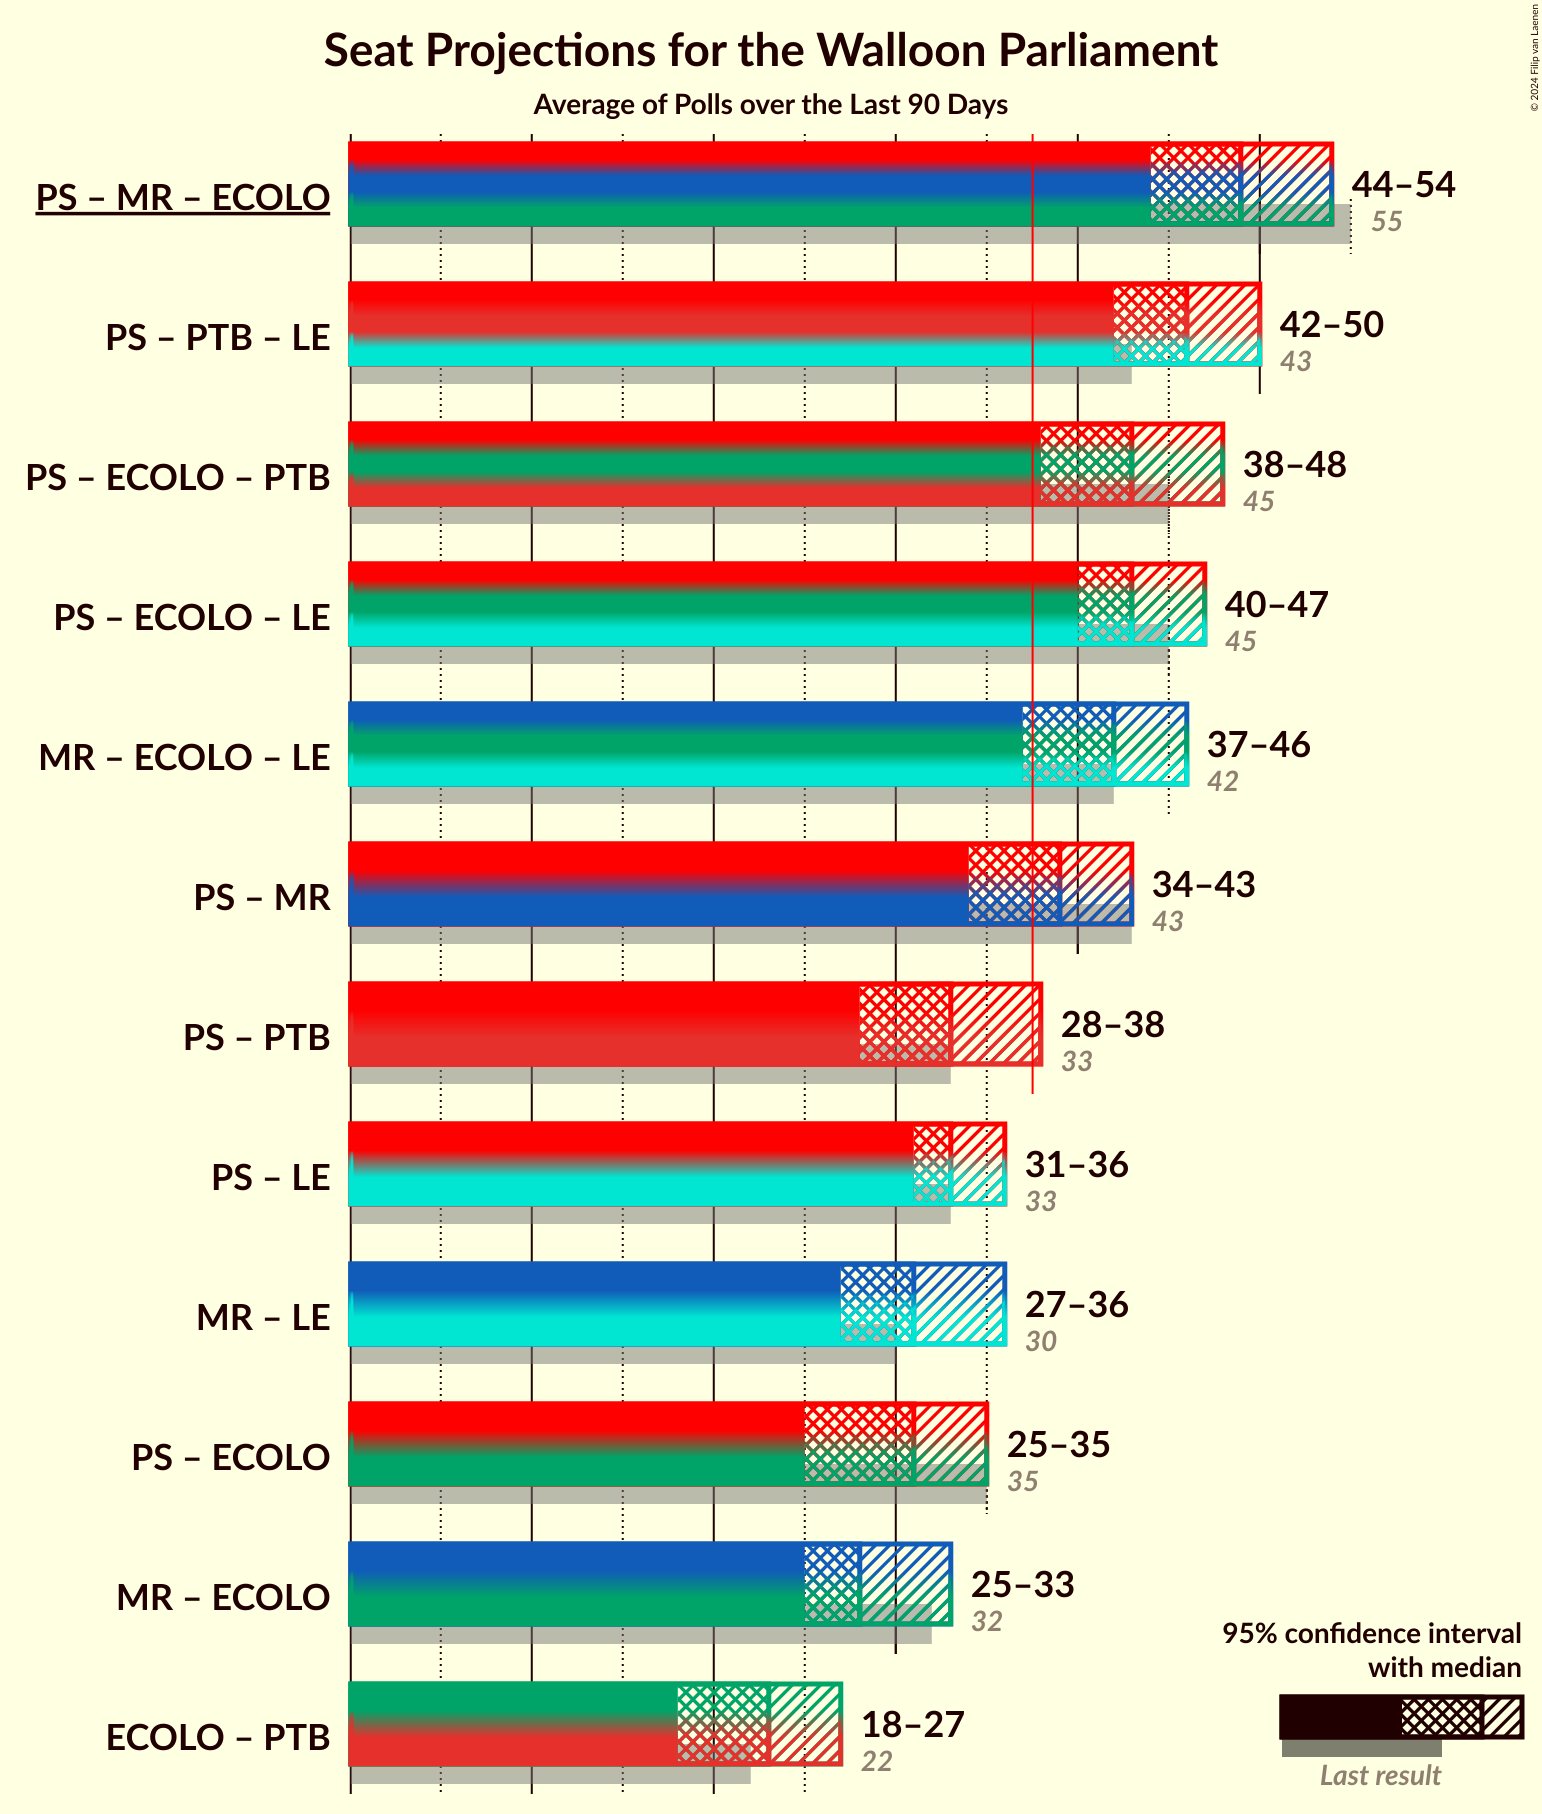
Confidence Intervals
| Coalition | Last Result | Median | Majority? | 80% Confidence Interval | 90% Confidence Interval | 95% Confidence Interval | 99% Confidence Interval |
|---|---|---|---|---|---|---|---|
| Parti Socialiste – Les Engagés – Parti du Travail de Belgique | 44 | 53 | 100% | 51–55 | 50–56 | 50–56 | 49–57 |
| Mouvement Réformateur – Parti Socialiste – Ecolo | 50 | 45 | 100% | 44–47 | 44–48 | 43–49 | 42–49 |
| Parti Socialiste – Parti du Travail de Belgique – Ecolo | 32 | 43 | 100% | 41–45 | 41–45 | 40–46 | 39–47 |
| Parti Socialiste – Les Engagés – Ecolo | 41 | 42 | 99.9% | 40–44 | 40–44 | 39–45 | 38–46 |
| Mouvement Réformateur – Parti Socialiste | 45 | 41 | 99.7% | 40–43 | 39–44 | 39–45 | 38–46 |
| Parti Socialiste – Parti du Travail de Belgique | 27 | 39 | 85% | 37–41 | 37–42 | 36–42 | 35–43 |
| Parti Socialiste – Les Engagés | 36 | 38 | 64% | 36–40 | 35–40 | 35–41 | 34–42 |
| Mouvement Réformateur – Les Engagés – Ecolo | 48 | 36 | 9% | 34–37 | 33–38 | 33–38 | 32–39 |
| Mouvement Réformateur – Les Engagés | 43 | 31 | 0% | 30–33 | 29–34 | 29–34 | 28–35 |
| Parti Socialiste – Ecolo | 24 | 28 | 0% | 26–30 | 25–31 | 25–31 | 24–32 |
| Mouvement Réformateur – Ecolo | 31 | 22 | 0% | 20–24 | 19–24 | 19–25 | 18–25 |
| Parti du Travail de Belgique – Ecolo | 13 | 19 | 0% | 17–21 | 17–21 | 16–22 | 15–23 |
Parti Socialiste – Les Engagés – Parti du Travail de Belgique
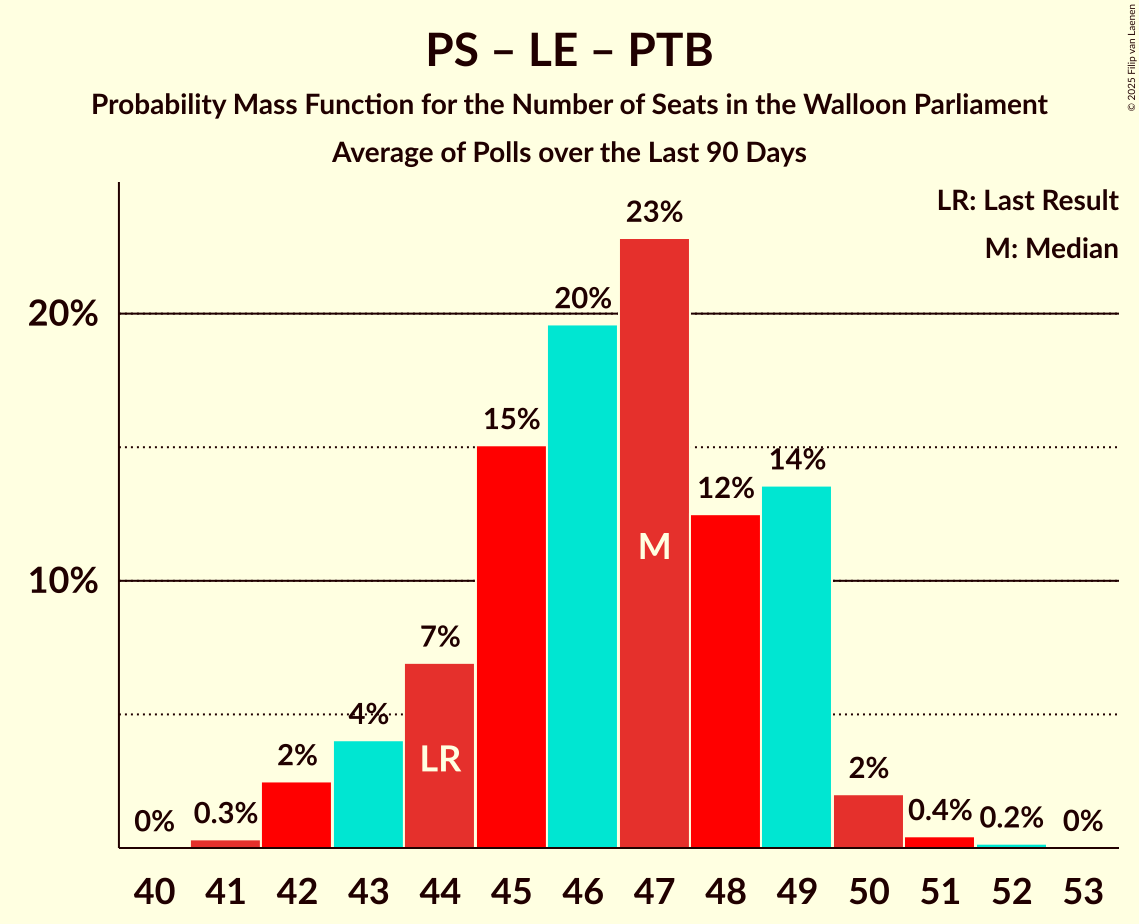
| Number of Seats | Probability | Accumulated | Special Marks |
|---|---|---|---|
| 44 | 0% | 100% | Last Result |
| 45 | 0% | 100% | |
| 46 | 0% | 100% | |
| 47 | 0% | 100% | |
| 48 | 0.1% | 100% | |
| 49 | 0.6% | 99.9% | |
| 50 | 4% | 99.2% | |
| 51 | 12% | 95% | |
| 52 | 12% | 82% | |
| 53 | 39% | 70% | Median |
| 54 | 14% | 31% | |
| 55 | 10% | 17% | |
| 56 | 5% | 7% | |
| 57 | 1.2% | 1.5% | |
| 58 | 0.2% | 0.3% | |
| 59 | 0% | 0% |
Mouvement Réformateur – Parti Socialiste – Ecolo
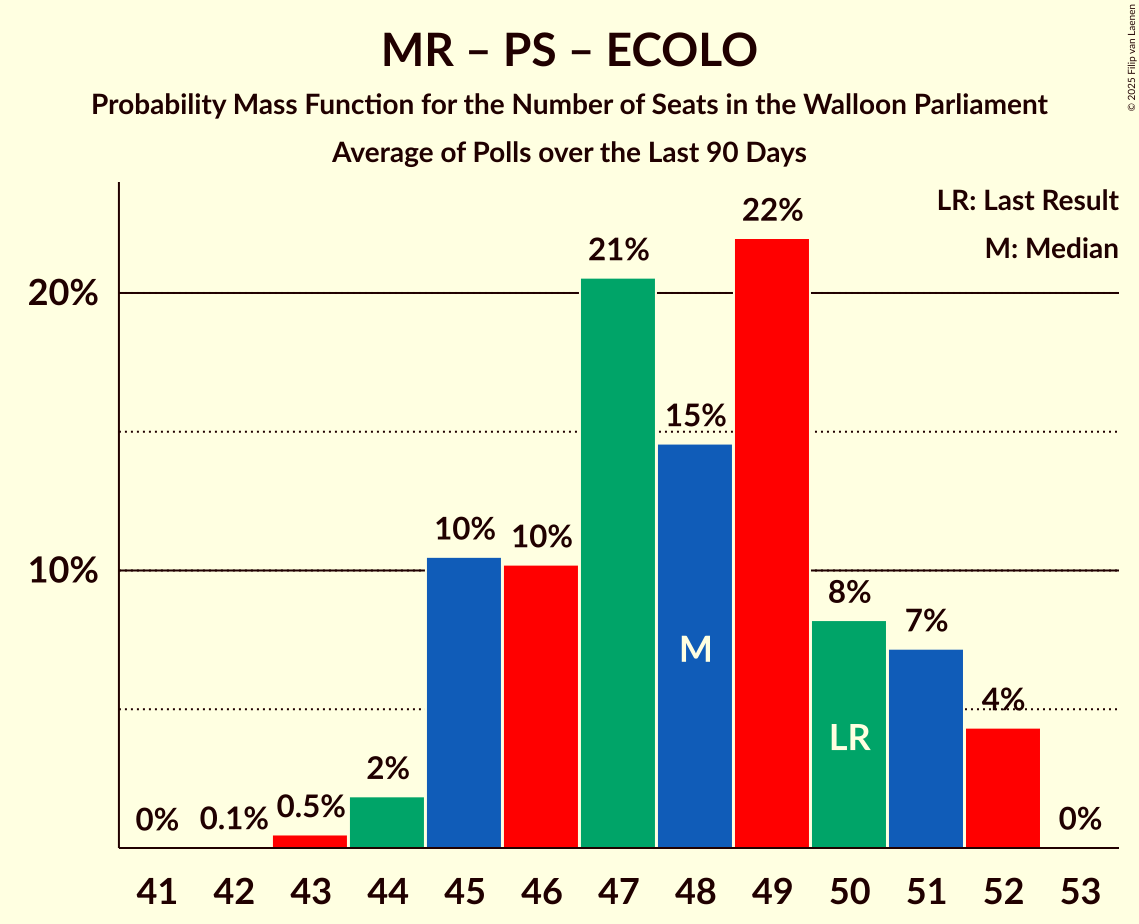
| Number of Seats | Probability | Accumulated | Special Marks |
|---|---|---|---|
| 40 | 0.1% | 100% | |
| 41 | 0.2% | 99.9% | |
| 42 | 0.9% | 99.7% | |
| 43 | 3% | 98.8% | |
| 44 | 17% | 95% | |
| 45 | 31% | 78% | |
| 46 | 25% | 47% | Median |
| 47 | 13% | 22% | |
| 48 | 5% | 9% | |
| 49 | 3% | 4% | |
| 50 | 0.4% | 0.4% | Last Result |
| 51 | 0% | 0% |
Parti Socialiste – Parti du Travail de Belgique – Ecolo
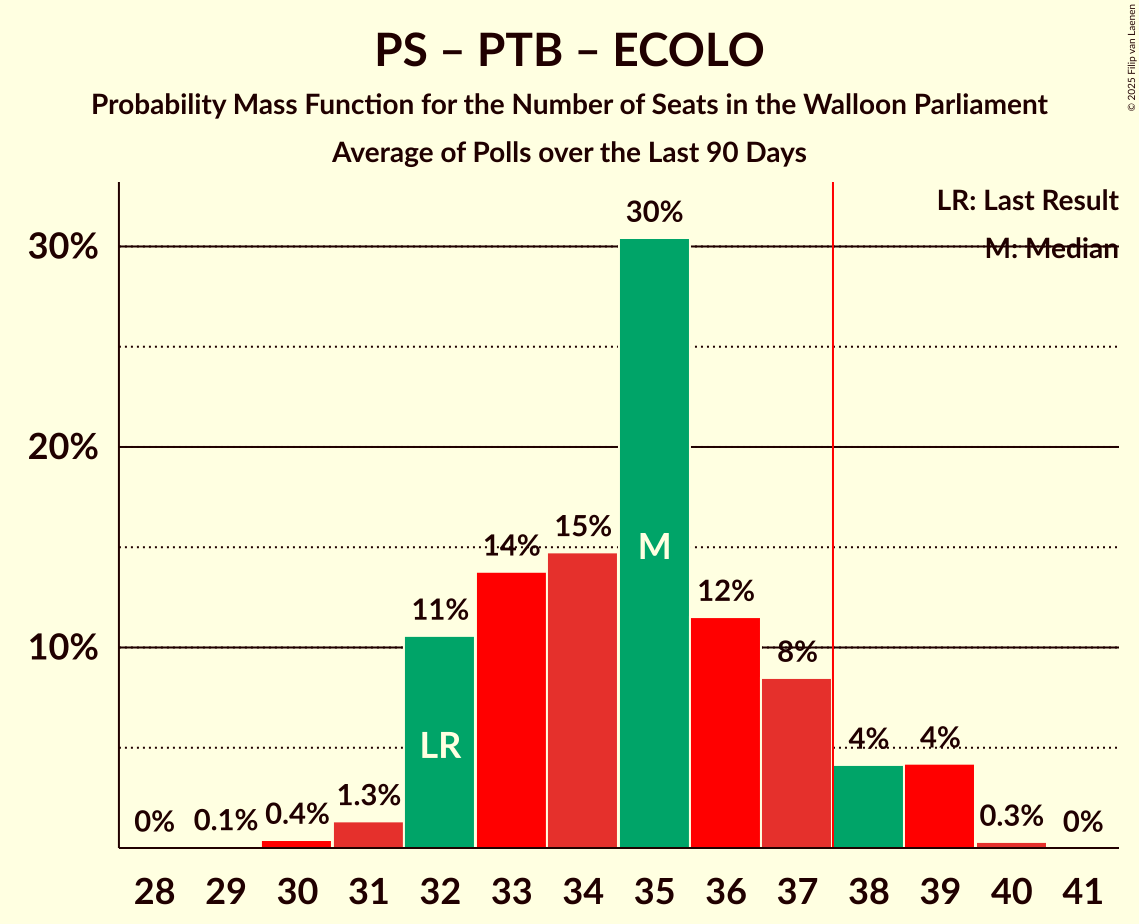
| Number of Seats | Probability | Accumulated | Special Marks |
|---|---|---|---|
| 32 | 0% | 100% | Last Result |
| 33 | 0% | 100% | |
| 34 | 0% | 100% | |
| 35 | 0% | 100% | |
| 36 | 0% | 100% | |
| 37 | 0% | 100% | |
| 38 | 0% | 100% | Majority |
| 39 | 0.5% | 99.9% | |
| 40 | 4% | 99.5% | |
| 41 | 9% | 96% | |
| 42 | 20% | 87% | |
| 43 | 25% | 67% | |
| 44 | 24% | 42% | Median |
| 45 | 13% | 18% | |
| 46 | 3% | 4% | |
| 47 | 1.2% | 1.4% | |
| 48 | 0.1% | 0.2% | |
| 49 | 0% | 0% |
Parti Socialiste – Les Engagés – Ecolo
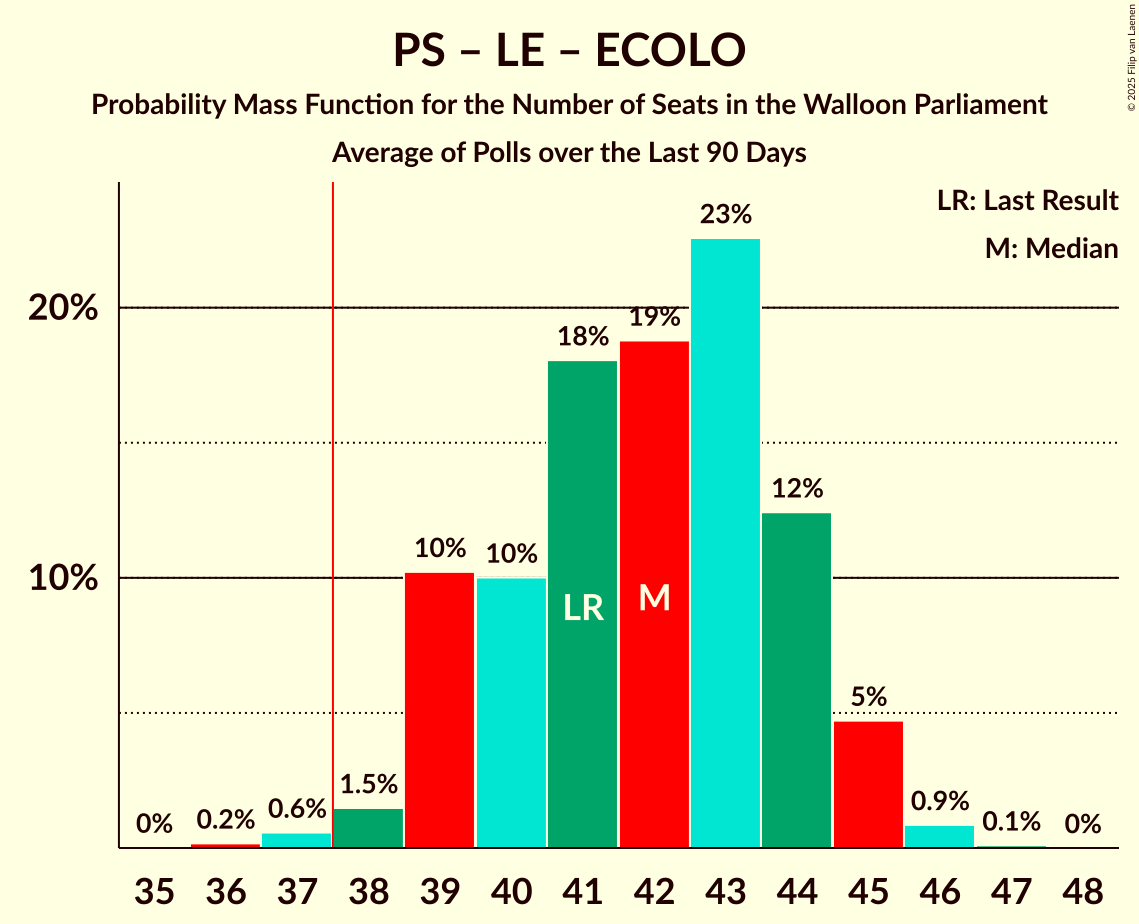
| Number of Seats | Probability | Accumulated | Special Marks |
|---|---|---|---|
| 37 | 0.1% | 100% | |
| 38 | 1.0% | 99.9% | Majority |
| 39 | 3% | 98.9% | |
| 40 | 11% | 96% | |
| 41 | 17% | 84% | Last Result |
| 42 | 27% | 68% | |
| 43 | 26% | 40% | Median |
| 44 | 10% | 14% | |
| 45 | 3% | 4% | |
| 46 | 1.2% | 1.3% | |
| 47 | 0.1% | 0.1% | |
| 48 | 0% | 0% |
Mouvement Réformateur – Parti Socialiste
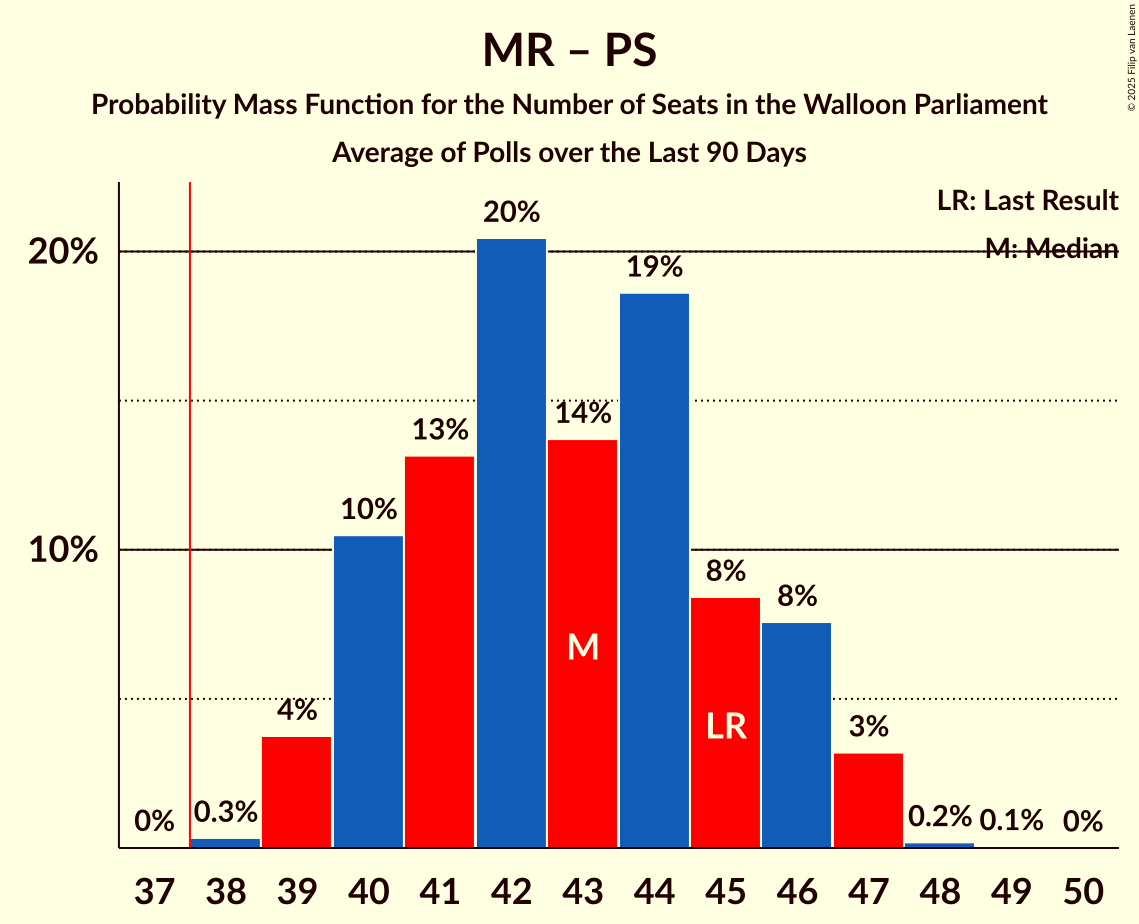
| Number of Seats | Probability | Accumulated | Special Marks |
|---|---|---|---|
| 36 | 0.1% | 100% | |
| 37 | 0.3% | 99.9% | |
| 38 | 1.2% | 99.7% | Majority |
| 39 | 5% | 98.5% | |
| 40 | 19% | 93% | |
| 41 | 35% | 74% | Median |
| 42 | 19% | 39% | |
| 43 | 11% | 21% | |
| 44 | 7% | 10% | |
| 45 | 2% | 3% | Last Result |
| 46 | 1.0% | 1.1% | |
| 47 | 0.1% | 0.1% | |
| 48 | 0% | 0% |
Parti Socialiste – Parti du Travail de Belgique
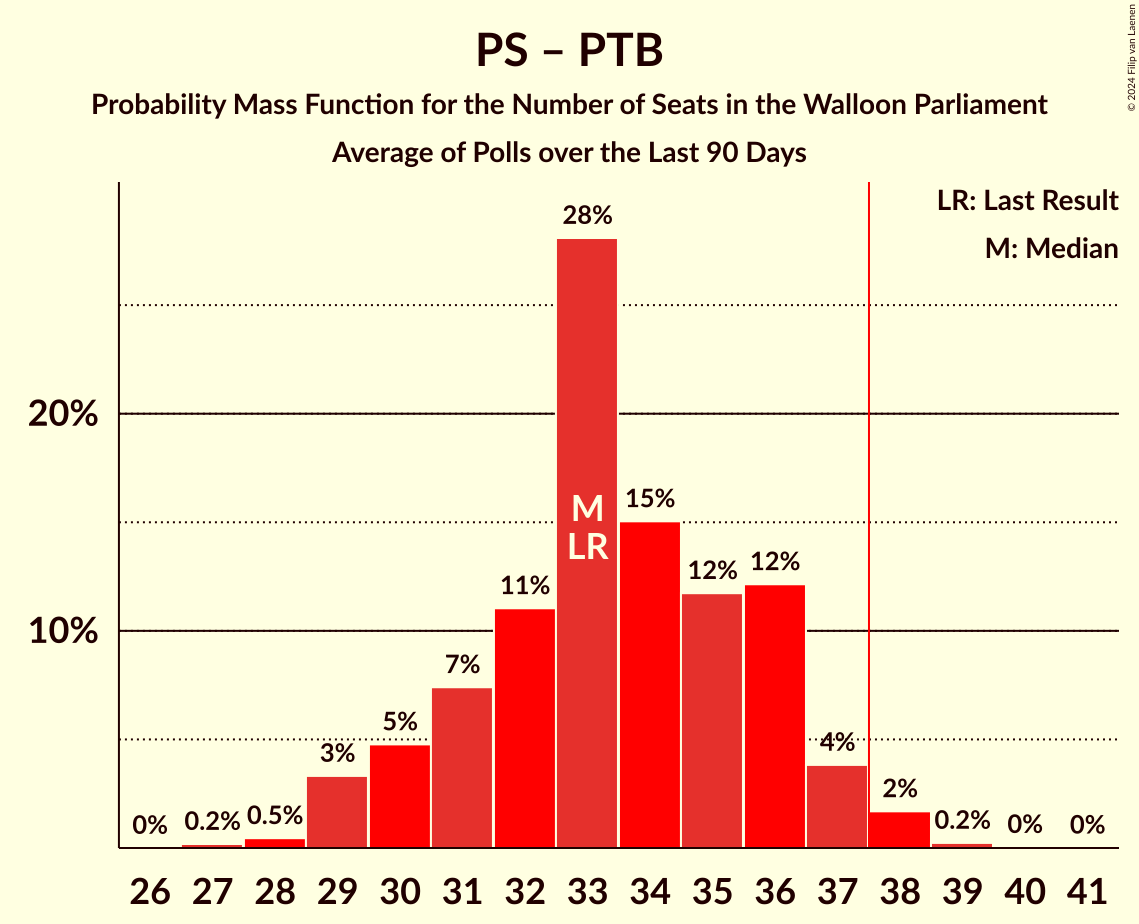
| Number of Seats | Probability | Accumulated | Special Marks |
|---|---|---|---|
| 27 | 0% | 100% | Last Result |
| 28 | 0% | 100% | |
| 29 | 0% | 100% | |
| 30 | 0% | 100% | |
| 31 | 0% | 100% | |
| 32 | 0% | 100% | |
| 33 | 0% | 100% | |
| 34 | 0.1% | 100% | |
| 35 | 0.5% | 99.8% | |
| 36 | 2% | 99.3% | |
| 37 | 12% | 97% | |
| 38 | 21% | 85% | Majority |
| 39 | 29% | 64% | Median |
| 40 | 23% | 35% | |
| 41 | 7% | 13% | |
| 42 | 4% | 6% | |
| 43 | 1.2% | 1.5% | |
| 44 | 0.2% | 0.3% | |
| 45 | 0% | 0% |
Parti Socialiste – Les Engagés
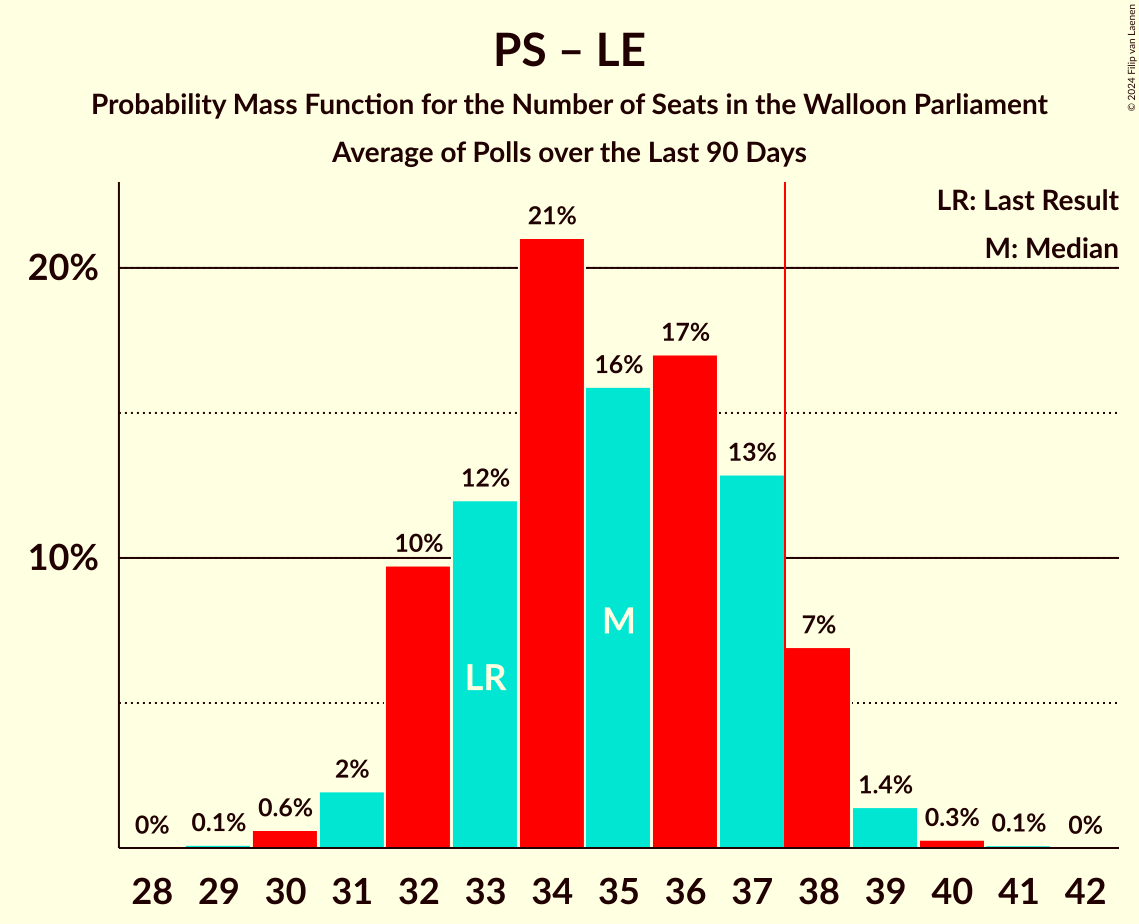
| Number of Seats | Probability | Accumulated | Special Marks |
|---|---|---|---|
| 33 | 0.2% | 100% | |
| 34 | 0.5% | 99.8% | |
| 35 | 4% | 99.3% | |
| 36 | 12% | 95% | Last Result |
| 37 | 19% | 83% | |
| 38 | 32% | 64% | Median, Majority |
| 39 | 20% | 32% | |
| 40 | 7% | 12% | |
| 41 | 4% | 5% | |
| 42 | 1.1% | 1.1% | |
| 43 | 0.1% | 0.1% | |
| 44 | 0% | 0% |
Mouvement Réformateur – Les Engagés – Ecolo
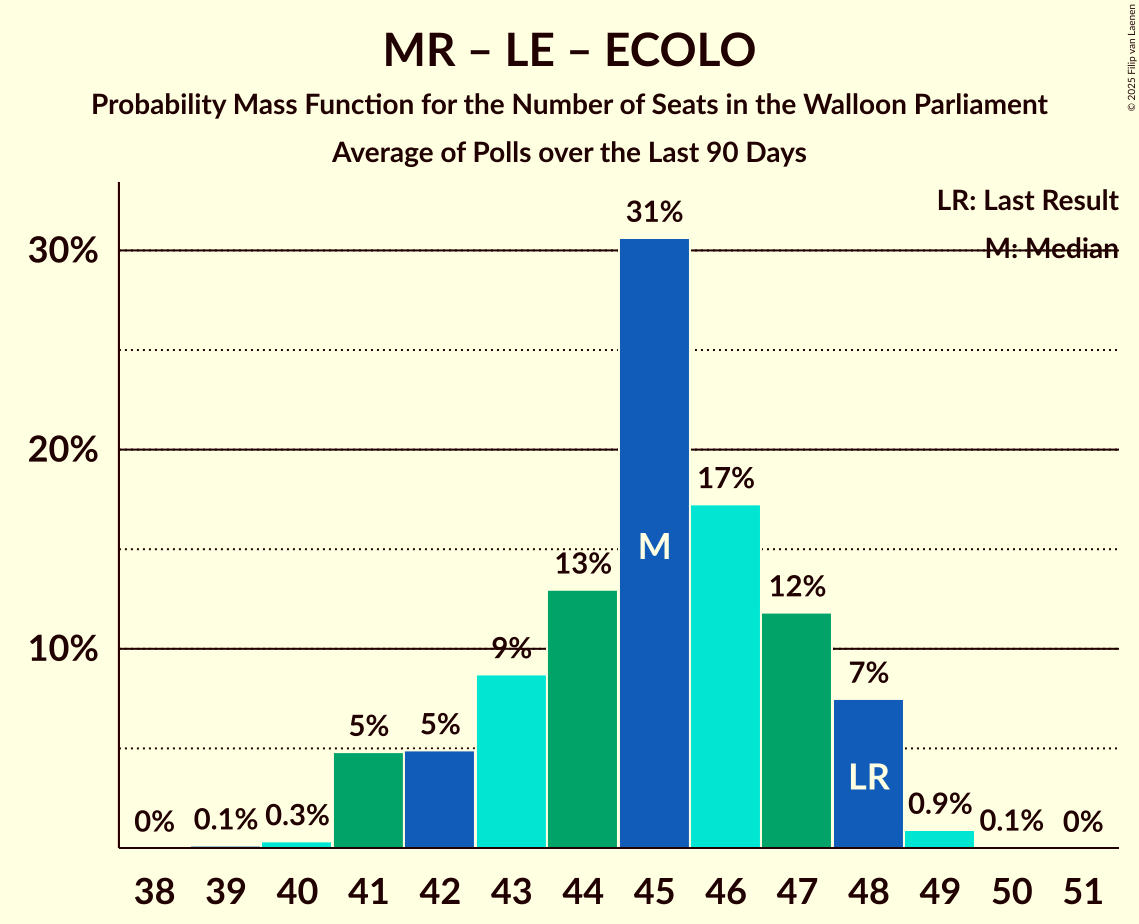
| Number of Seats | Probability | Accumulated | Special Marks |
|---|---|---|---|
| 30 | 0.1% | 100% | |
| 31 | 0.4% | 99.9% | |
| 32 | 2% | 99.6% | |
| 33 | 5% | 98% | |
| 34 | 10% | 93% | |
| 35 | 26% | 83% | |
| 36 | 31% | 57% | Median |
| 37 | 17% | 26% | |
| 38 | 7% | 9% | Majority |
| 39 | 2% | 2% | |
| 40 | 0.3% | 0.3% | |
| 41 | 0.1% | 0.1% | |
| 42 | 0% | 0% | |
| 43 | 0% | 0% | |
| 44 | 0% | 0% | |
| 45 | 0% | 0% | |
| 46 | 0% | 0% | |
| 47 | 0% | 0% | |
| 48 | 0% | 0% | Last Result |
Mouvement Réformateur – Les Engagés
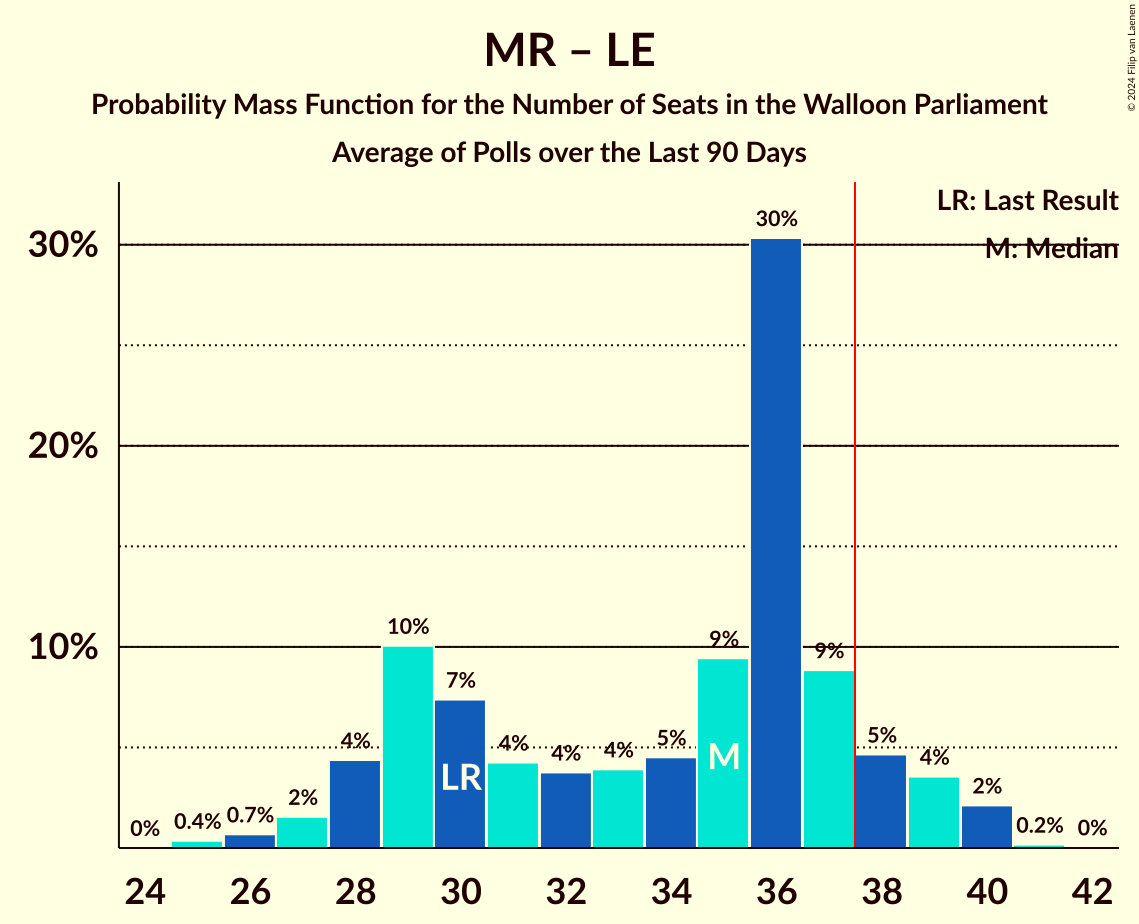
| Number of Seats | Probability | Accumulated | Special Marks |
|---|---|---|---|
| 27 | 0.2% | 100% | |
| 28 | 2% | 99.8% | |
| 29 | 4% | 98% | |
| 30 | 16% | 94% | |
| 31 | 30% | 78% | Median |
| 32 | 24% | 48% | |
| 33 | 16% | 24% | |
| 34 | 6% | 8% | |
| 35 | 2% | 2% | |
| 36 | 0.1% | 0.1% | |
| 37 | 0% | 0% | |
| 38 | 0% | 0% | Majority |
| 39 | 0% | 0% | |
| 40 | 0% | 0% | |
| 41 | 0% | 0% | |
| 42 | 0% | 0% | |
| 43 | 0% | 0% | Last Result |
Parti Socialiste – Ecolo
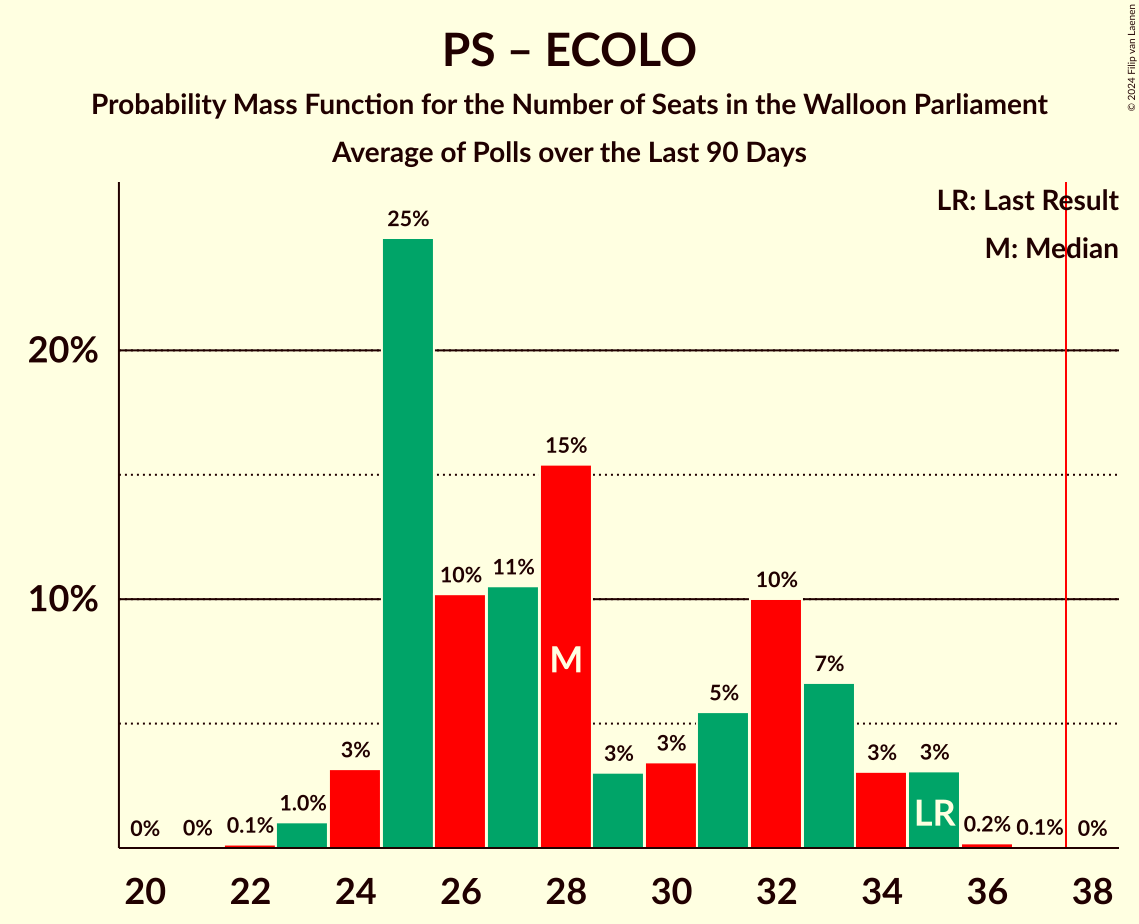
| Number of Seats | Probability | Accumulated | Special Marks |
|---|---|---|---|
| 23 | 0.1% | 100% | |
| 24 | 0.6% | 99.9% | Last Result |
| 25 | 5% | 99.3% | |
| 26 | 9% | 94% | |
| 27 | 18% | 85% | |
| 28 | 33% | 67% | |
| 29 | 16% | 33% | Median |
| 30 | 10% | 17% | |
| 31 | 6% | 7% | |
| 32 | 0.7% | 0.8% | |
| 33 | 0.1% | 0.1% | |
| 34 | 0% | 0% |
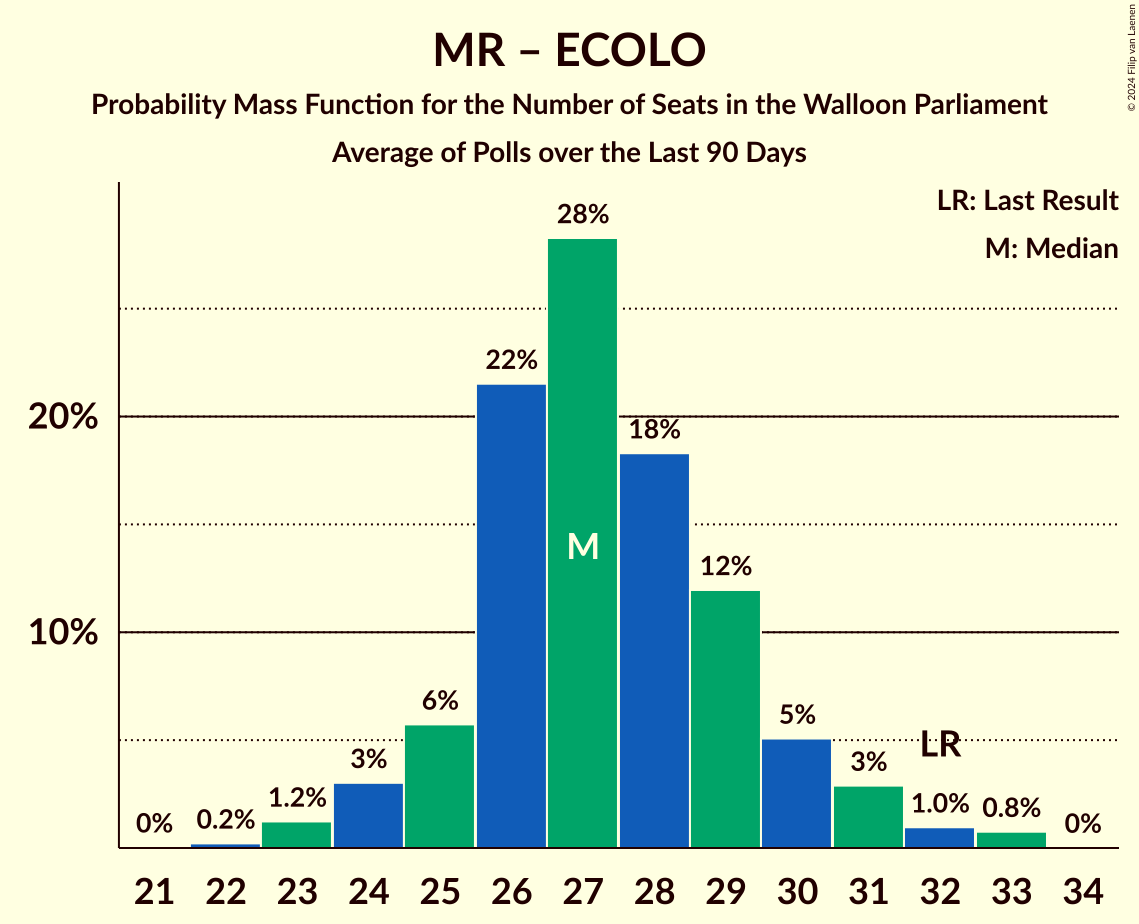
Mouvement Réformateur – Ecolo
| Number of Seats | Probability | Accumulated | Special Marks |
|---|---|---|---|
| 17 | 0.3% | 100% | |
| 18 | 1.5% | 99.7% | |
| 19 | 6% | 98% | |
| 20 | 13% | 92% | |
| 21 | 17% | 79% | |
| 22 | 41% | 62% | Median |
| 23 | 11% | 21% | |
| 24 | 7% | 10% | |
| 25 | 3% | 3% | |
| 26 | 0.2% | 0.3% | |
| 27 | 0.1% | 0.1% | |
| 28 | 0% | 0% | |
| 29 | 0% | 0% | |
| 30 | 0% | 0% | |
| 31 | 0% | 0% | Last Result |
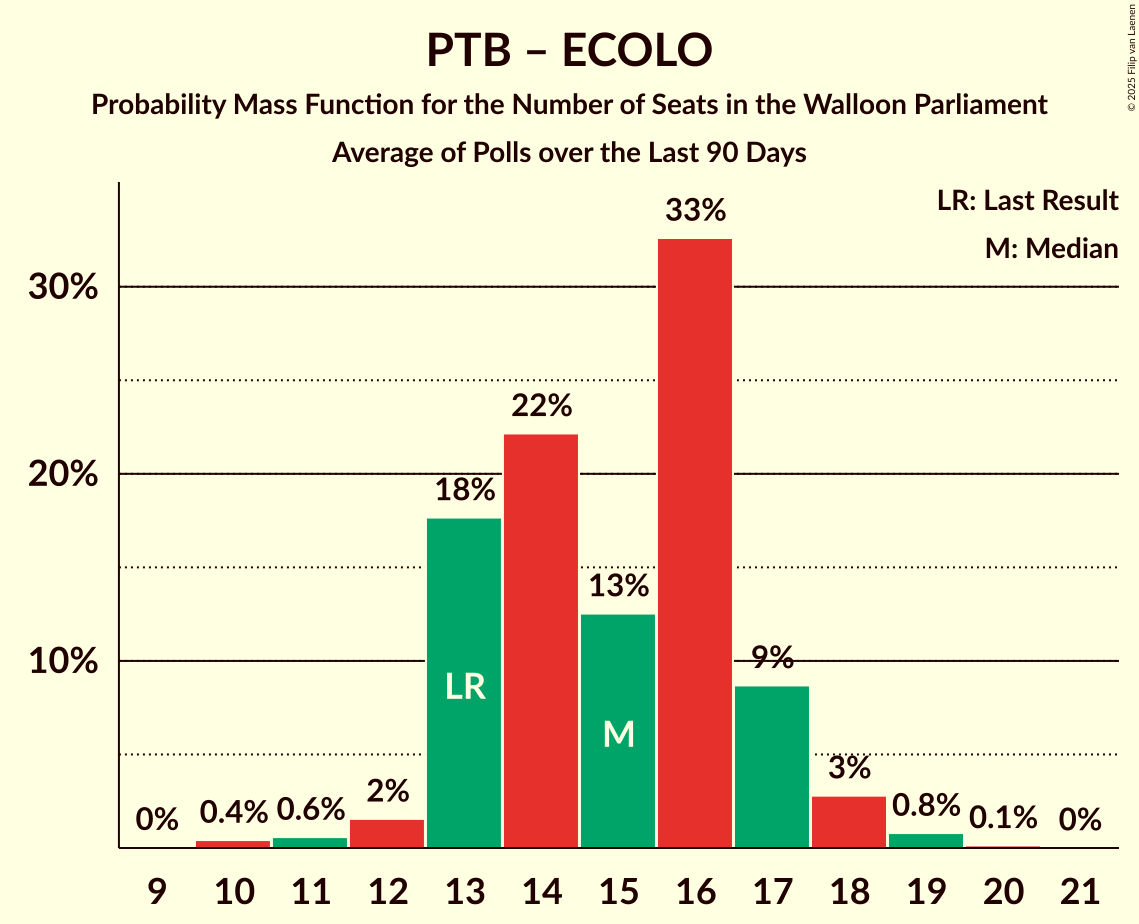
Parti du Travail de Belgique – Ecolo
| Number of Seats | Probability | Accumulated | Special Marks |
|---|---|---|---|
| 13 | 0% | 100% | Last Result |
| 14 | 0% | 100% | |
| 15 | 2% | 100% | |
| 16 | 3% | 98% | |
| 17 | 7% | 96% | |
| 18 | 7% | 89% | |
| 19 | 41% | 82% | |
| 20 | 22% | 40% | Median |
| 21 | 16% | 19% | |
| 22 | 2% | 3% | |
| 23 | 0.5% | 0.6% | |
| 24 | 0.1% | 0.2% | |
| 25 | 0% | 0% |
Technical Information
- Number of polls included in this average: 1
- Lowest number of simulations done in a poll included in this average: 2,097,152
- Total number of simulations done in the polls included in this average: 2,097,152
- Error estimate: 0.93%