Opinion Poll by MMR, 26–27 October 2017
Voting Intentions | Seats | Coalitions | Technical Information
Voting Intentions
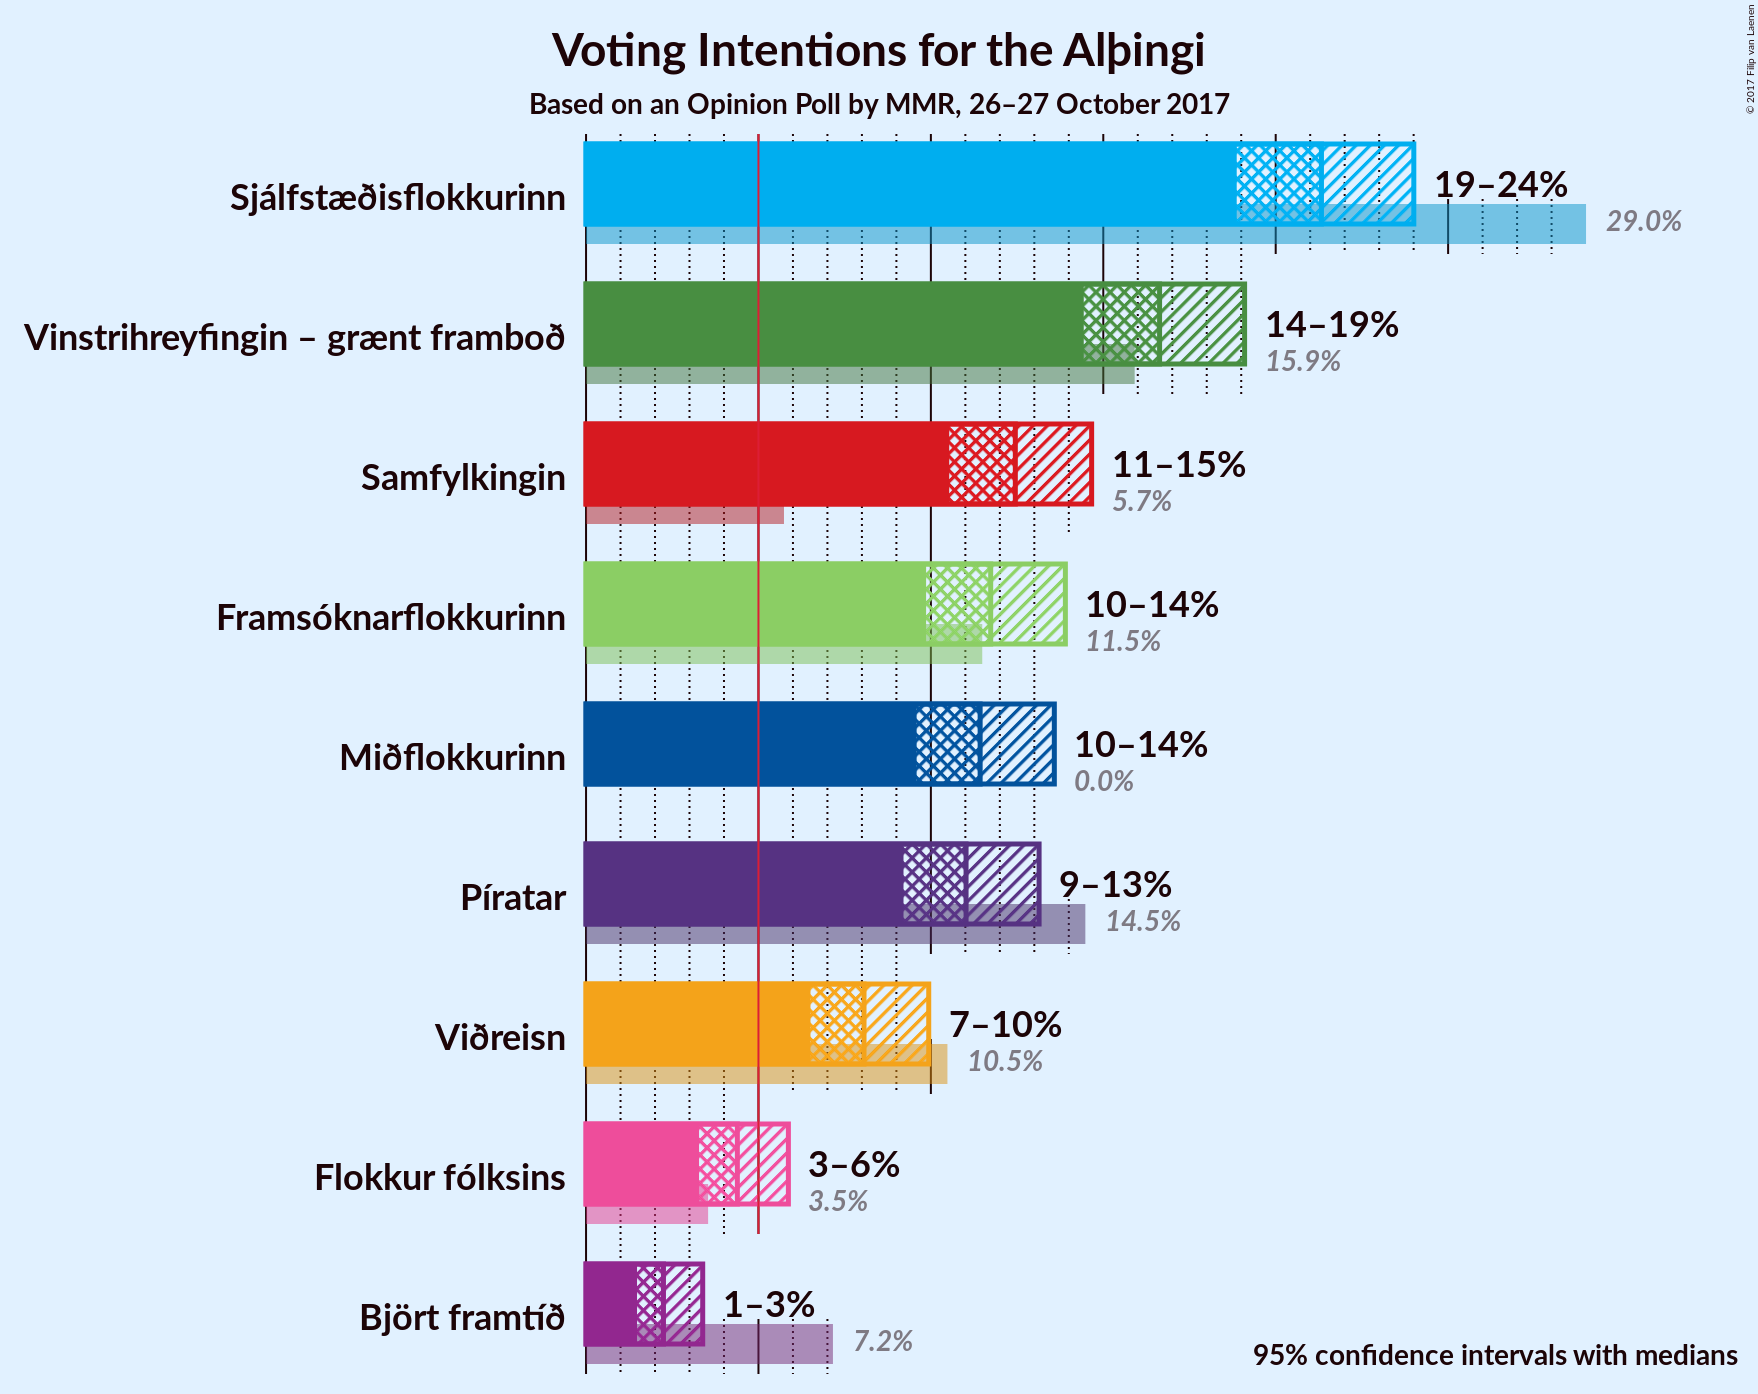
Confidence Intervals
| Party |
Last Result |
Poll Result |
80% Confidence Interval |
90% Confidence Interval |
95% Confidence Interval |
99% Confidence Interval |
| Sjálfstæðisflokkurinn |
29.0% |
21.3% |
19.7–23.1% |
19.3–23.6% |
18.9–24.0% |
18.1–24.9% |
| Vinstrihreyfingin – grænt framboð |
15.9% |
16.6% |
15.2–18.2% |
14.8–18.7% |
14.4–19.1% |
13.8–19.9% |
| Samfylkingin |
5.7% |
12.4% |
11.2–13.9% |
10.8–14.3% |
10.5–14.7% |
10.0–15.4% |
| Framsóknarflokkurinn |
11.5% |
11.7% |
10.5–13.2% |
10.2–13.5% |
9.9–13.9% |
9.3–14.6% |
| Miðflokkurinn |
0.0% |
11.4% |
10.2–12.8% |
9.9–13.2% |
9.6–13.6% |
9.0–14.3% |
| Píratar |
14.5% |
11.0% |
9.8–12.4% |
9.5–12.8% |
9.2–13.1% |
8.7–13.8% |
| Viðreisn |
10.5% |
8.1% |
7.0–9.3% |
6.8–9.6% |
6.5–9.9% |
6.1–10.5% |
| Flokkur fólksins |
3.5% |
4.4% |
3.7–5.3% |
3.4–5.6% |
3.3–5.9% |
3.0–6.4% |
| Björt framtíð |
7.2% |
2.2% |
1.7–3.0% |
1.6–3.2% |
1.5–3.4% |
1.3–3.8% |
Note: The poll result column reflects the actual value used in the calculations. Published results may vary slightly, and in addition be rounded to fewer digits.
Seats
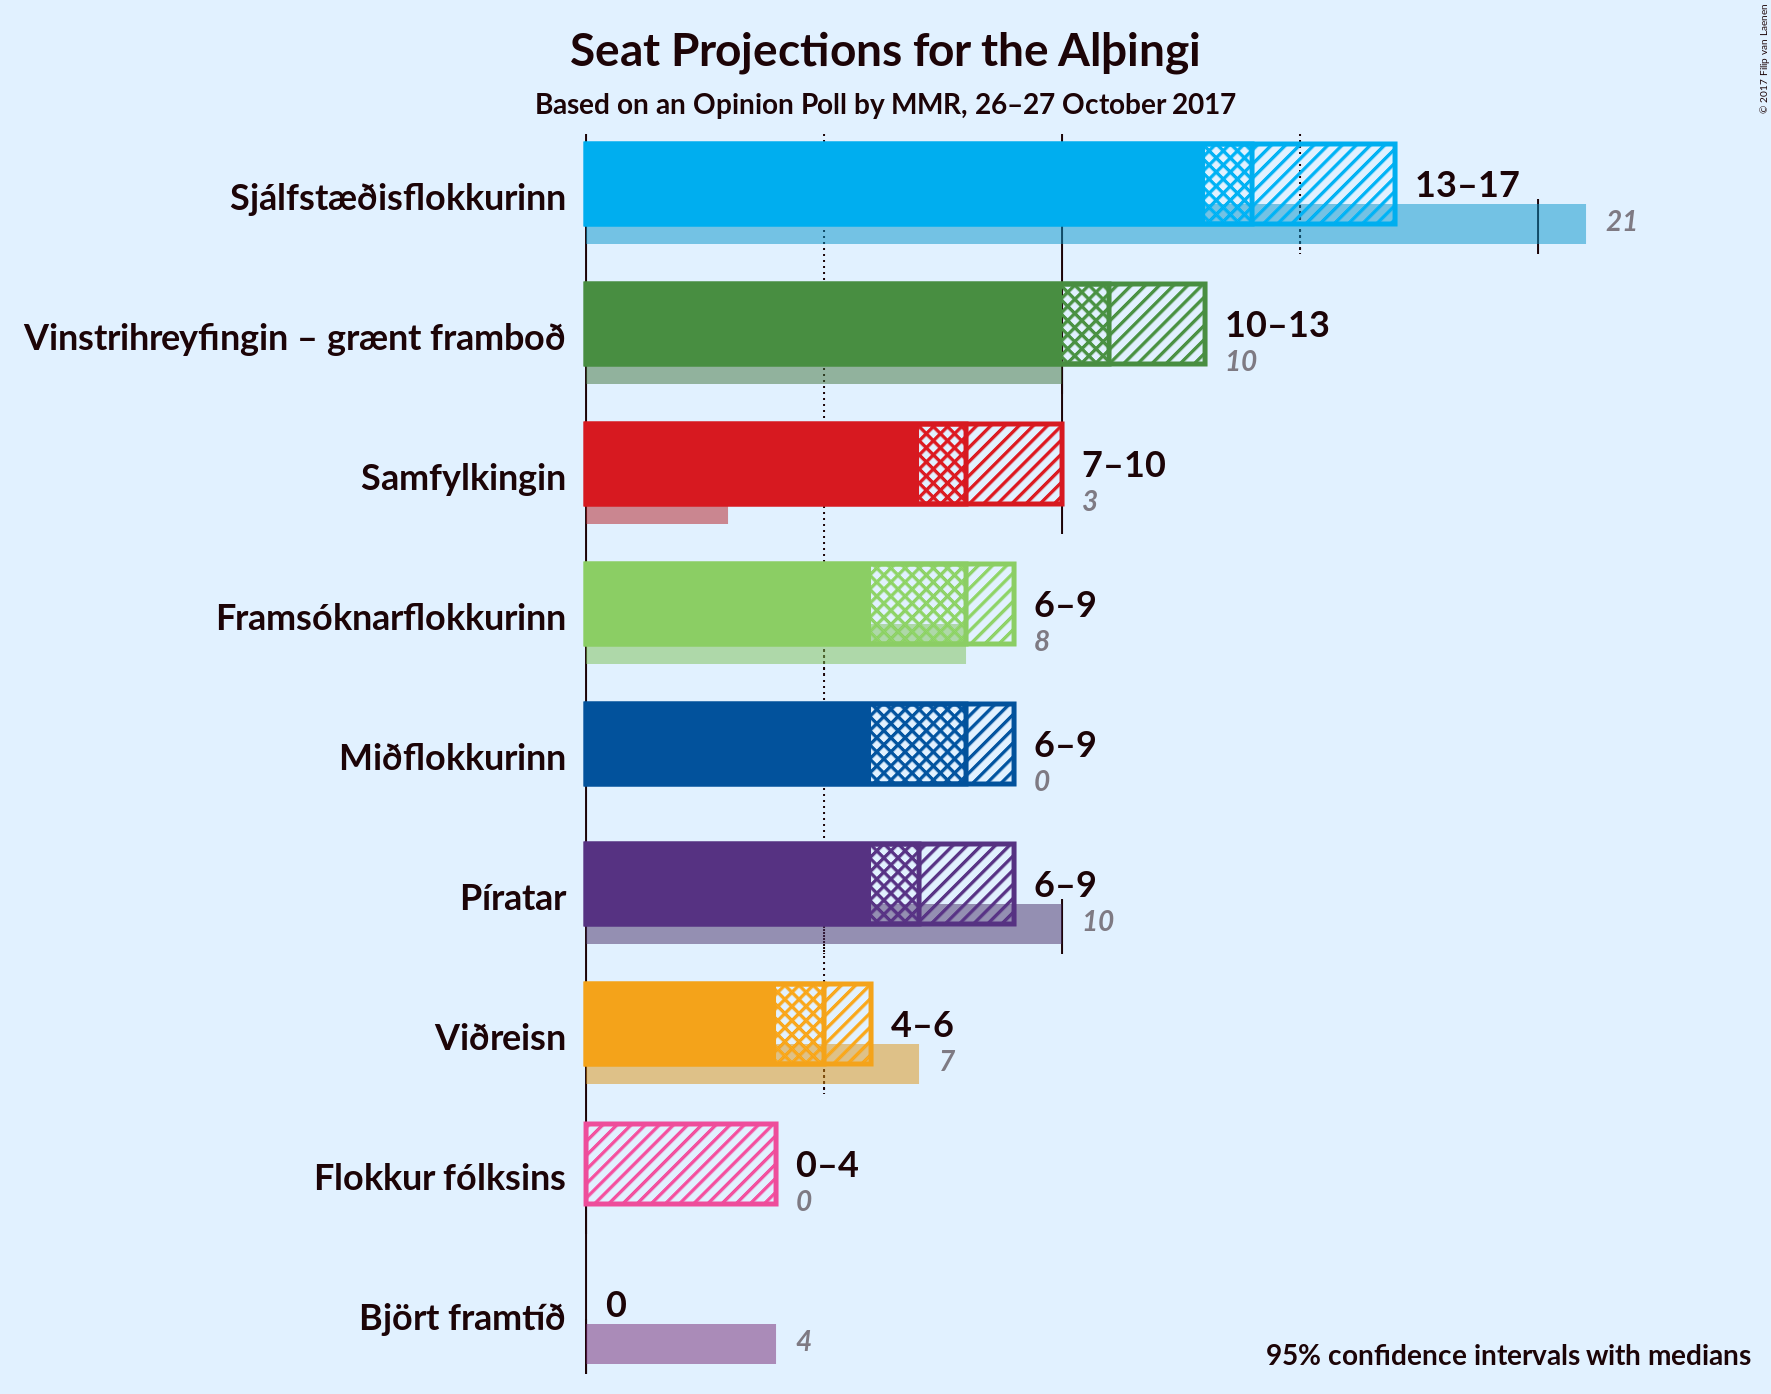
Confidence Intervals
Sjálfstæðisflokkurinn
For a full overview of the results for this party, see the Sjálfstæðisflokkurinn page.
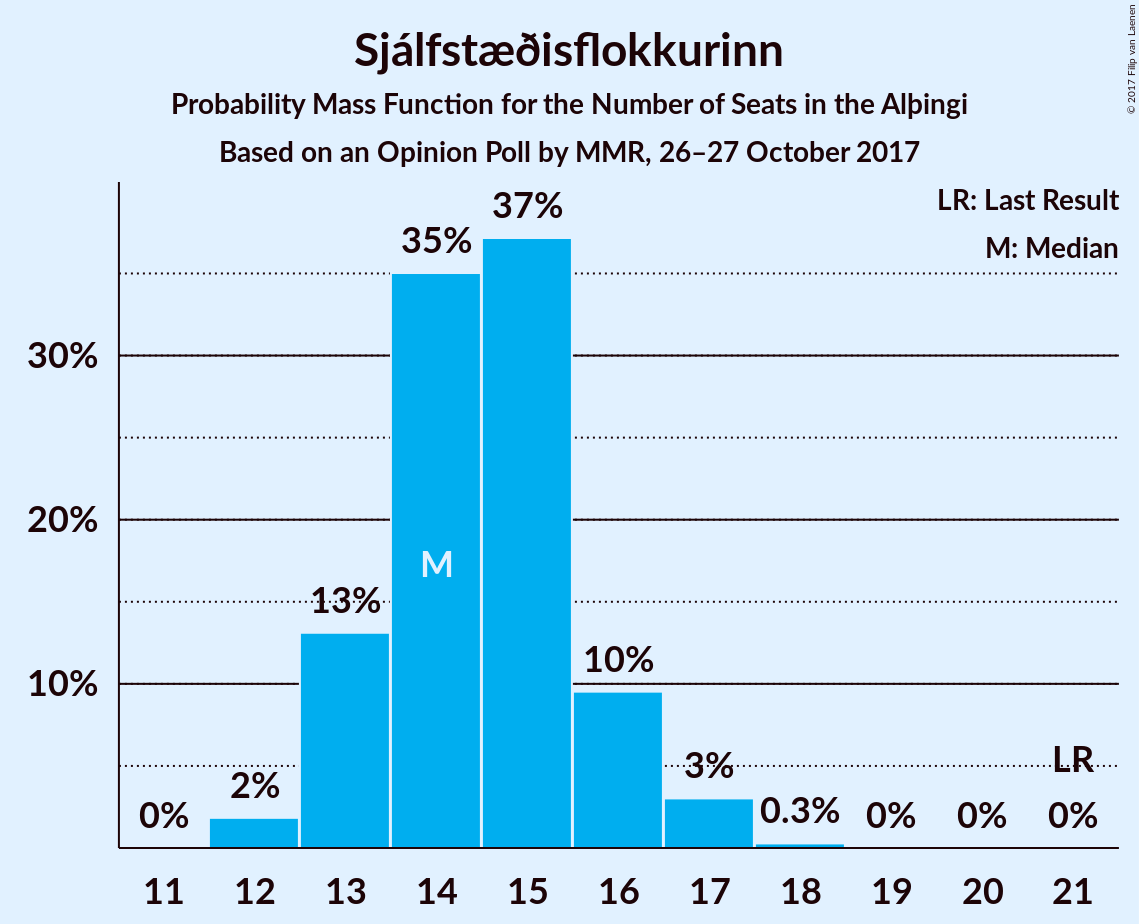
| Number of Seats |
Probability |
Accumulated |
Special Marks |
| 12 |
2% |
100% |
|
| 13 |
13% |
98% |
|
| 14 |
35% |
85% |
Median |
| 15 |
37% |
50% |
|
| 16 |
10% |
13% |
|
| 17 |
3% |
3% |
|
| 18 |
0.3% |
0.3% |
|
| 19 |
0% |
0% |
|
| 20 |
0% |
0% |
|
| 21 |
0% |
0% |
Last Result |
Vinstrihreyfingin – grænt framboð
For a full overview of the results for this party, see the Vinstrihreyfingin – grænt framboð page.
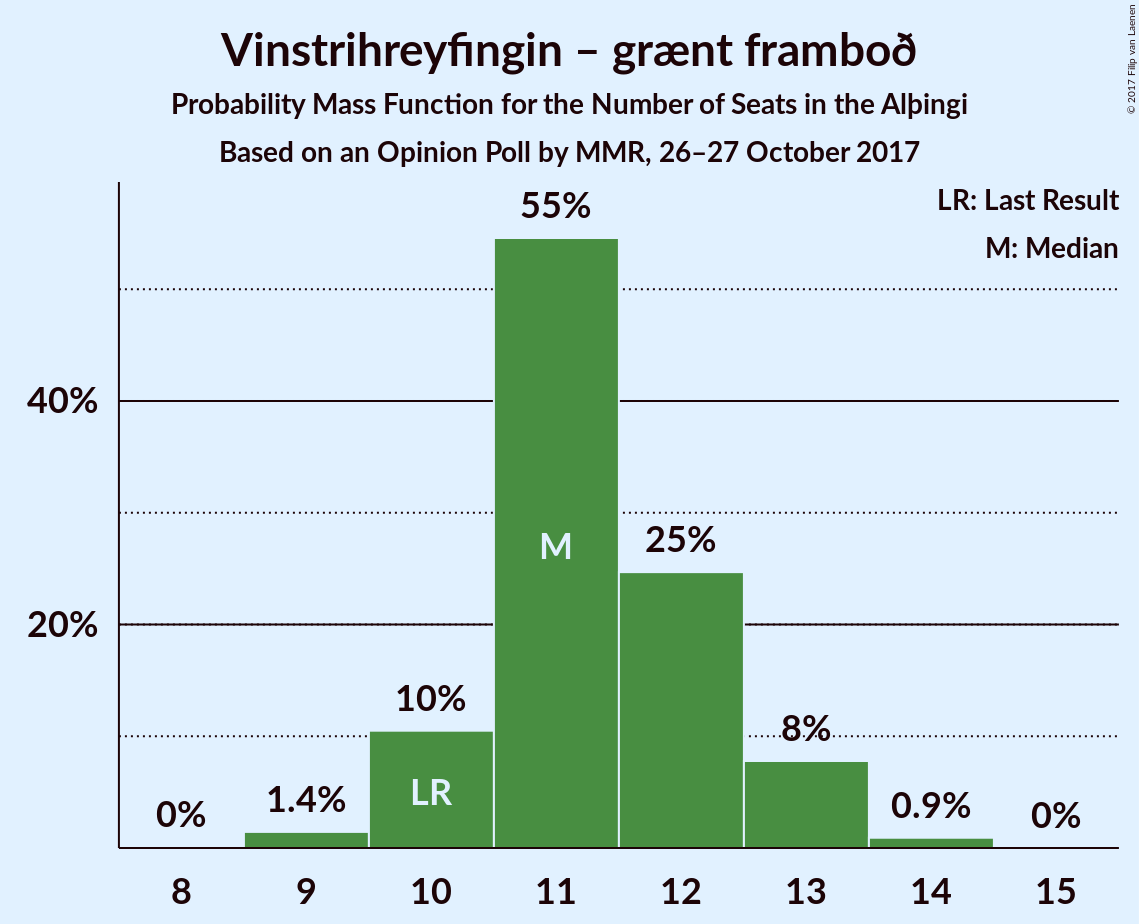
| Number of Seats |
Probability |
Accumulated |
Special Marks |
| 9 |
1.4% |
100% |
|
| 10 |
10% |
98.5% |
Last Result |
| 11 |
55% |
88% |
Median |
| 12 |
25% |
33% |
|
| 13 |
8% |
9% |
|
| 14 |
0.9% |
1.0% |
|
| 15 |
0% |
0% |
|
Samfylkingin
For a full overview of the results for this party, see the Samfylkingin page.
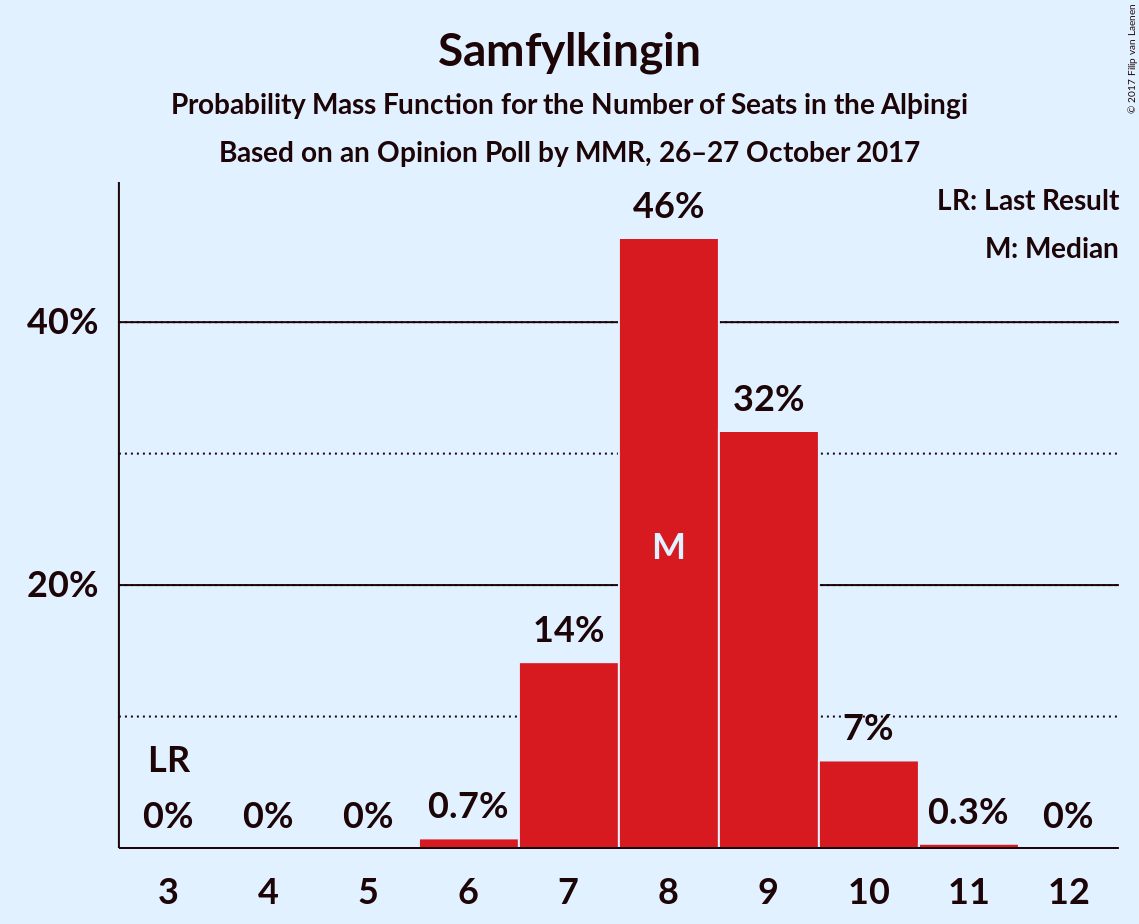
| Number of Seats |
Probability |
Accumulated |
Special Marks |
| 3 |
0% |
100% |
Last Result |
| 4 |
0% |
100% |
|
| 5 |
0% |
100% |
|
| 6 |
0.7% |
100% |
|
| 7 |
14% |
99.3% |
|
| 8 |
46% |
85% |
Median |
| 9 |
32% |
39% |
|
| 10 |
7% |
7% |
|
| 11 |
0.3% |
0.4% |
|
| 12 |
0% |
0% |
|
Framsóknarflokkurinn
For a full overview of the results for this party, see the Framsóknarflokkurinn page.
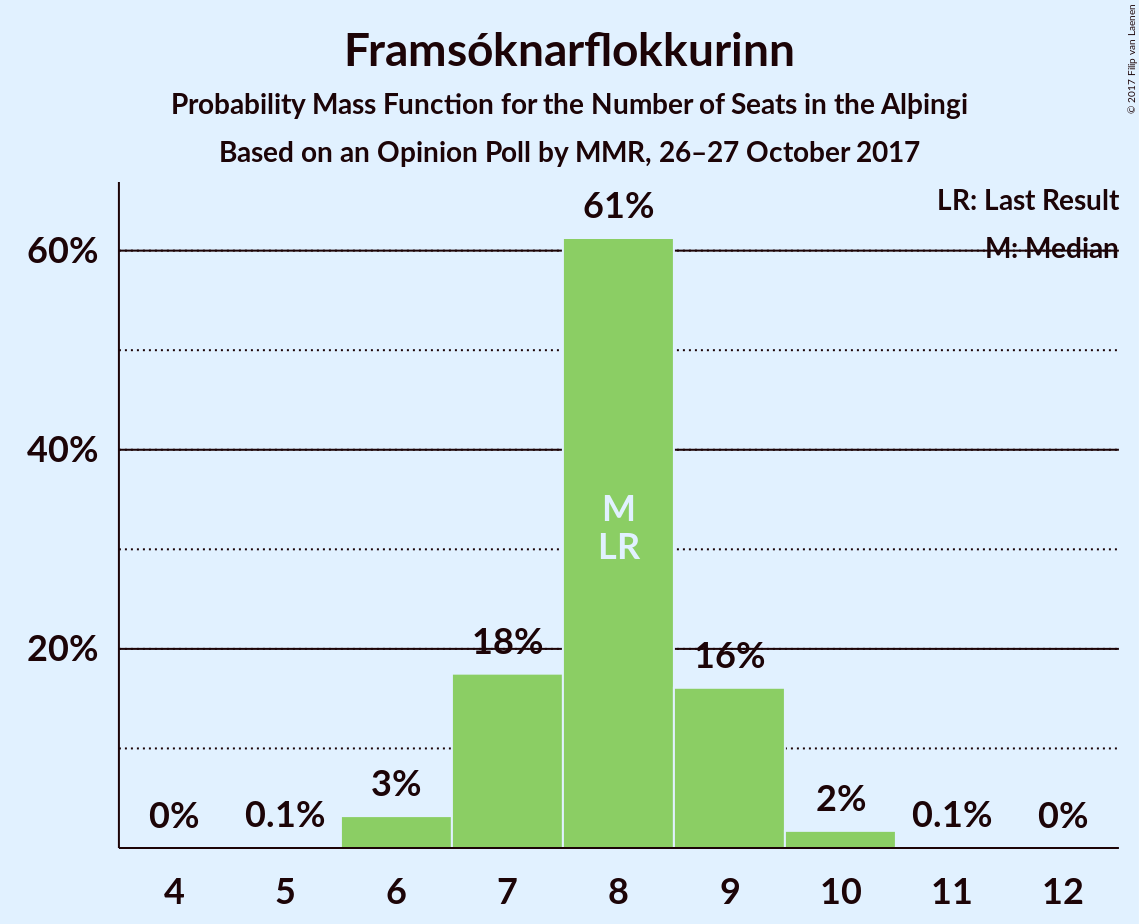
| Number of Seats |
Probability |
Accumulated |
Special Marks |
| 5 |
0.1% |
100% |
|
| 6 |
3% |
99.9% |
|
| 7 |
18% |
97% |
|
| 8 |
61% |
79% |
Last Result, Median |
| 9 |
16% |
18% |
|
| 10 |
2% |
2% |
|
| 11 |
0.1% |
0.1% |
|
| 12 |
0% |
0% |
|
Miðflokkurinn
For a full overview of the results for this party, see the Miðflokkurinn page.
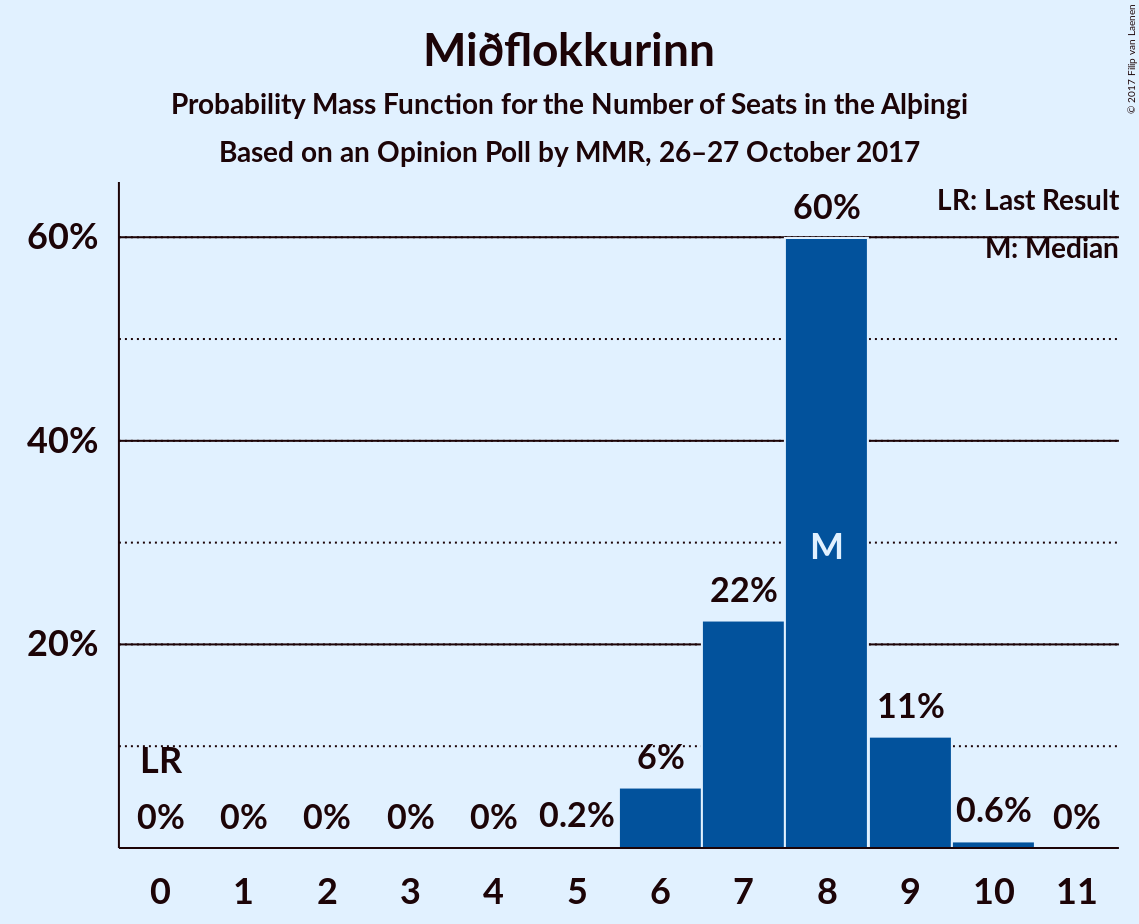
| Number of Seats |
Probability |
Accumulated |
Special Marks |
| 0 |
0% |
100% |
Last Result |
| 1 |
0% |
100% |
|
| 2 |
0% |
100% |
|
| 3 |
0% |
100% |
|
| 4 |
0% |
100% |
|
| 5 |
0.2% |
100% |
|
| 6 |
6% |
99.8% |
|
| 7 |
22% |
94% |
|
| 8 |
60% |
72% |
Median |
| 9 |
11% |
12% |
|
| 10 |
0.6% |
0.7% |
|
| 11 |
0% |
0% |
|
Píratar
For a full overview of the results for this party, see the Píratar page.
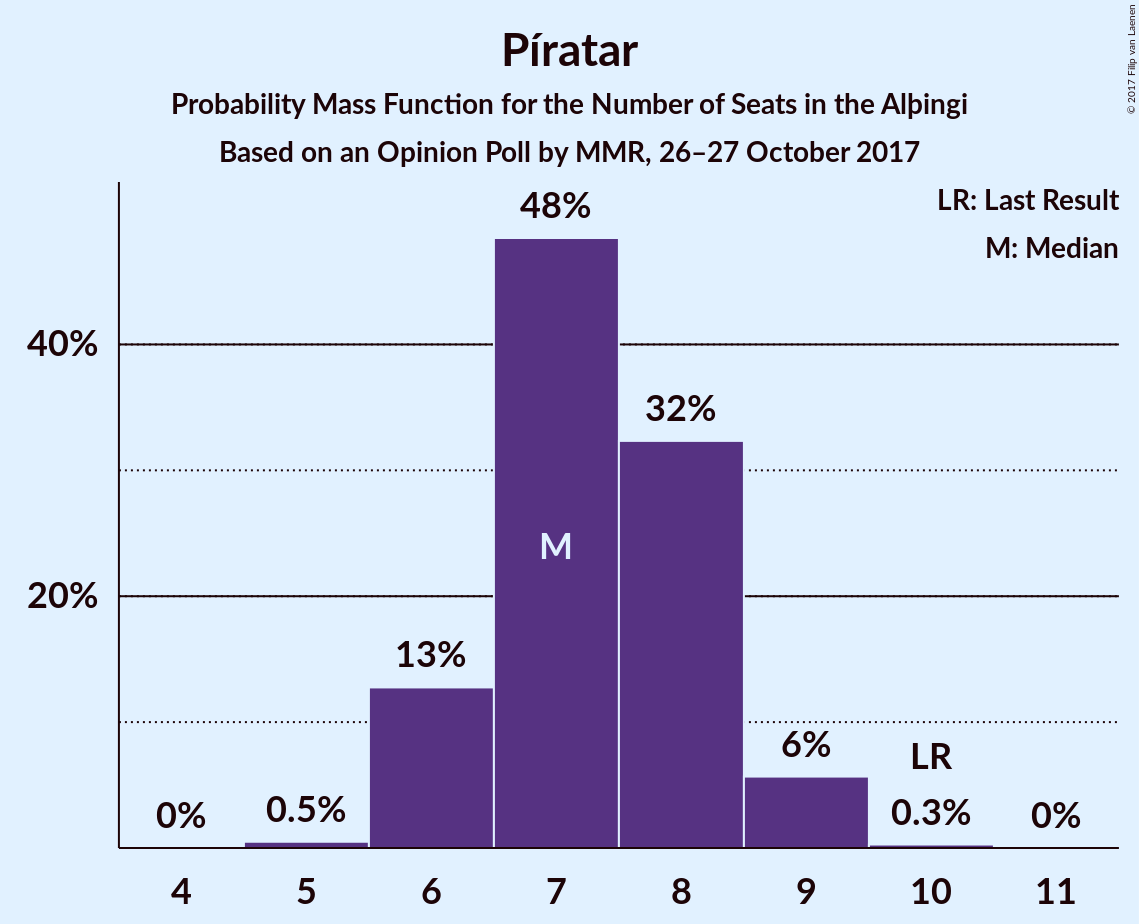
| Number of Seats |
Probability |
Accumulated |
Special Marks |
| 5 |
0.5% |
100% |
|
| 6 |
13% |
99.5% |
|
| 7 |
48% |
87% |
Median |
| 8 |
32% |
38% |
|
| 9 |
6% |
6% |
|
| 10 |
0.3% |
0.3% |
Last Result |
| 11 |
0% |
0% |
|
Viðreisn
For a full overview of the results for this party, see the Viðreisn page.
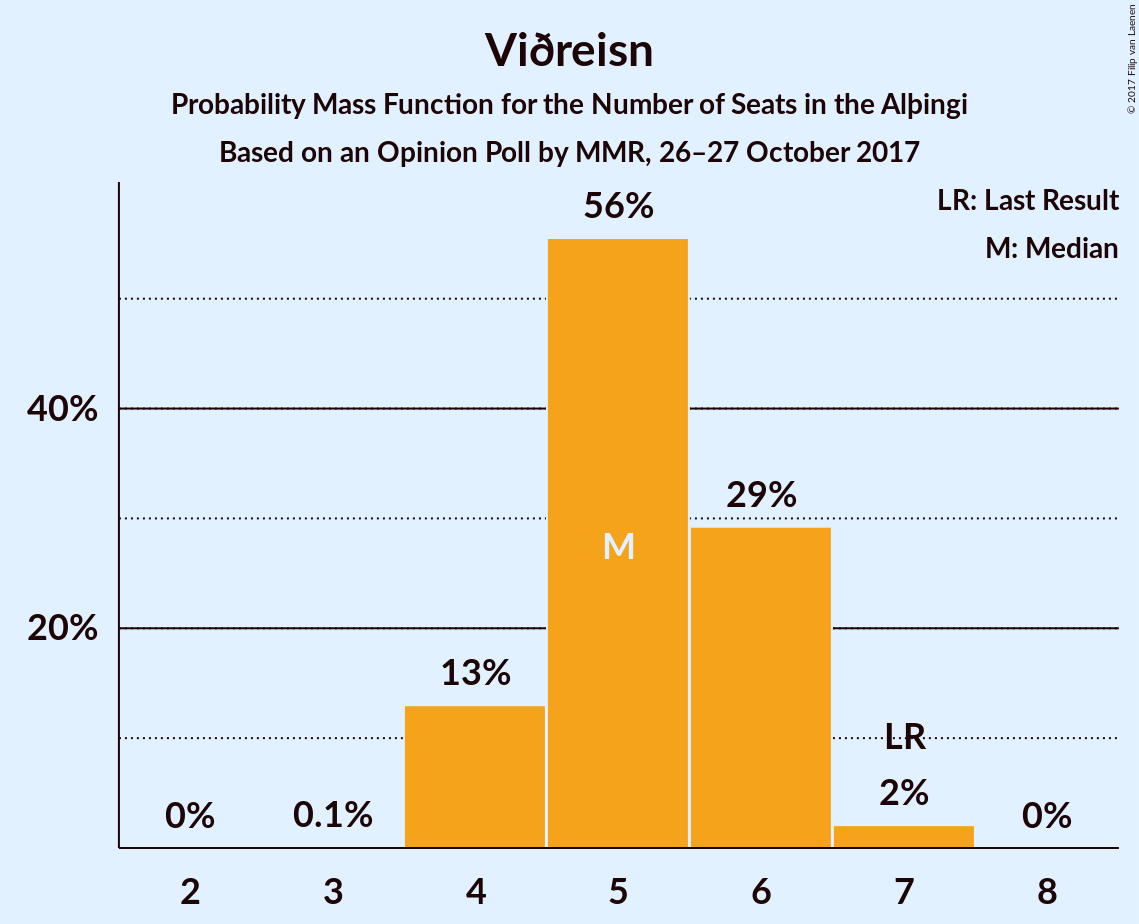
| Number of Seats |
Probability |
Accumulated |
Special Marks |
| 3 |
0.1% |
100% |
|
| 4 |
13% |
99.9% |
|
| 5 |
56% |
87% |
Median |
| 6 |
29% |
31% |
|
| 7 |
2% |
2% |
Last Result |
| 8 |
0% |
0% |
|
Flokkur fólksins
For a full overview of the results for this party, see the Flokkur fólksins page.
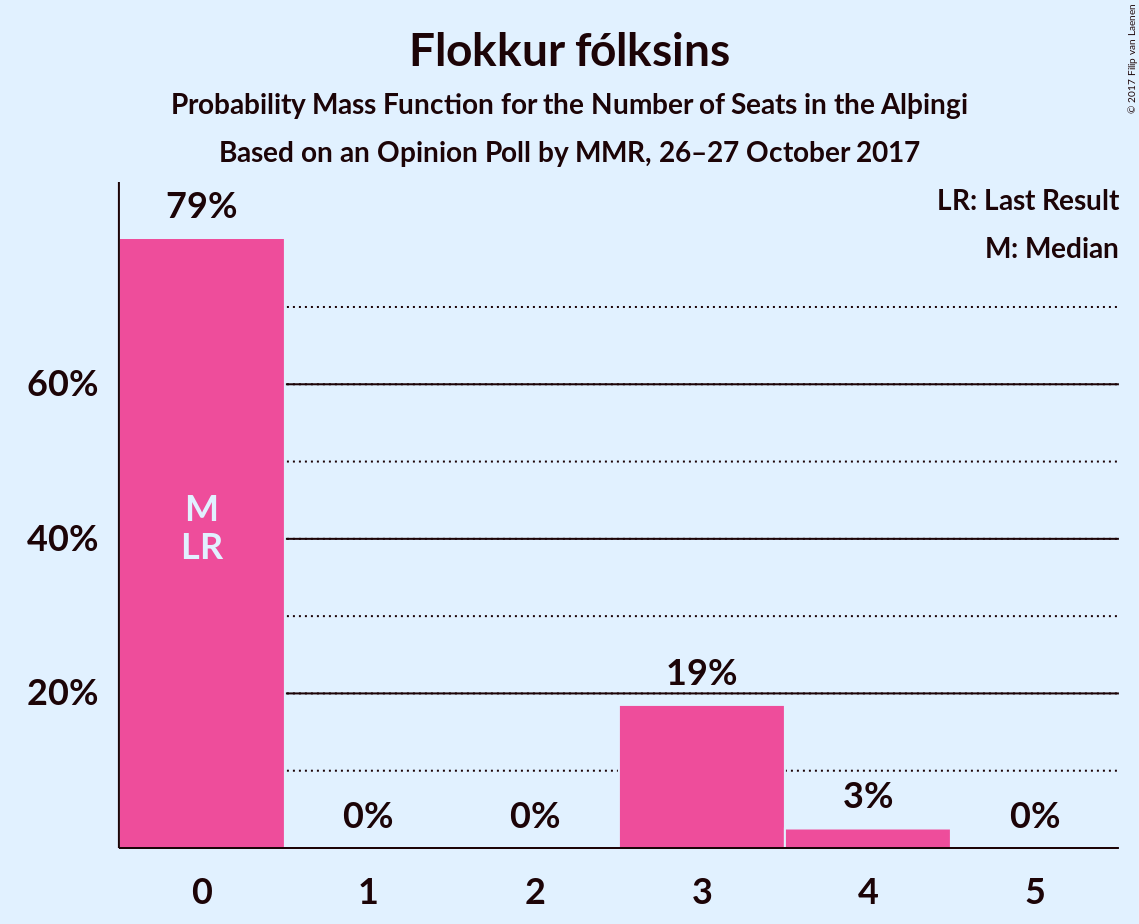
| Number of Seats |
Probability |
Accumulated |
Special Marks |
| 0 |
79% |
100% |
Last Result, Median |
| 1 |
0% |
21% |
|
| 2 |
0% |
21% |
|
| 3 |
19% |
21% |
|
| 4 |
3% |
3% |
|
| 5 |
0% |
0% |
|
Björt framtíð
For a full overview of the results for this party, see the Björt framtíð page.
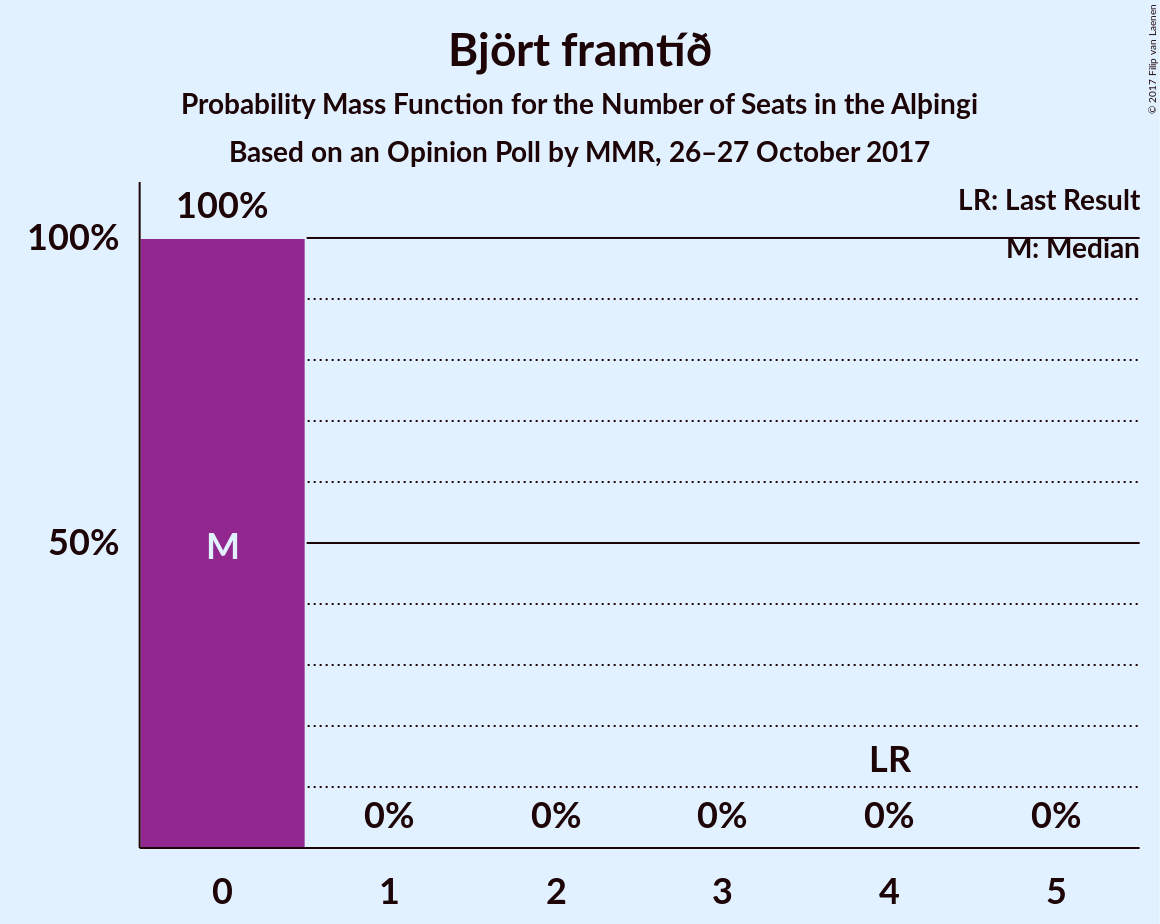
| Number of Seats |
Probability |
Accumulated |
Special Marks |
| 0 |
100% |
100% |
Median |
| 1 |
0% |
0% |
|
| 2 |
0% |
0% |
|
| 3 |
0% |
0% |
|
| 4 |
0% |
0% |
Last Result |
Coalitions
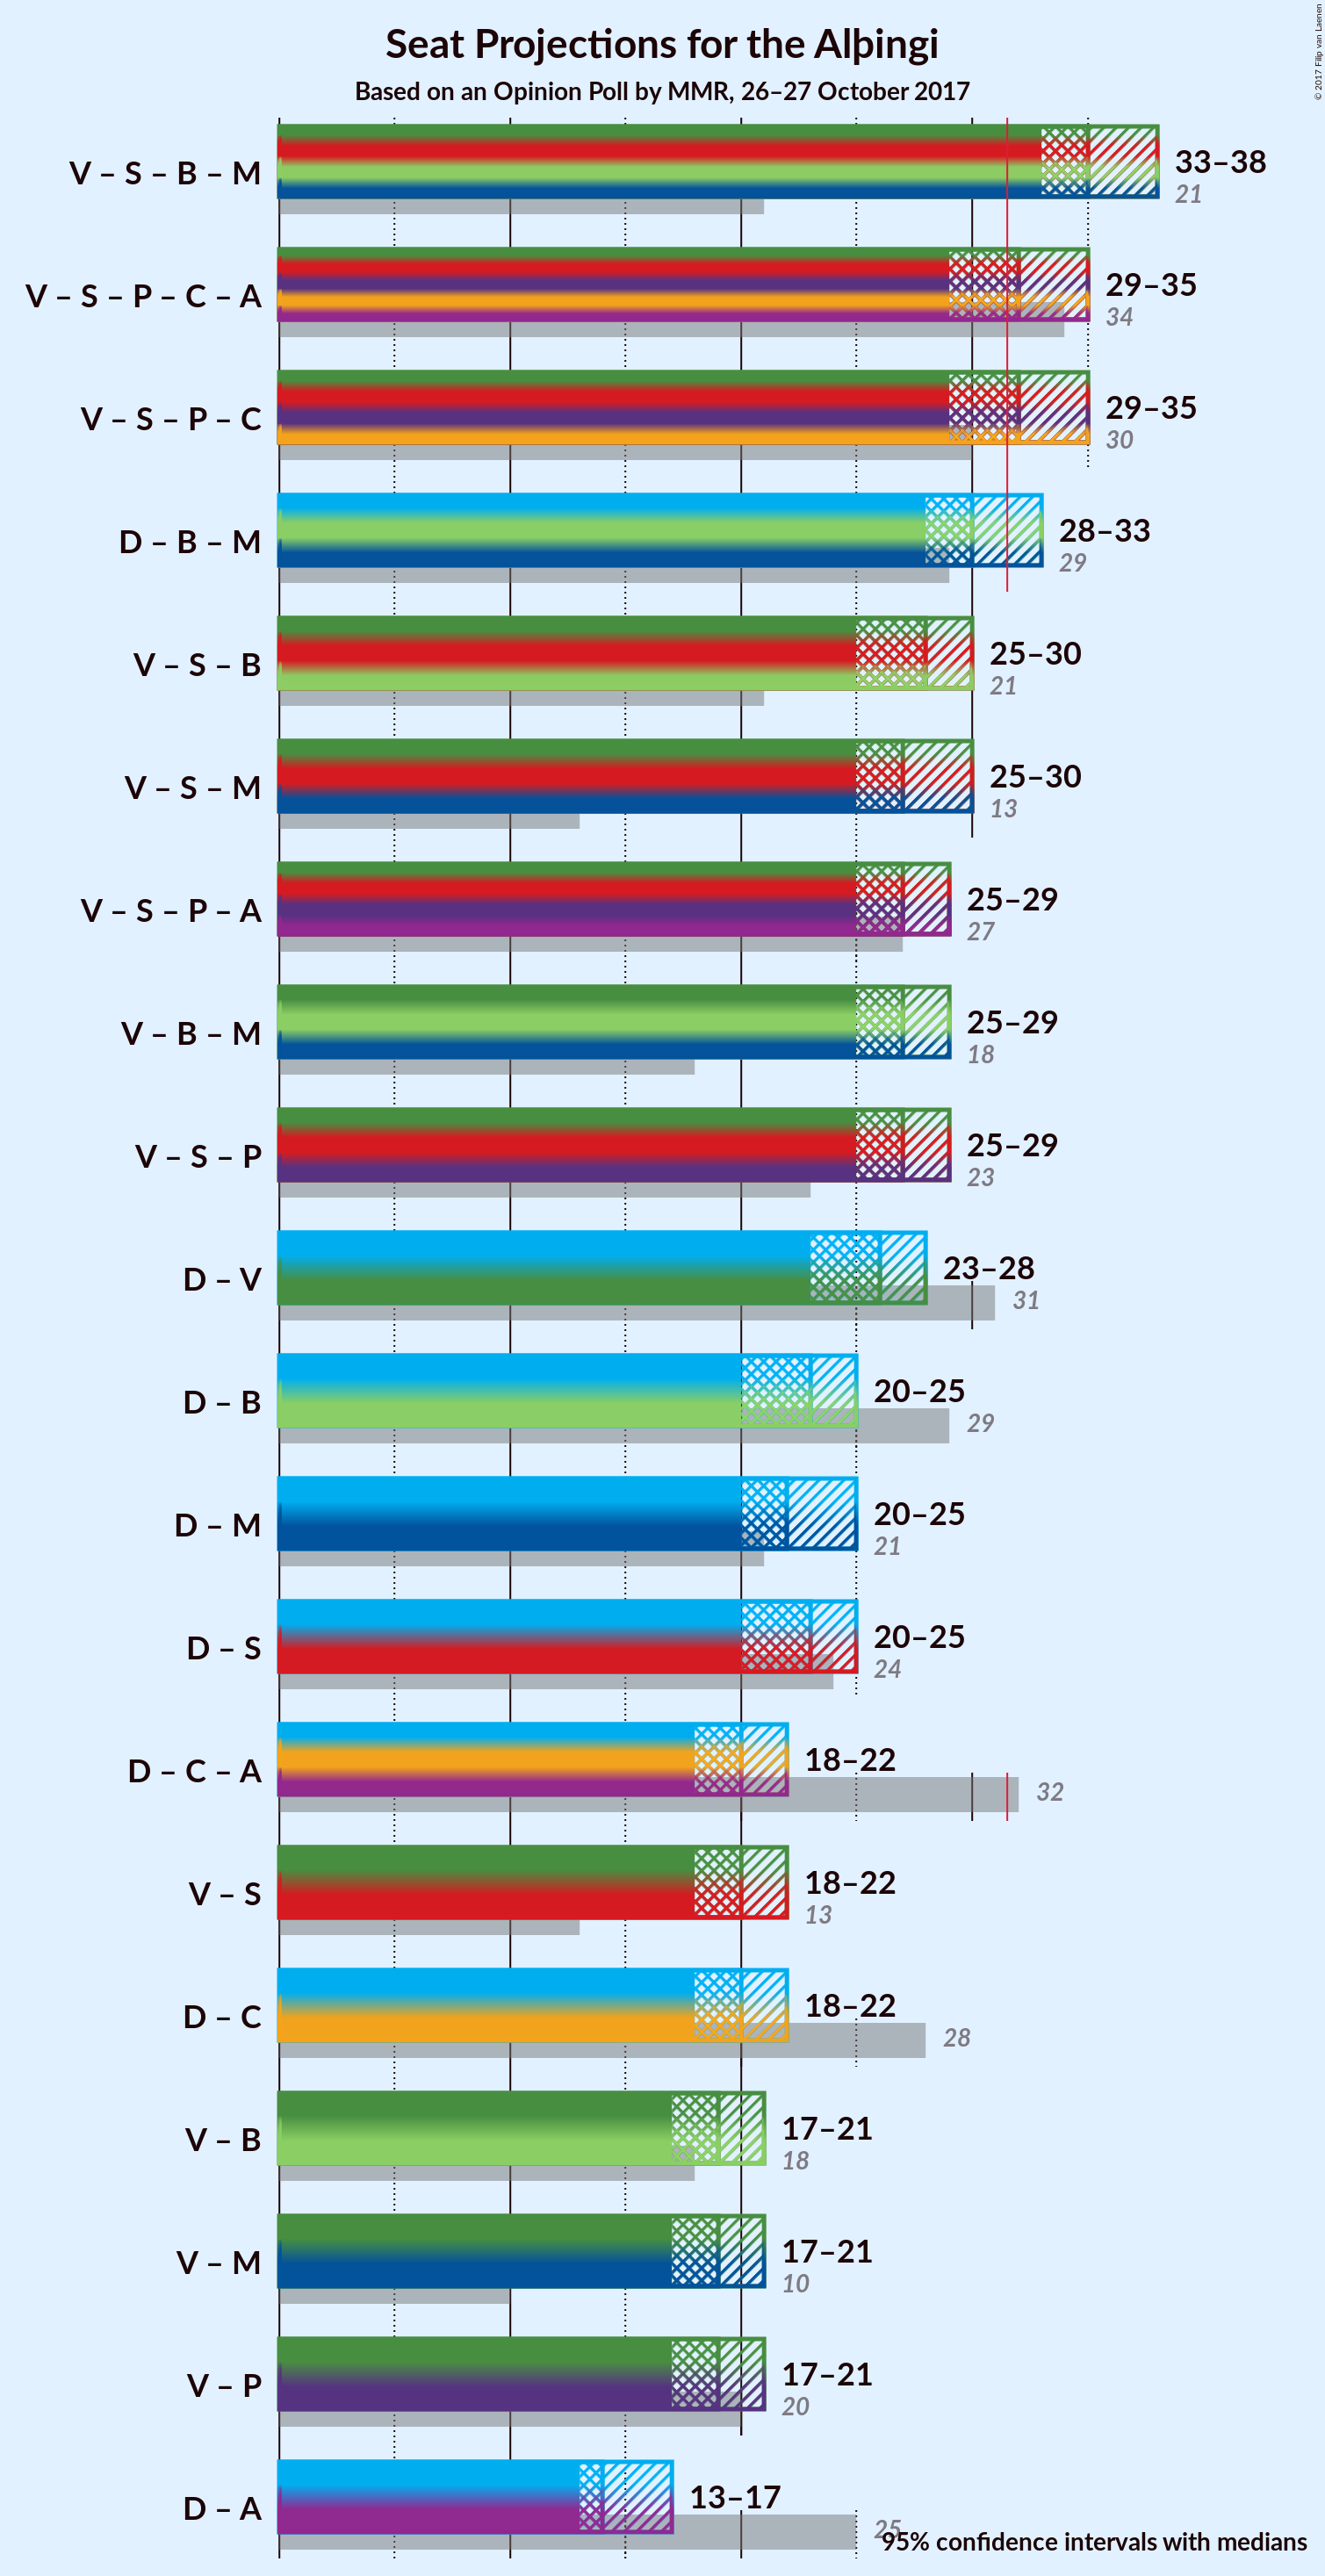
Confidence Intervals
| Coalition |
Last Result |
Median |
Majority? |
80% Confidence Interval |
90% Confidence Interval |
95% Confidence Interval |
99% Confidence Interval |
| Vinstrihreyfingin – grænt framboð – Samfylkingin – Framsóknarflokkurinn – Miðflokkurinn |
21 |
35 |
99.8% |
34–37 |
33–37 |
33–38 |
32–38 |
| Vinstrihreyfingin – grænt framboð – Samfylkingin – Píratar – Viðreisn – Björt framtíð |
34 |
32 |
70% |
30–34 |
30–34 |
29–35 |
29–35 |
| Vinstrihreyfingin – grænt framboð – Samfylkingin – Píratar – Viðreisn |
30 |
32 |
70% |
30–34 |
30–34 |
29–35 |
29–35 |
| Sjálfstæðisflokkurinn – Framsóknarflokkurinn – Miðflokkurinn |
29 |
30 |
13% |
29–32 |
28–32 |
28–33 |
27–33 |
| Vinstrihreyfingin – grænt framboð – Samfylkingin – Framsóknarflokkurinn |
21 |
28 |
0.1% |
26–29 |
26–30 |
25–30 |
24–31 |
| Vinstrihreyfingin – grænt framboð – Samfylkingin – Miðflokkurinn |
13 |
27 |
0% |
26–29 |
25–29 |
25–30 |
24–30 |
| Vinstrihreyfingin – grænt framboð – Samfylkingin – Píratar – Björt framtíð |
27 |
27 |
0% |
25–28 |
25–29 |
25–29 |
24–30 |
| Vinstrihreyfingin – grænt framboð – Framsóknarflokkurinn – Miðflokkurinn |
18 |
27 |
0% |
26–29 |
25–29 |
25–29 |
24–30 |
| Vinstrihreyfingin – grænt framboð – Samfylkingin – Píratar |
23 |
27 |
0% |
25–28 |
25–29 |
25–29 |
24–30 |
| Sjálfstæðisflokkurinn – Vinstrihreyfingin – grænt framboð |
31 |
26 |
0% |
24–27 |
24–28 |
23–28 |
23–29 |
| Sjálfstæðisflokkurinn – Framsóknarflokkurinn |
29 |
23 |
0% |
21–24 |
21–24 |
20–25 |
20–26 |
| Sjálfstæðisflokkurinn – Miðflokkurinn |
21 |
22 |
0% |
21–24 |
20–24 |
20–25 |
19–25 |
| Sjálfstæðisflokkurinn – Samfylkingin |
24 |
23 |
0% |
21–24 |
21–25 |
20–25 |
20–26 |
| Sjálfstæðisflokkurinn – Viðreisn – Björt framtíð |
32 |
20 |
0% |
18–21 |
18–22 |
18–22 |
17–23 |
| Vinstrihreyfingin – grænt framboð – Samfylkingin |
13 |
20 |
0% |
18–21 |
18–21 |
18–22 |
17–22 |
| Sjálfstæðisflokkurinn – Viðreisn |
28 |
20 |
0% |
18–21 |
18–22 |
18–22 |
17–23 |
| Vinstrihreyfingin – grænt framboð – Framsóknarflokkurinn |
18 |
19 |
0% |
18–21 |
18–21 |
17–21 |
17–22 |
| Vinstrihreyfingin – grænt framboð – Miðflokkurinn |
10 |
19 |
0% |
18–20 |
17–21 |
17–21 |
16–22 |
| Vinstrihreyfingin – grænt framboð – Píratar |
20 |
19 |
0% |
17–20 |
17–20 |
17–21 |
16–21 |
| Sjálfstæðisflokkurinn – Björt framtíð |
25 |
14 |
0% |
13–16 |
13–16 |
13–17 |
12–17 |
Vinstrihreyfingin – grænt framboð – Samfylkingin – Framsóknarflokkurinn – Miðflokkurinn
| Number of Seats |
Probability |
Accumulated |
Special Marks |
| 21 |
0% |
100% |
Last Result |
| 22 |
0% |
100% |
|
| 23 |
0% |
100% |
|
| 24 |
0% |
100% |
|
| 25 |
0% |
100% |
|
| 26 |
0% |
100% |
|
| 27 |
0% |
100% |
|
| 28 |
0% |
100% |
|
| 29 |
0% |
100% |
|
| 30 |
0% |
100% |
|
| 31 |
0.2% |
100% |
|
| 32 |
1.0% |
99.8% |
Majority |
| 33 |
7% |
98.8% |
|
| 34 |
15% |
91% |
|
| 35 |
33% |
76% |
Median |
| 36 |
24% |
44% |
|
| 37 |
15% |
19% |
|
| 38 |
4% |
4% |
|
| 39 |
0.4% |
0.4% |
|
| 40 |
0% |
0% |
|
Vinstrihreyfingin – grænt framboð – Samfylkingin – Píratar – Viðreisn – Björt framtíð
| Number of Seats |
Probability |
Accumulated |
Special Marks |
| 28 |
0.3% |
100% |
|
| 29 |
2% |
99.7% |
|
| 30 |
8% |
97% |
|
| 31 |
19% |
89% |
Median |
| 32 |
32% |
70% |
Majority |
| 33 |
25% |
39% |
|
| 34 |
10% |
13% |
Last Result |
| 35 |
3% |
3% |
|
| 36 |
0.3% |
0.3% |
|
| 37 |
0% |
0% |
|
Vinstrihreyfingin – grænt framboð – Samfylkingin – Píratar – Viðreisn
| Number of Seats |
Probability |
Accumulated |
Special Marks |
| 28 |
0.3% |
100% |
|
| 29 |
2% |
99.7% |
|
| 30 |
8% |
97% |
Last Result |
| 31 |
19% |
89% |
Median |
| 32 |
32% |
70% |
Majority |
| 33 |
25% |
39% |
|
| 34 |
10% |
13% |
|
| 35 |
3% |
3% |
|
| 36 |
0.3% |
0.3% |
|
| 37 |
0% |
0% |
|
Sjálfstæðisflokkurinn – Framsóknarflokkurinn – Miðflokkurinn
| Number of Seats |
Probability |
Accumulated |
Special Marks |
| 26 |
0.2% |
100% |
|
| 27 |
1.3% |
99.8% |
|
| 28 |
7% |
98.5% |
|
| 29 |
18% |
92% |
Last Result |
| 30 |
30% |
73% |
Median |
| 31 |
30% |
43% |
|
| 32 |
11% |
13% |
Majority |
| 33 |
2% |
3% |
|
| 34 |
0.3% |
0.3% |
|
| 35 |
0% |
0% |
|
Vinstrihreyfingin – grænt framboð – Samfylkingin – Framsóknarflokkurinn
| Number of Seats |
Probability |
Accumulated |
Special Marks |
| 21 |
0% |
100% |
Last Result |
| 22 |
0% |
100% |
|
| 23 |
0.1% |
100% |
|
| 24 |
0.5% |
99.9% |
|
| 25 |
4% |
99.4% |
|
| 26 |
14% |
96% |
|
| 27 |
32% |
82% |
Median |
| 28 |
27% |
50% |
|
| 29 |
18% |
23% |
|
| 30 |
4% |
5% |
|
| 31 |
0.7% |
0.8% |
|
| 32 |
0.1% |
0.1% |
Majority |
| 33 |
0% |
0% |
|
Vinstrihreyfingin – grænt framboð – Samfylkingin – Miðflokkurinn
| Number of Seats |
Probability |
Accumulated |
Special Marks |
| 13 |
0% |
100% |
Last Result |
| 14 |
0% |
100% |
|
| 15 |
0% |
100% |
|
| 16 |
0% |
100% |
|
| 17 |
0% |
100% |
|
| 18 |
0% |
100% |
|
| 19 |
0% |
100% |
|
| 20 |
0% |
100% |
|
| 21 |
0% |
100% |
|
| 22 |
0% |
100% |
|
| 23 |
0.1% |
100% |
|
| 24 |
0.9% |
99.9% |
|
| 25 |
6% |
99.0% |
|
| 26 |
15% |
93% |
|
| 27 |
31% |
78% |
Median |
| 28 |
29% |
46% |
|
| 29 |
13% |
17% |
|
| 30 |
3% |
4% |
|
| 31 |
0.5% |
0.5% |
|
| 32 |
0% |
0% |
Majority |
Vinstrihreyfingin – grænt framboð – Samfylkingin – Píratar – Björt framtíð
| Number of Seats |
Probability |
Accumulated |
Special Marks |
| 23 |
0.3% |
100% |
|
| 24 |
2% |
99.7% |
|
| 25 |
9% |
98% |
|
| 26 |
26% |
88% |
Median |
| 27 |
30% |
62% |
Last Result |
| 28 |
23% |
32% |
|
| 29 |
7% |
9% |
|
| 30 |
2% |
2% |
|
| 31 |
0.1% |
0.1% |
|
| 32 |
0% |
0% |
Majority |
Vinstrihreyfingin – grænt framboð – Framsóknarflokkurinn – Miðflokkurinn
| Number of Seats |
Probability |
Accumulated |
Special Marks |
| 18 |
0% |
100% |
Last Result |
| 19 |
0% |
100% |
|
| 20 |
0% |
100% |
|
| 21 |
0% |
100% |
|
| 22 |
0% |
100% |
|
| 23 |
0.2% |
100% |
|
| 24 |
0.9% |
99.8% |
|
| 25 |
8% |
98.9% |
|
| 26 |
26% |
91% |
|
| 27 |
32% |
65% |
Median |
| 28 |
20% |
33% |
|
| 29 |
11% |
13% |
|
| 30 |
1.5% |
2% |
|
| 31 |
0.1% |
0.1% |
|
| 32 |
0% |
0% |
Majority |
Vinstrihreyfingin – grænt framboð – Samfylkingin – Píratar
| Number of Seats |
Probability |
Accumulated |
Special Marks |
| 23 |
0.3% |
100% |
Last Result |
| 24 |
2% |
99.7% |
|
| 25 |
9% |
98% |
|
| 26 |
26% |
88% |
Median |
| 27 |
30% |
62% |
|
| 28 |
23% |
32% |
|
| 29 |
7% |
9% |
|
| 30 |
2% |
2% |
|
| 31 |
0.1% |
0.1% |
|
| 32 |
0% |
0% |
Majority |
Sjálfstæðisflokkurinn – Vinstrihreyfingin – grænt framboð
| Number of Seats |
Probability |
Accumulated |
Special Marks |
| 22 |
0.2% |
100% |
|
| 23 |
3% |
99.8% |
|
| 24 |
10% |
97% |
|
| 25 |
25% |
87% |
Median |
| 26 |
37% |
62% |
|
| 27 |
17% |
25% |
|
| 28 |
6% |
7% |
|
| 29 |
1.3% |
1.4% |
|
| 30 |
0.1% |
0.1% |
|
| 31 |
0% |
0% |
Last Result |
Sjálfstæðisflokkurinn – Framsóknarflokkurinn
| Number of Seats |
Probability |
Accumulated |
Special Marks |
| 19 |
0.5% |
100% |
|
| 20 |
4% |
99.5% |
|
| 21 |
15% |
95% |
|
| 22 |
29% |
80% |
Median |
| 23 |
37% |
51% |
|
| 24 |
10% |
14% |
|
| 25 |
3% |
4% |
|
| 26 |
0.4% |
0.5% |
|
| 27 |
0.1% |
0.1% |
|
| 28 |
0% |
0% |
|
| 29 |
0% |
0% |
Last Result |
Sjálfstæðisflokkurinn – Miðflokkurinn
| Number of Seats |
Probability |
Accumulated |
Special Marks |
| 18 |
0.1% |
100% |
|
| 19 |
1.0% |
99.9% |
|
| 20 |
6% |
98.9% |
|
| 21 |
18% |
93% |
Last Result |
| 22 |
32% |
76% |
Median |
| 23 |
31% |
44% |
|
| 24 |
10% |
13% |
|
| 25 |
2% |
3% |
|
| 26 |
0.3% |
0.3% |
|
| 27 |
0% |
0% |
|
Sjálfstæðisflokkurinn – Samfylkingin
| Number of Seats |
Probability |
Accumulated |
Special Marks |
| 19 |
0.1% |
100% |
|
| 20 |
3% |
99.9% |
|
| 21 |
11% |
97% |
|
| 22 |
26% |
86% |
Median |
| 23 |
31% |
60% |
|
| 24 |
20% |
28% |
Last Result |
| 25 |
7% |
8% |
|
| 26 |
1.2% |
1.3% |
|
| 27 |
0.1% |
0.1% |
|
| 28 |
0% |
0% |
|
Sjálfstæðisflokkurinn – Viðreisn – Björt framtíð
| Number of Seats |
Probability |
Accumulated |
Special Marks |
| 16 |
0.1% |
100% |
|
| 17 |
2% |
99.9% |
|
| 18 |
13% |
98% |
|
| 19 |
28% |
84% |
Median |
| 20 |
32% |
56% |
|
| 21 |
18% |
24% |
|
| 22 |
5% |
6% |
|
| 23 |
1.1% |
1.2% |
|
| 24 |
0.1% |
0.1% |
|
| 25 |
0% |
0% |
|
| 26 |
0% |
0% |
|
| 27 |
0% |
0% |
|
| 28 |
0% |
0% |
|
| 29 |
0% |
0% |
|
| 30 |
0% |
0% |
|
| 31 |
0% |
0% |
|
| 32 |
0% |
0% |
Last Result, Majority |
Vinstrihreyfingin – grænt framboð – Samfylkingin
| Number of Seats |
Probability |
Accumulated |
Special Marks |
| 13 |
0% |
100% |
Last Result |
| 14 |
0% |
100% |
|
| 15 |
0% |
100% |
|
| 16 |
0.2% |
100% |
|
| 17 |
2% |
99.8% |
|
| 18 |
13% |
98% |
|
| 19 |
32% |
85% |
Median |
| 20 |
33% |
53% |
|
| 21 |
15% |
20% |
|
| 22 |
4% |
4% |
|
| 23 |
0.4% |
0.5% |
|
| 24 |
0% |
0% |
|
Sjálfstæðisflokkurinn – Viðreisn
| Number of Seats |
Probability |
Accumulated |
Special Marks |
| 16 |
0.1% |
100% |
|
| 17 |
2% |
99.9% |
|
| 18 |
13% |
98% |
|
| 19 |
28% |
84% |
Median |
| 20 |
32% |
56% |
|
| 21 |
18% |
24% |
|
| 22 |
5% |
6% |
|
| 23 |
1.1% |
1.2% |
|
| 24 |
0.1% |
0.1% |
|
| 25 |
0% |
0% |
|
| 26 |
0% |
0% |
|
| 27 |
0% |
0% |
|
| 28 |
0% |
0% |
Last Result |
Vinstrihreyfingin – grænt framboð – Framsóknarflokkurinn
| Number of Seats |
Probability |
Accumulated |
Special Marks |
| 16 |
0.4% |
100% |
|
| 17 |
3% |
99.5% |
|
| 18 |
19% |
97% |
Last Result |
| 19 |
42% |
78% |
Median |
| 20 |
22% |
36% |
|
| 21 |
12% |
14% |
|
| 22 |
2% |
2% |
|
| 23 |
0.1% |
0.1% |
|
| 24 |
0% |
0% |
|
Vinstrihreyfingin – grænt framboð – Miðflokkurinn
| Number of Seats |
Probability |
Accumulated |
Special Marks |
| 10 |
0% |
100% |
Last Result |
| 11 |
0% |
100% |
|
| 12 |
0% |
100% |
|
| 13 |
0% |
100% |
|
| 14 |
0% |
100% |
|
| 15 |
0.1% |
100% |
|
| 16 |
0.7% |
99.9% |
|
| 17 |
7% |
99.2% |
|
| 18 |
19% |
93% |
|
| 19 |
40% |
73% |
Median |
| 20 |
24% |
33% |
|
| 21 |
7% |
9% |
|
| 22 |
1.1% |
1.2% |
|
| 23 |
0.1% |
0.1% |
|
| 24 |
0% |
0% |
|
Vinstrihreyfingin – grænt framboð – Píratar
| Number of Seats |
Probability |
Accumulated |
Special Marks |
| 15 |
0.2% |
100% |
|
| 16 |
1.3% |
99.8% |
|
| 17 |
11% |
98.5% |
|
| 18 |
37% |
88% |
Median |
| 19 |
32% |
51% |
|
| 20 |
15% |
19% |
Last Result |
| 21 |
3% |
4% |
|
| 22 |
0.4% |
0.4% |
|
| 23 |
0% |
0% |
|
Sjálfstæðisflokkurinn – Björt framtíð
| Number of Seats |
Probability |
Accumulated |
Special Marks |
| 12 |
2% |
100% |
|
| 13 |
13% |
98% |
|
| 14 |
35% |
85% |
Median |
| 15 |
37% |
50% |
|
| 16 |
10% |
13% |
|
| 17 |
3% |
3% |
|
| 18 |
0.3% |
0.3% |
|
| 19 |
0% |
0% |
|
| 20 |
0% |
0% |
|
| 21 |
0% |
0% |
|
| 22 |
0% |
0% |
|
| 23 |
0% |
0% |
|
| 24 |
0% |
0% |
|
| 25 |
0% |
0% |
Last Result |
Opinion Poll
- Polling firm: MMR
- Commissioner(s): —
- Fieldwork period: 26–27 October 2017
Calculations
- Sample size: 980
- Simulations done: 8,388,608
- Error estimate: 1.87%


