Opinion Poll by Gallup, 7–31 January 2019
Voting Intentions | Seats | Coalitions | Technical Information
Voting Intentions
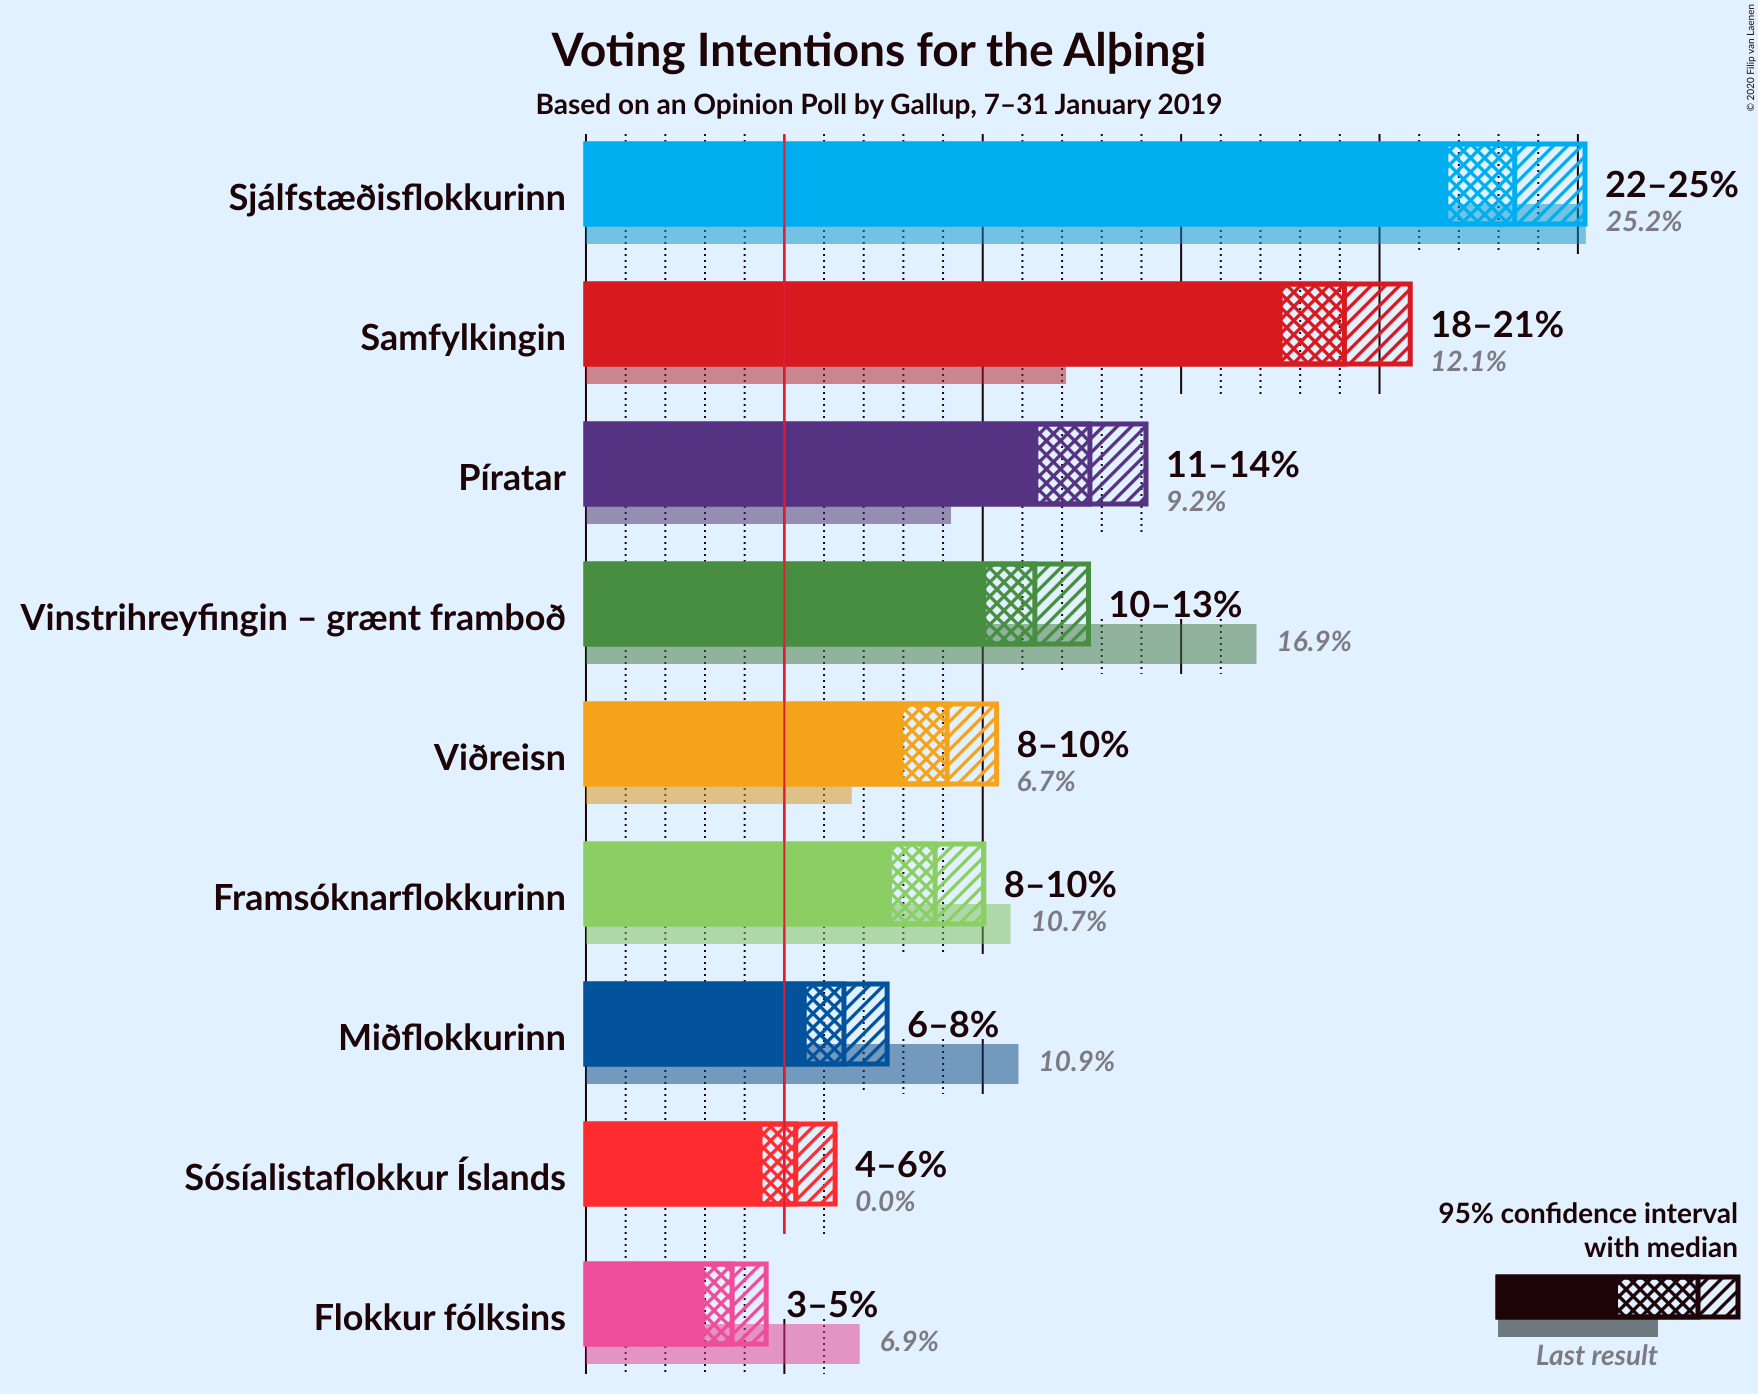
Confidence Intervals
| Party | Last Result | Poll Result | 80% Confidence Interval | 90% Confidence Interval | 95% Confidence Interval | 99% Confidence Interval |
|---|---|---|---|---|---|---|
| Sjálfstæðisflokkurinn | 25.2% | 23.4% | 22.3–24.6% | 22.0–24.9% | 21.7–25.2% | 21.2–25.7% |
| Samfylkingin | 12.1% | 19.1% | 18.1–20.2% | 17.8–20.5% | 17.6–20.8% | 17.1–21.3% |
| Píratar | 9.2% | 12.7% | 11.8–13.6% | 11.6–13.9% | 11.4–14.1% | 11.0–14.6% |
| Vinstrihreyfingin – grænt framboð | 16.9% | 11.3% | 10.5–12.2% | 10.3–12.5% | 10.1–12.7% | 9.7–13.1% |
| Viðreisn | 6.7% | 9.1% | 8.4–9.9% | 8.2–10.2% | 8.0–10.3% | 7.7–10.7% |
| Framsóknarflokkurinn | 10.7% | 8.8% | 8.1–9.6% | 7.9–9.8% | 7.7–10.0% | 7.4–10.4% |
| Miðflokkurinn | 10.9% | 6.5% | 5.9–7.2% | 5.7–7.4% | 5.6–7.6% | 5.3–7.9% |
| Sósíalistaflokkur Íslands | 0.0% | 5.3% | 4.7–5.9% | 4.6–6.1% | 4.5–6.3% | 4.2–6.6% |
| Flokkur fólksins | 6.9% | 3.7% | 3.2–4.2% | 3.1–4.4% | 3.0–4.5% | 2.8–4.8% |
Note: The poll result column reflects the actual value used in the calculations. Published results may vary slightly, and in addition be rounded to fewer digits.
Seats
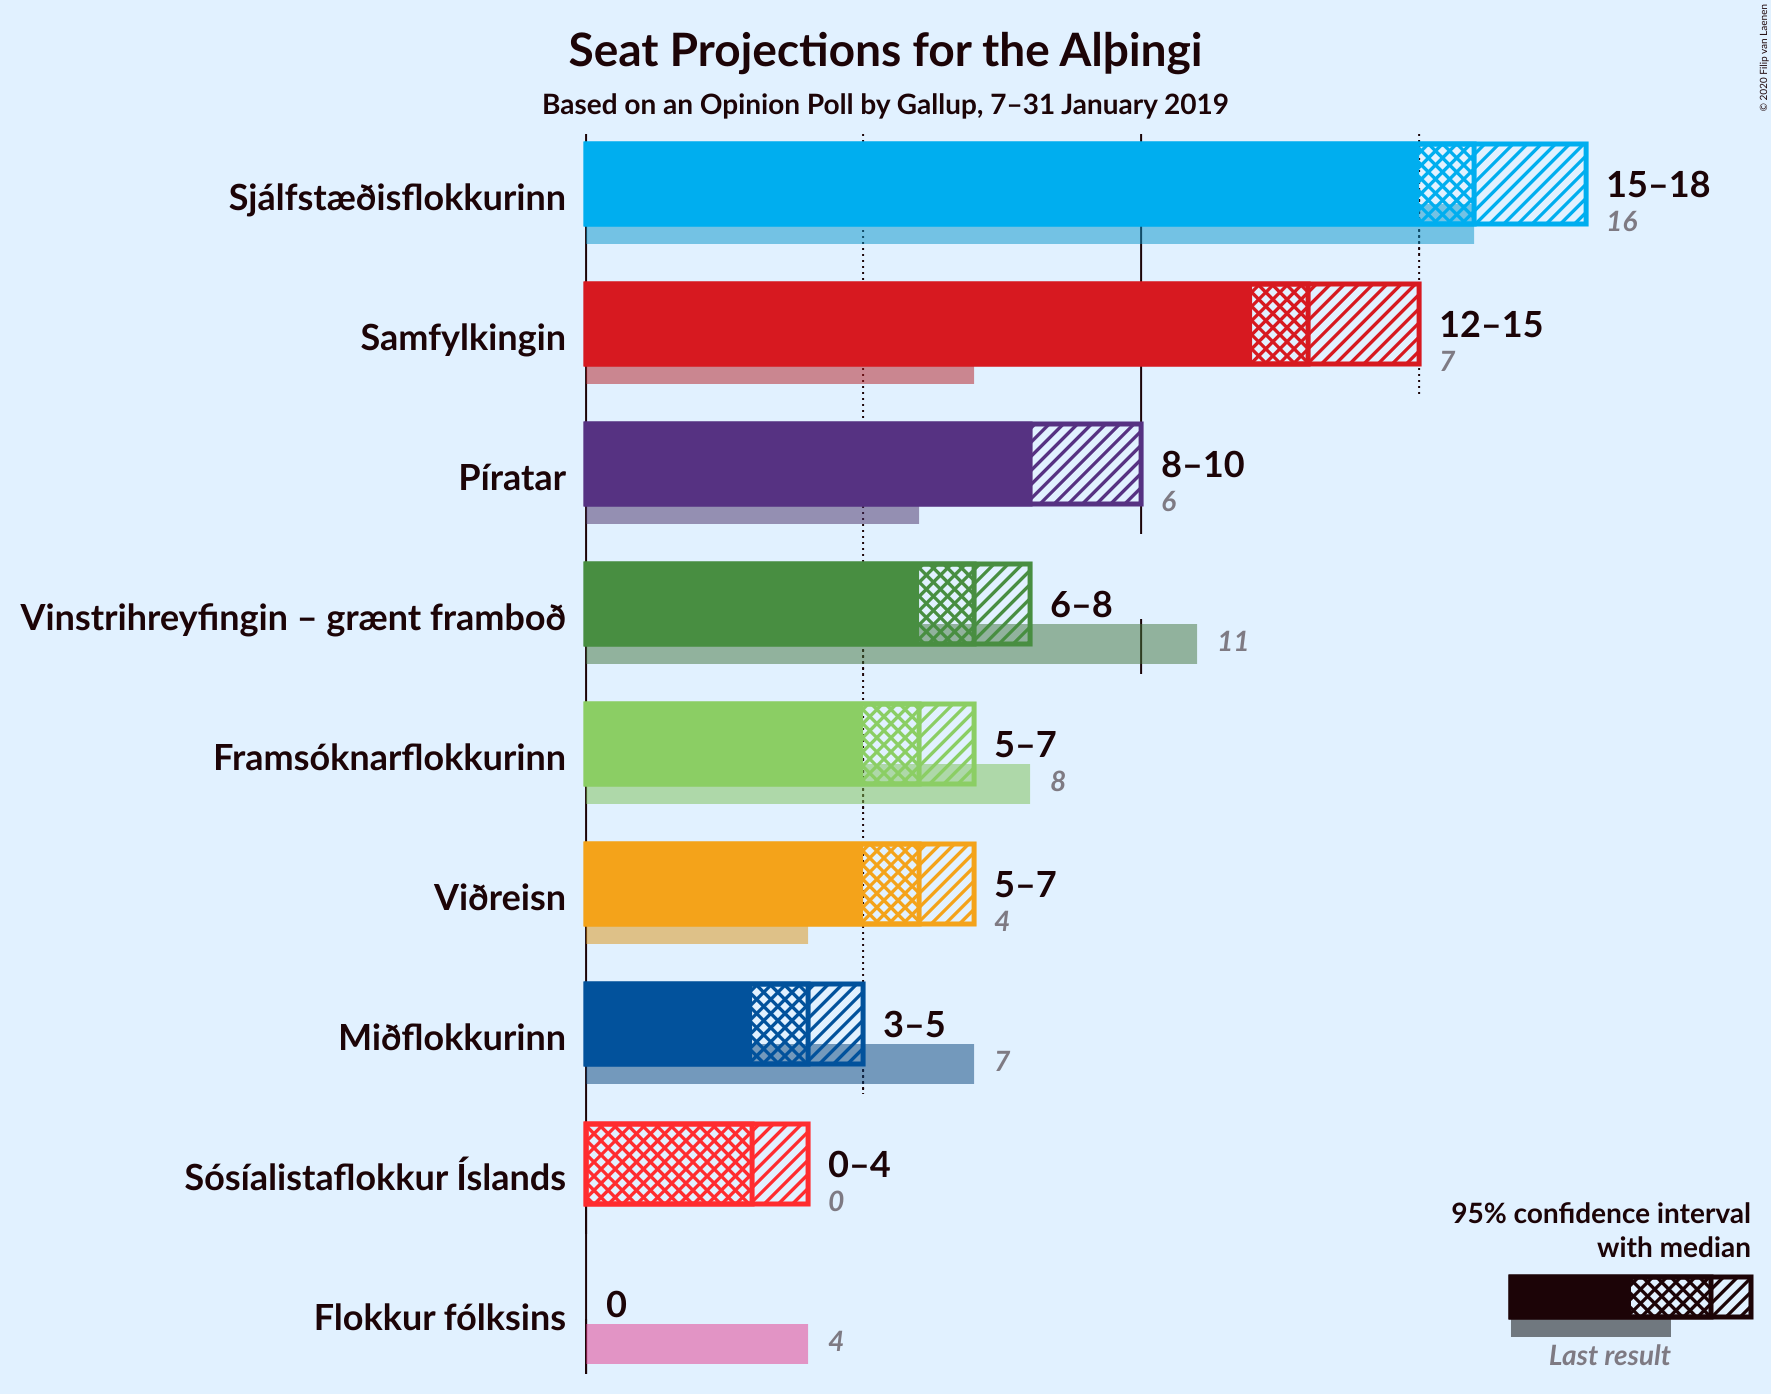
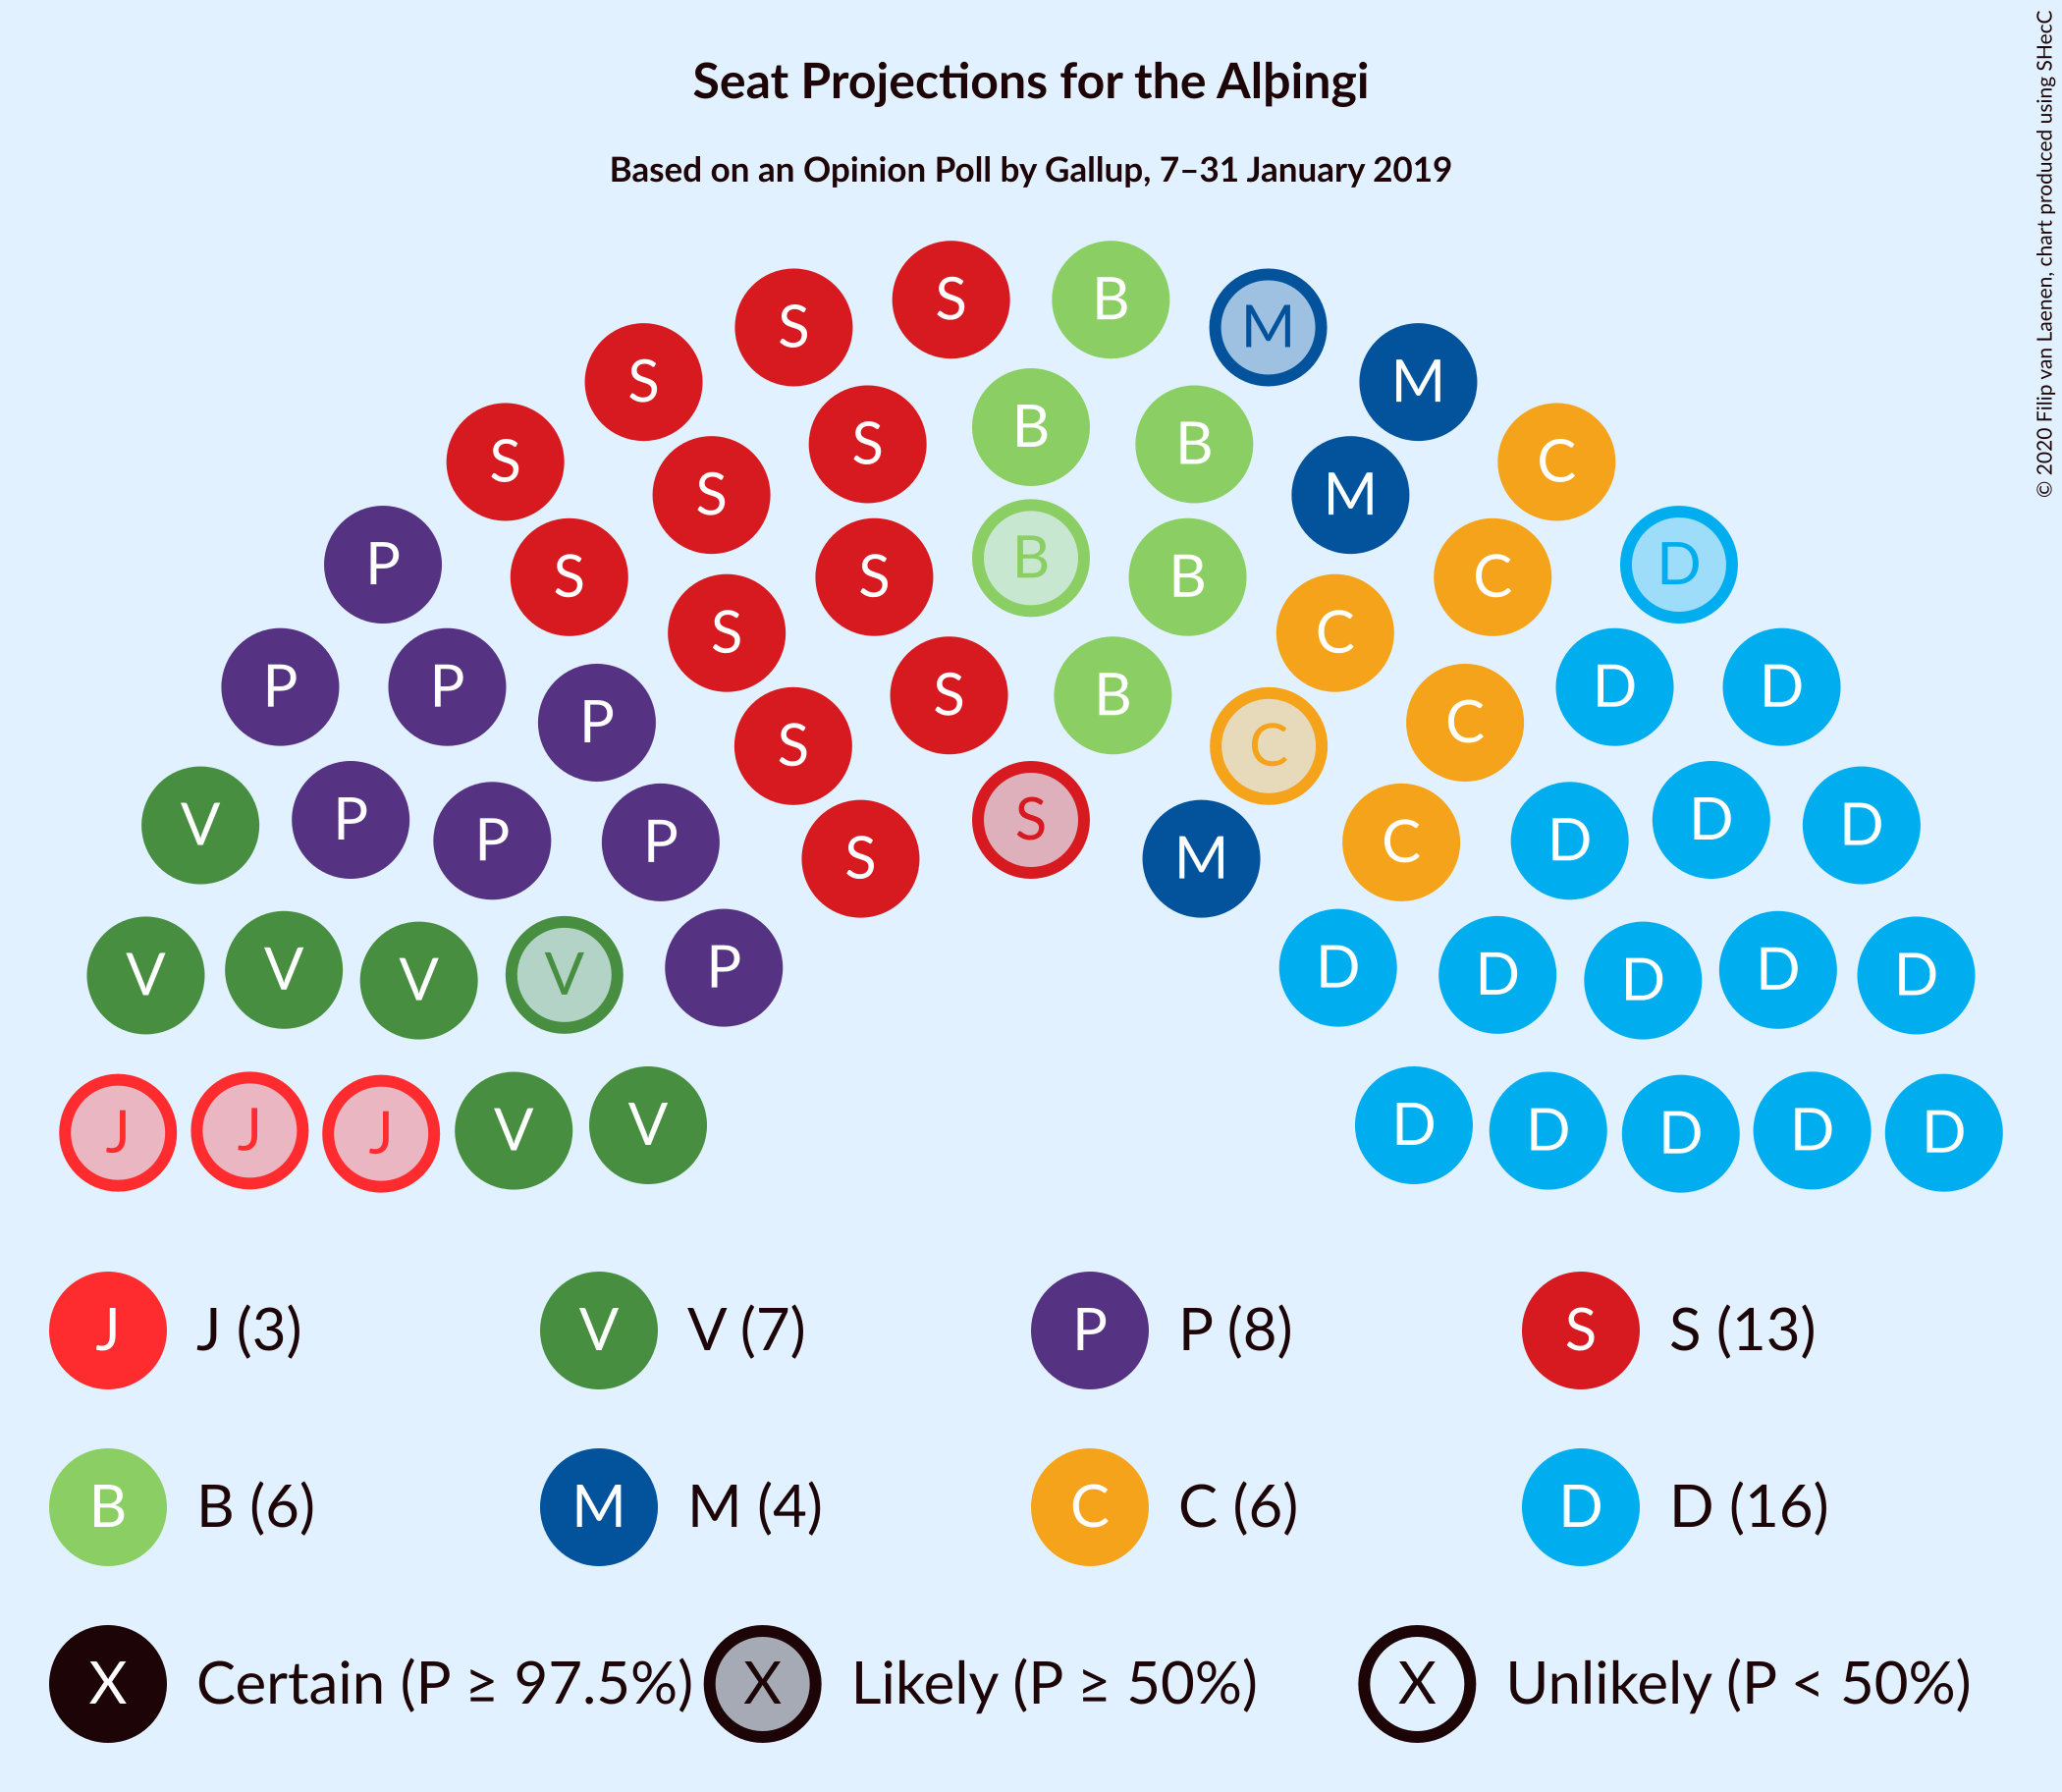
Confidence Intervals
| Party | Last Result | Median | 80% Confidence Interval | 90% Confidence Interval | 95% Confidence Interval | 99% Confidence Interval |
|---|---|---|---|---|---|---|
| Sjálfstæðisflokkurinn | 16 | 16 | 15–18 | 15–18 | 15–18 | 14–19 |
| Samfylkingin | 7 | 13 | 12–14 | 12–14 | 12–15 | 11–16 |
| Píratar | 6 | 8 | 8–10 | 8–10 | 8–10 | 7–10 |
| Vinstrihreyfingin – grænt framboð | 11 | 7 | 7–8 | 7–8 | 6–8 | 6–9 |
| Viðreisn | 4 | 6 | 5–6 | 5–7 | 5–7 | 5–7 |
| Framsóknarflokkurinn | 8 | 6 | 5–6 | 5–6 | 5–7 | 5–7 |
| Miðflokkurinn | 7 | 4 | 4 | 4 | 3–5 | 3–5 |
| Sósíalistaflokkur Íslands | 0 | 3 | 0–4 | 0–4 | 0–4 | 0–4 |
| Flokkur fólksins | 4 | 0 | 0 | 0 | 0 | 0 |
Sjálfstæðisflokkurinn
For a full overview of the results for this party, see the Sjálfstæðisflokkurinn page.
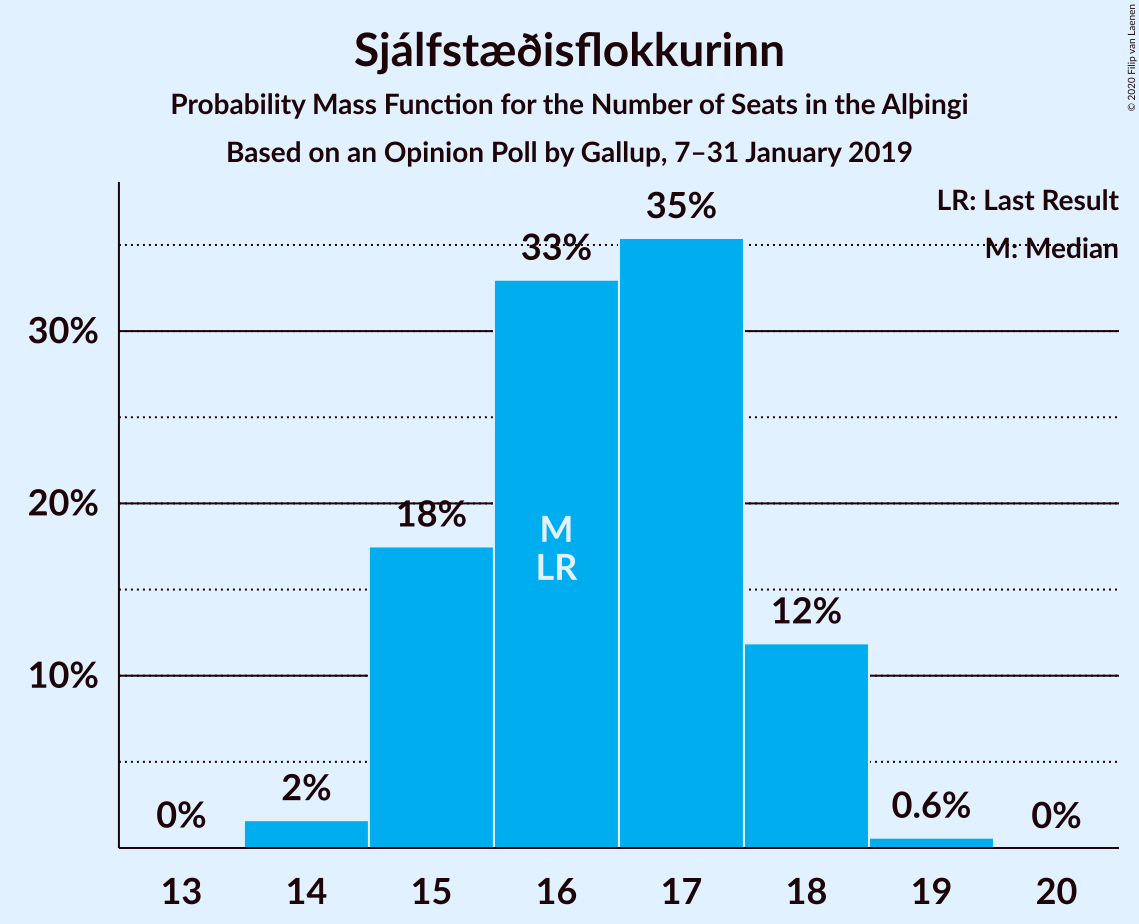
| Number of Seats | Probability | Accumulated | Special Marks |
|---|---|---|---|
| 14 | 2% | 100% | |
| 15 | 18% | 98% | |
| 16 | 33% | 81% | Last Result, Median |
| 17 | 35% | 48% | |
| 18 | 12% | 12% | |
| 19 | 0.6% | 0.6% | |
| 20 | 0% | 0% |
Samfylkingin
For a full overview of the results for this party, see the Samfylkingin page.
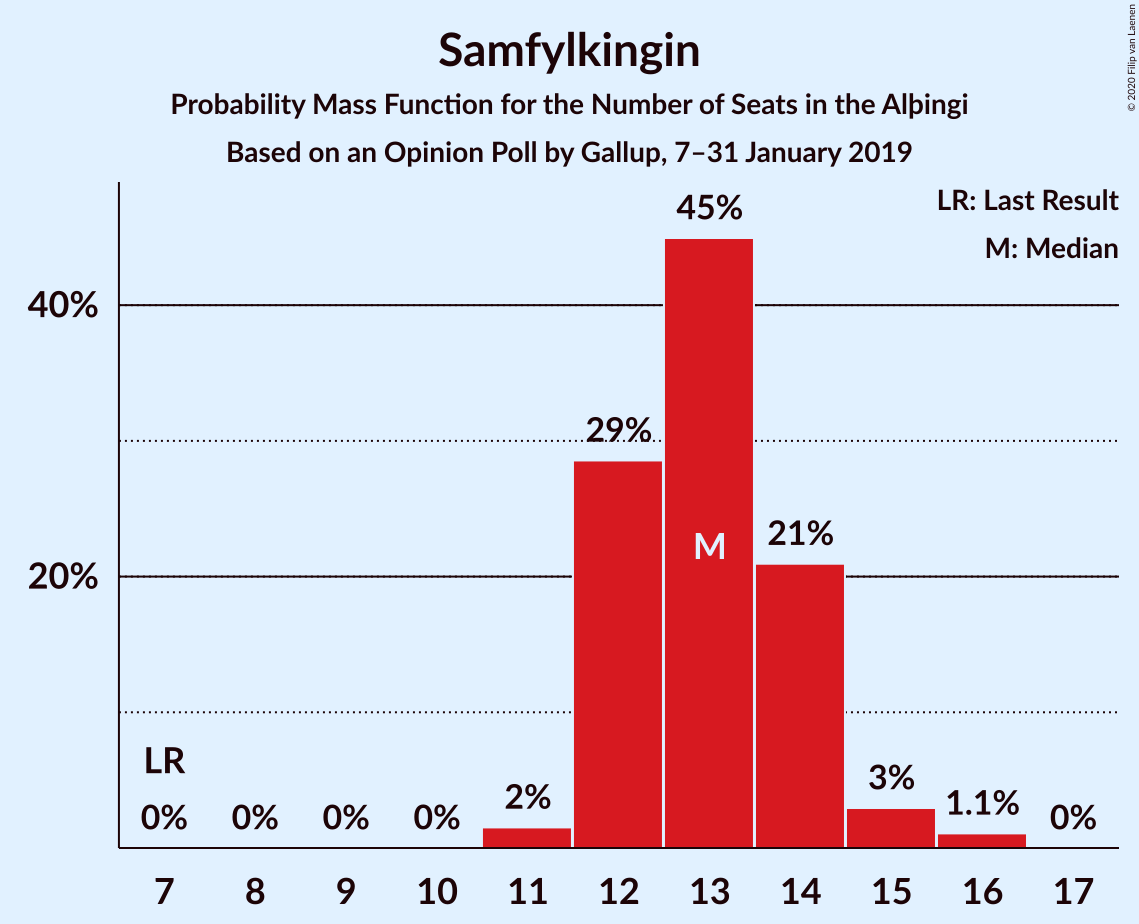
| Number of Seats | Probability | Accumulated | Special Marks |
|---|---|---|---|
| 7 | 0% | 100% | Last Result |
| 8 | 0% | 100% | |
| 9 | 0% | 100% | |
| 10 | 0% | 100% | |
| 11 | 2% | 100% | |
| 12 | 29% | 98% | |
| 13 | 45% | 70% | Median |
| 14 | 21% | 25% | |
| 15 | 3% | 4% | |
| 16 | 1.1% | 1.1% | |
| 17 | 0% | 0% |
Píratar
For a full overview of the results for this party, see the Píratar page.
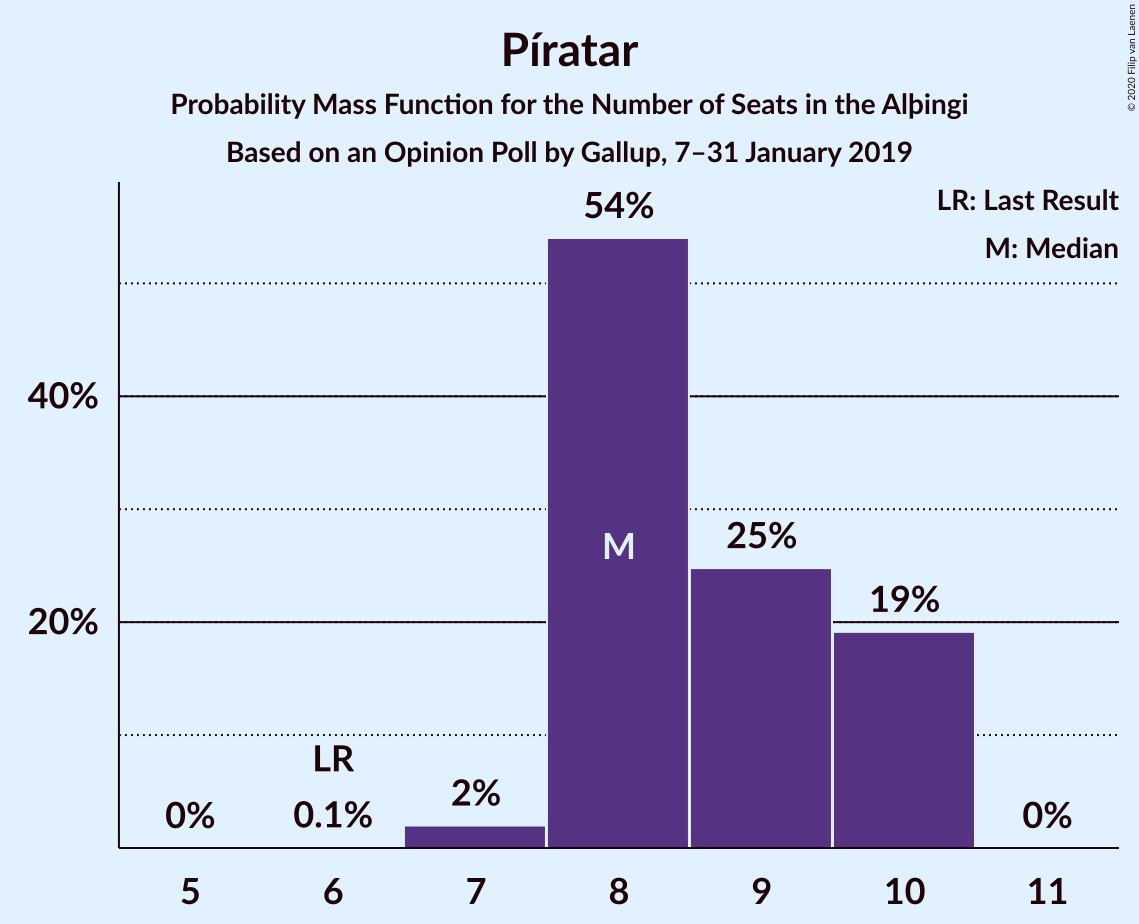
| Number of Seats | Probability | Accumulated | Special Marks |
|---|---|---|---|
| 6 | 0.1% | 100% | Last Result |
| 7 | 2% | 99.9% | |
| 8 | 54% | 98% | Median |
| 9 | 25% | 44% | |
| 10 | 19% | 19% | |
| 11 | 0% | 0% |
Vinstrihreyfingin – grænt framboð
For a full overview of the results for this party, see the Vinstrihreyfingin – grænt framboð page.
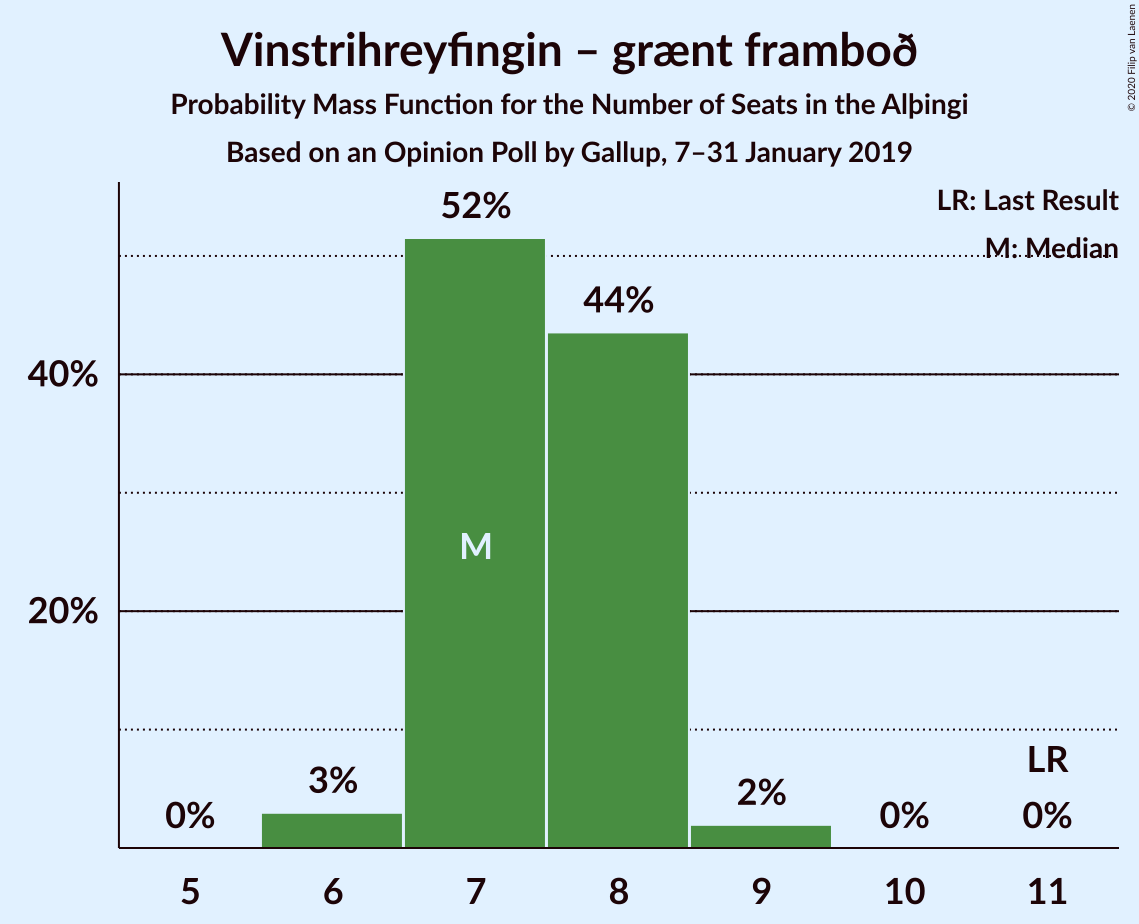
| Number of Seats | Probability | Accumulated | Special Marks |
|---|---|---|---|
| 6 | 3% | 100% | |
| 7 | 52% | 97% | Median |
| 8 | 44% | 46% | |
| 9 | 2% | 2% | |
| 10 | 0% | 0% | |
| 11 | 0% | 0% | Last Result |
Viðreisn
For a full overview of the results for this party, see the Viðreisn page.
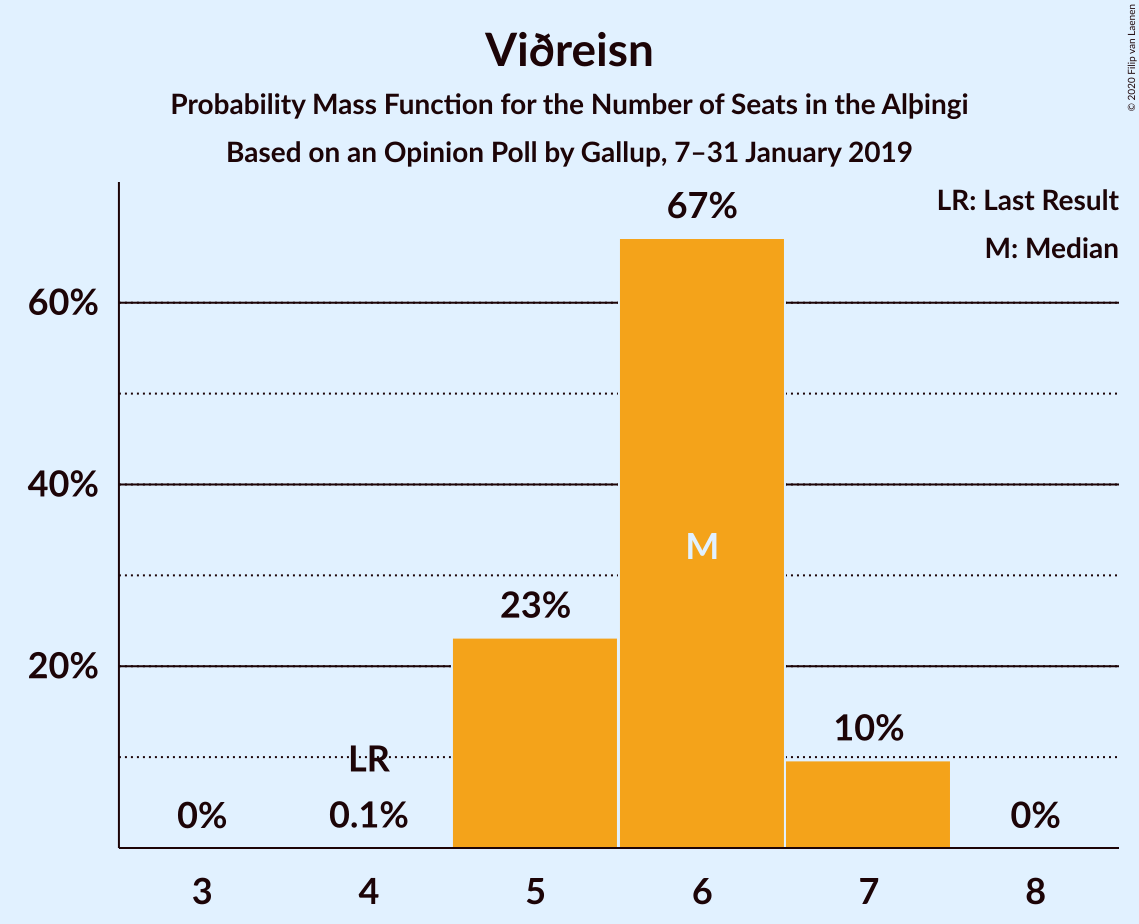
| Number of Seats | Probability | Accumulated | Special Marks |
|---|---|---|---|
| 4 | 0.1% | 100% | Last Result |
| 5 | 23% | 99.9% | |
| 6 | 67% | 77% | Median |
| 7 | 10% | 10% | |
| 8 | 0% | 0% |
Framsóknarflokkurinn
For a full overview of the results for this party, see the Framsóknarflokkurinn page.
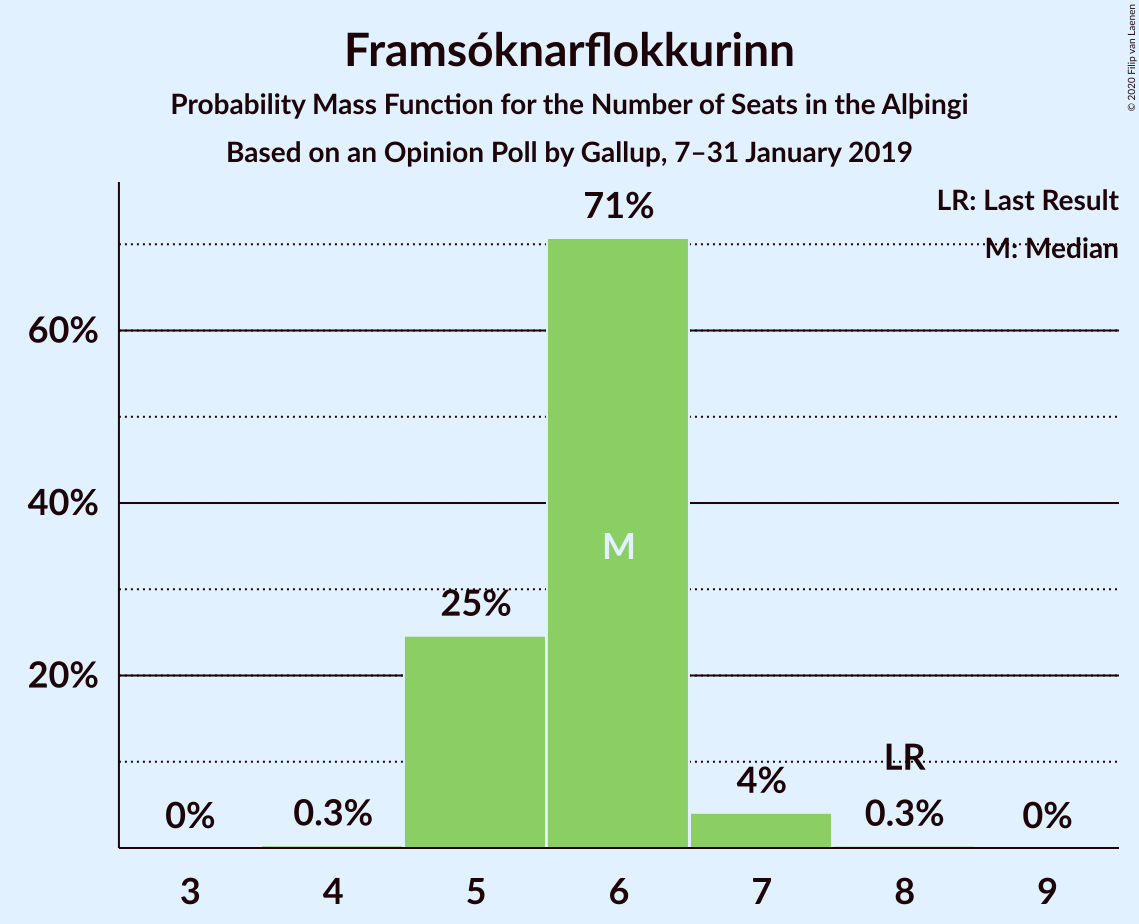
| Number of Seats | Probability | Accumulated | Special Marks |
|---|---|---|---|
| 4 | 0.3% | 100% | |
| 5 | 25% | 99.7% | |
| 6 | 71% | 75% | Median |
| 7 | 4% | 4% | |
| 8 | 0.3% | 0.3% | Last Result |
| 9 | 0% | 0% |
Miðflokkurinn
For a full overview of the results for this party, see the Miðflokkurinn page.
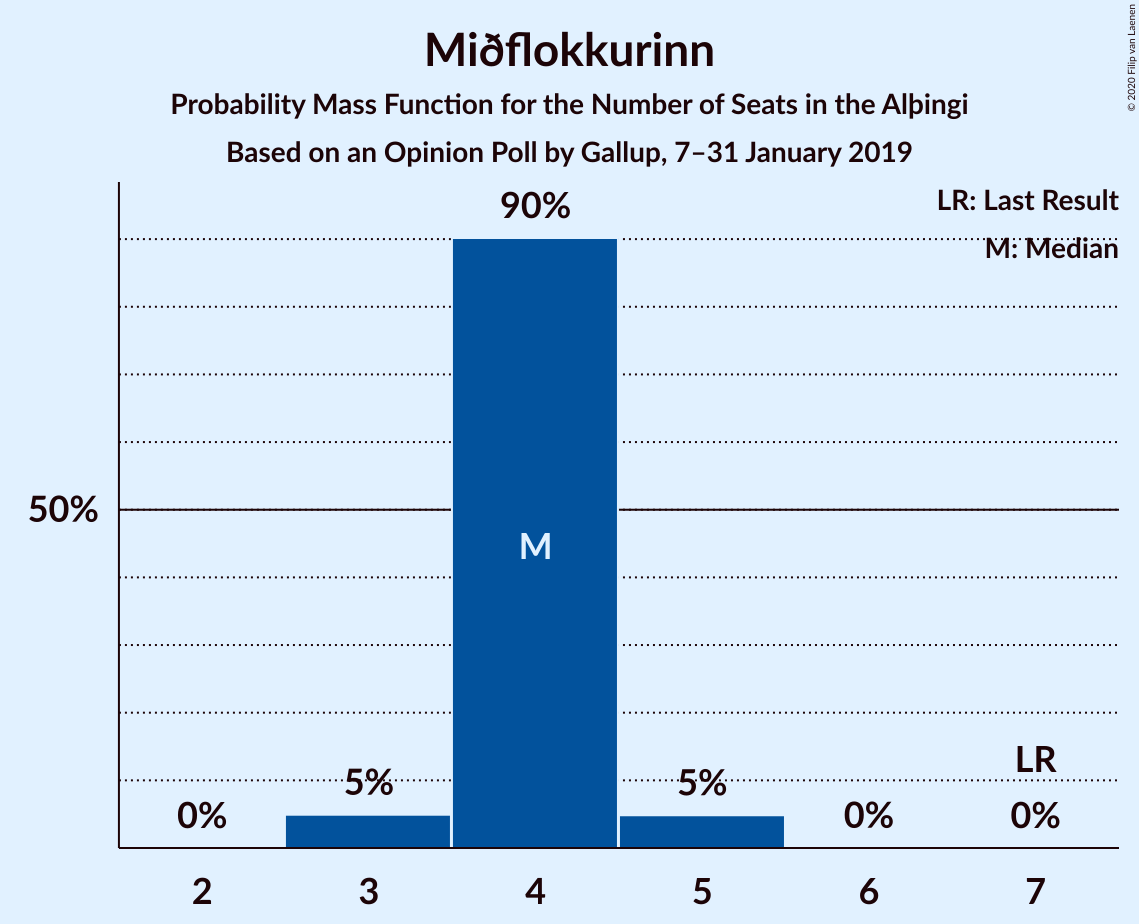
| Number of Seats | Probability | Accumulated | Special Marks |
|---|---|---|---|
| 3 | 5% | 100% | |
| 4 | 90% | 95% | Median |
| 5 | 5% | 5% | |
| 6 | 0% | 0% | |
| 7 | 0% | 0% | Last Result |
Sósíalistaflokkur Íslands
For a full overview of the results for this party, see the Sósíalistaflokkur Íslands page.
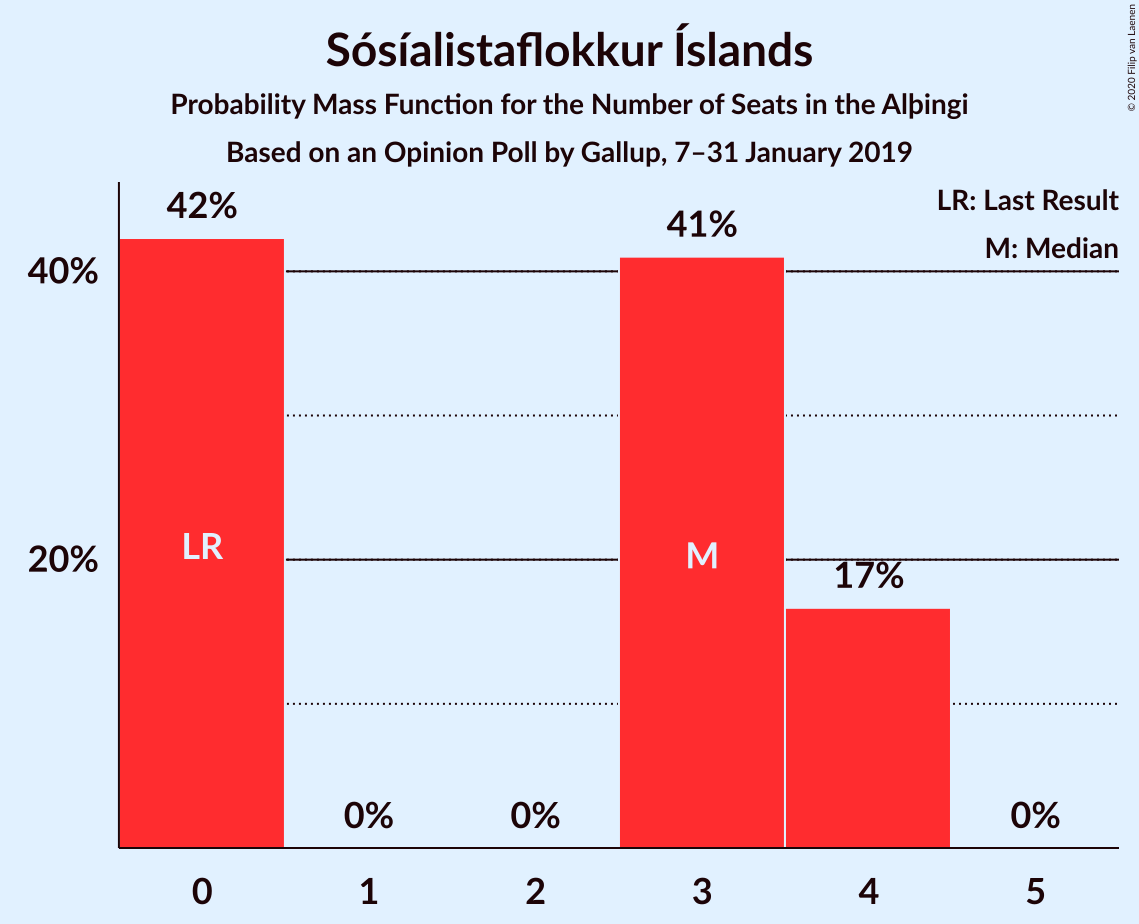
| Number of Seats | Probability | Accumulated | Special Marks |
|---|---|---|---|
| 0 | 42% | 100% | Last Result |
| 1 | 0% | 58% | |
| 2 | 0% | 58% | |
| 3 | 41% | 58% | Median |
| 4 | 17% | 17% | |
| 5 | 0% | 0% |
Flokkur fólksins
For a full overview of the results for this party, see the Flokkur fólksins page.
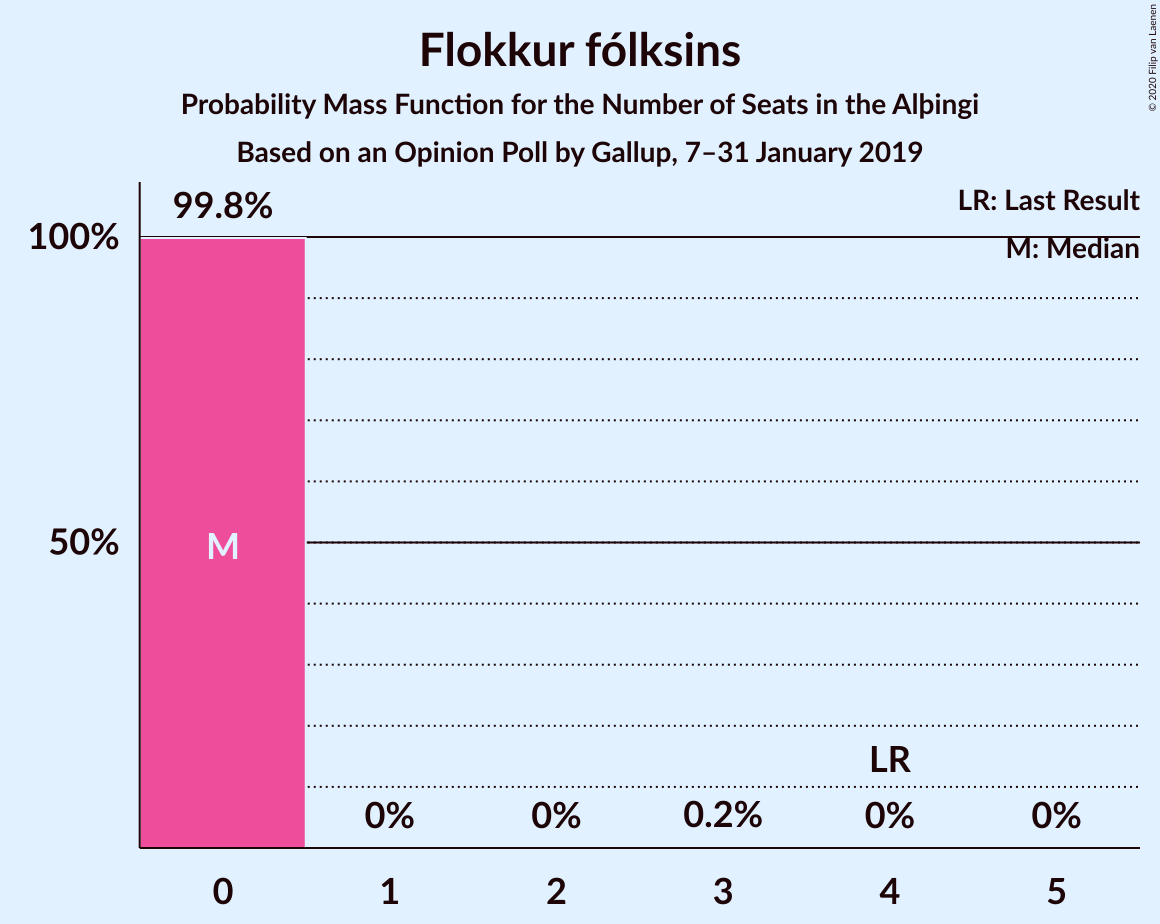
| Number of Seats | Probability | Accumulated | Special Marks |
|---|---|---|---|
| 0 | 99.8% | 100% | Median |
| 1 | 0% | 0.2% | |
| 2 | 0% | 0.2% | |
| 3 | 0.2% | 0.2% | |
| 4 | 0% | 0% | Last Result |
Coalitions
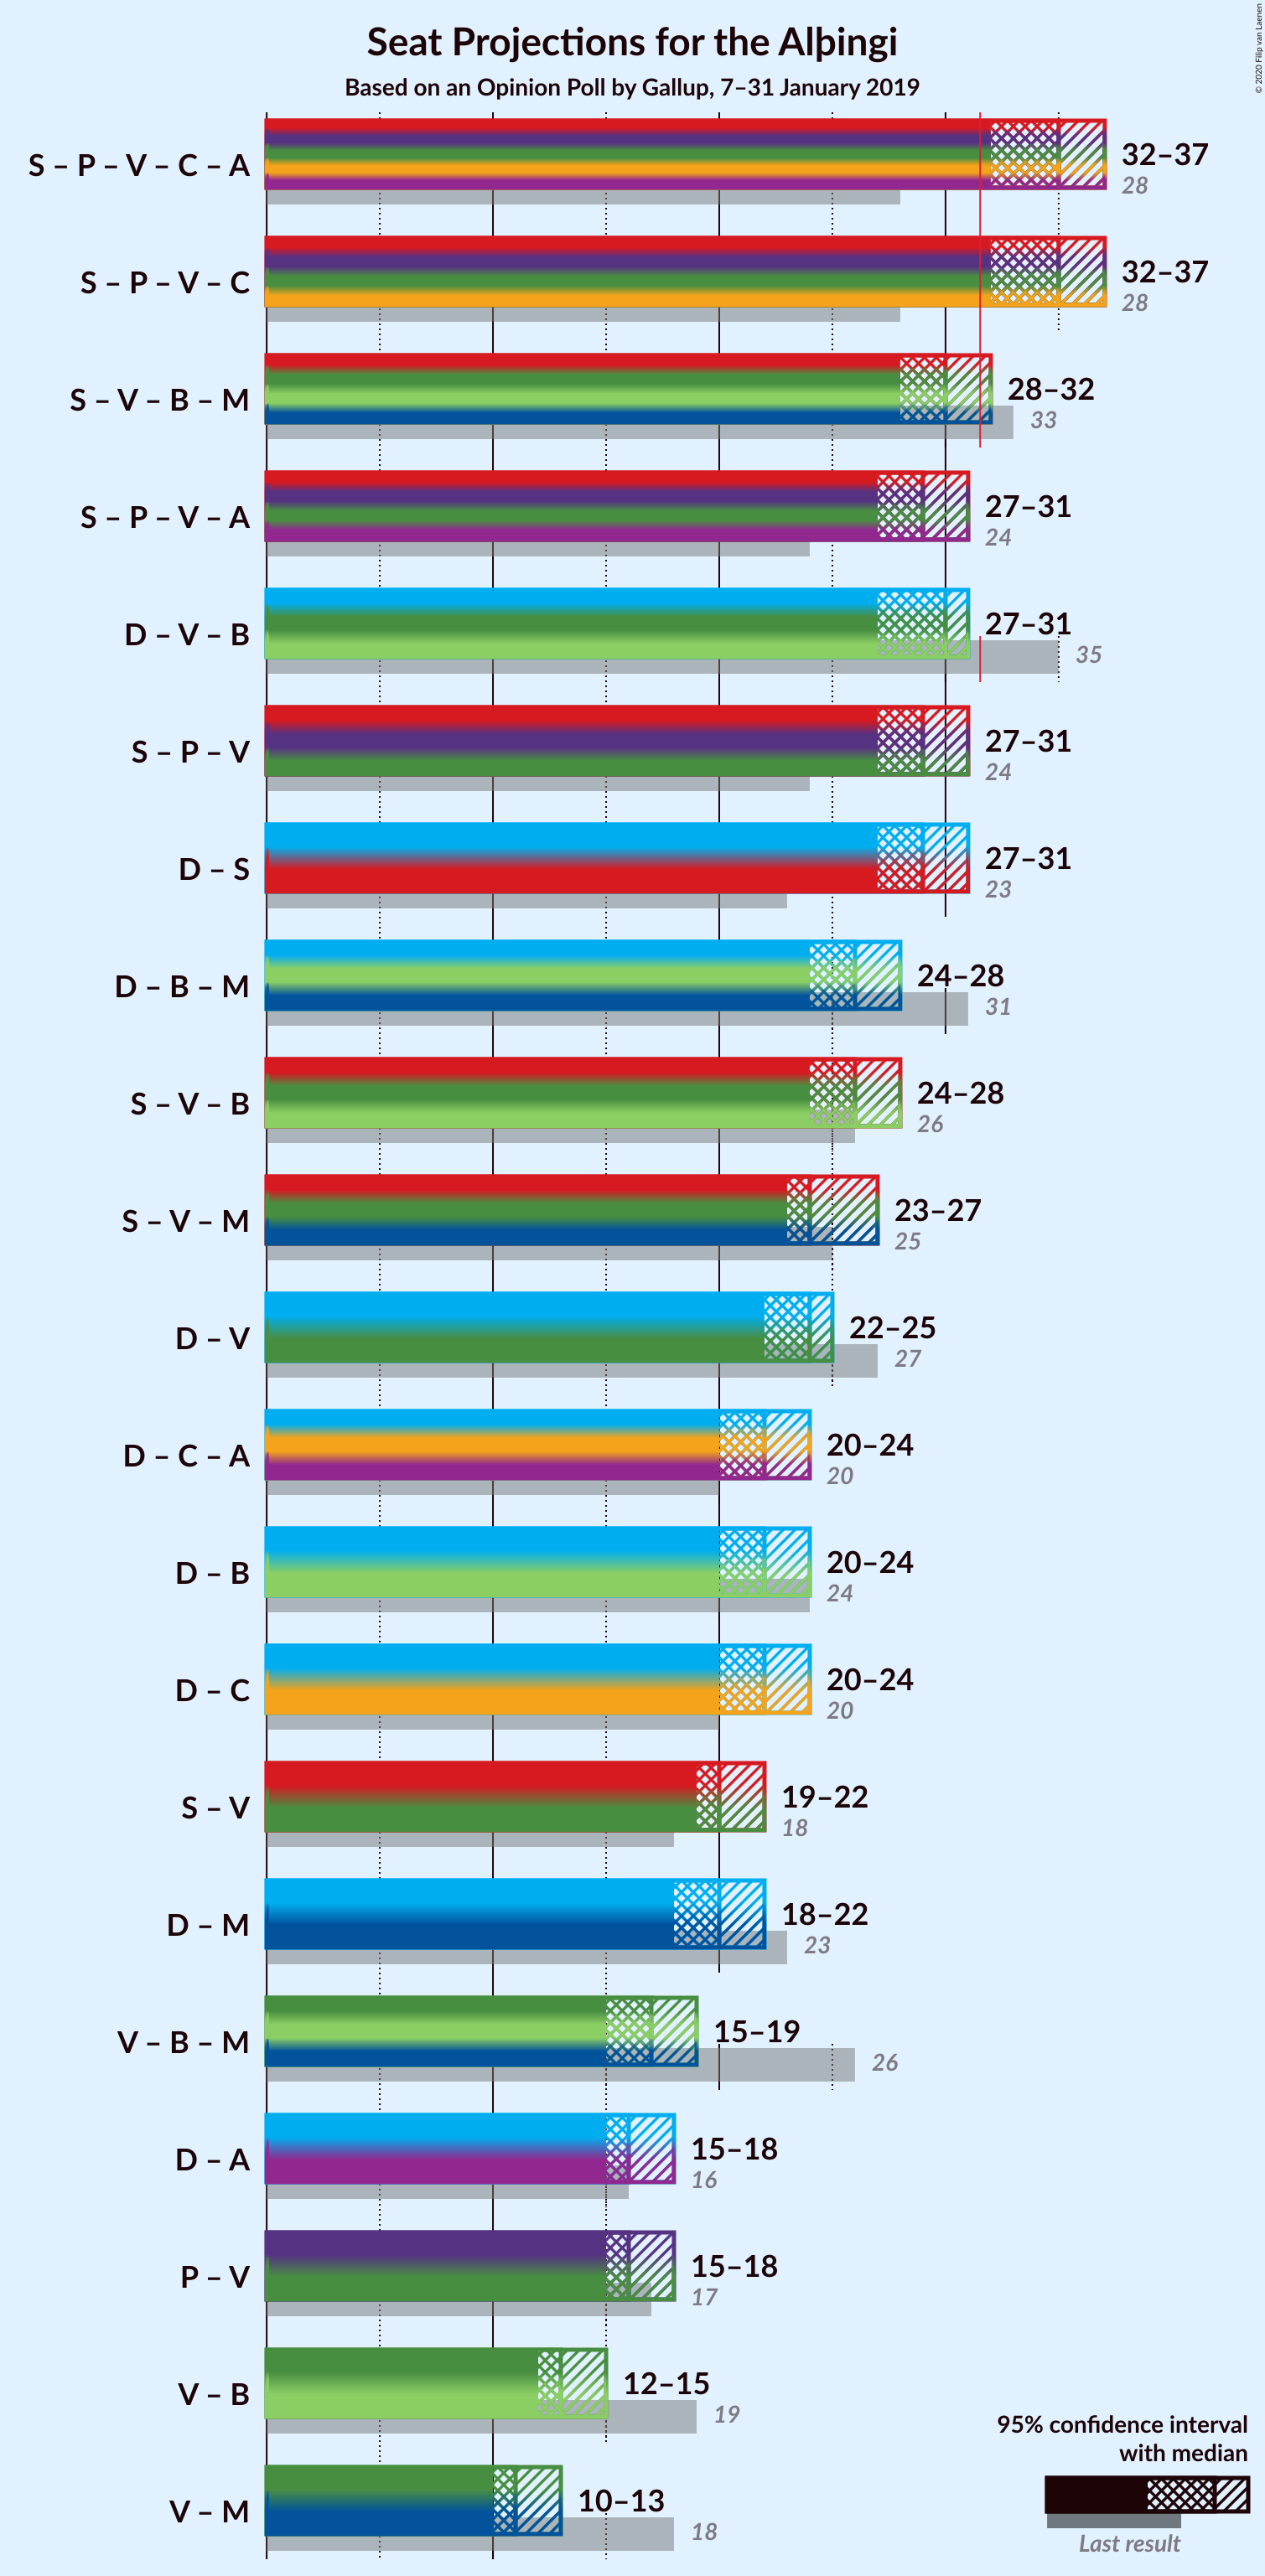
Confidence Intervals
| Coalition | Last Result | Median | Majority? | 80% Confidence Interval | 90% Confidence Interval | 95% Confidence Interval | 99% Confidence Interval |
|---|---|---|---|---|---|---|---|
| Samfylkingin – Píratar – Vinstrihreyfingin – grænt framboð – Viðreisn | 28 | 35 | 99.9% | 33–37 | 33–37 | 32–37 | 32–38 |
| Samfylkingin – Vinstrihreyfingin – grænt framboð – Framsóknarflokkurinn – Miðflokkurinn | 33 | 30 | 9% | 29–31 | 29–32 | 28–32 | 27–33 |
| Sjálfstæðisflokkurinn – Vinstrihreyfingin – grænt framboð – Framsóknarflokkurinn | 35 | 30 | 1.4% | 28–31 | 28–31 | 27–31 | 26–32 |
| Samfylkingin – Píratar – Vinstrihreyfingin – grænt framboð | 24 | 29 | 0.7% | 27–31 | 27–31 | 27–31 | 26–32 |
| Sjálfstæðisflokkurinn – Samfylkingin | 23 | 29 | 1.0% | 28–31 | 28–31 | 27–31 | 27–32 |
| Sjálfstæðisflokkurinn – Framsóknarflokkurinn – Miðflokkurinn | 31 | 26 | 0% | 24–28 | 24–28 | 24–28 | 23–29 |
| Samfylkingin – Vinstrihreyfingin – grænt framboð – Framsóknarflokkurinn | 26 | 26 | 0% | 25–27 | 25–28 | 24–28 | 24–29 |
| Samfylkingin – Vinstrihreyfingin – grænt framboð – Miðflokkurinn | 25 | 24 | 0% | 23–26 | 23–26 | 23–27 | 22–27 |
| Sjálfstæðisflokkurinn – Vinstrihreyfingin – grænt framboð | 27 | 24 | 0% | 23–25 | 22–25 | 22–25 | 21–26 |
| Sjálfstæðisflokkurinn – Framsóknarflokkurinn | 24 | 22 | 0% | 20–24 | 20–24 | 20–24 | 20–24 |
| Sjálfstæðisflokkurinn – Viðreisn | 20 | 22 | 0% | 20–24 | 20–24 | 20–24 | 19–25 |
| Samfylkingin – Vinstrihreyfingin – grænt framboð | 18 | 20 | 0% | 19–22 | 19–22 | 19–22 | 18–23 |
| Sjálfstæðisflokkurinn – Miðflokkurinn | 23 | 20 | 0% | 19–22 | 19–22 | 18–22 | 18–23 |
| Vinstrihreyfingin – grænt framboð – Framsóknarflokkurinn – Miðflokkurinn | 26 | 17 | 0% | 16–18 | 16–18 | 15–19 | 14–20 |
| Píratar – Vinstrihreyfingin – grænt framboð | 17 | 16 | 0% | 15–18 | 15–18 | 15–18 | 14–18 |
| Vinstrihreyfingin – grænt framboð – Framsóknarflokkurinn | 19 | 13 | 0% | 12–14 | 12–14 | 12–15 | 11–15 |
| Vinstrihreyfingin – grænt framboð – Miðflokkurinn | 18 | 11 | 0% | 11–12 | 11–12 | 10–13 | 9–13 |
Samfylkingin – Píratar – Vinstrihreyfingin – grænt framboð – Viðreisn
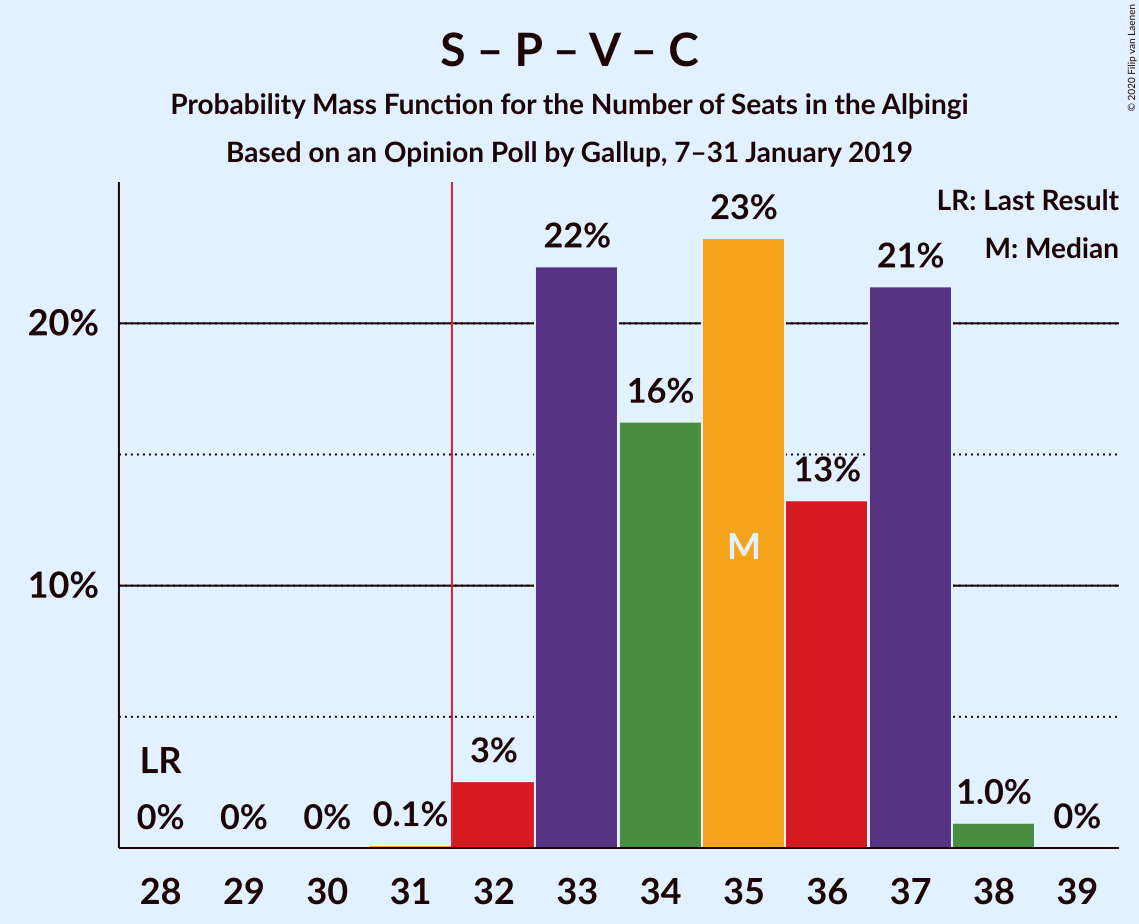
| Number of Seats | Probability | Accumulated | Special Marks |
|---|---|---|---|
| 28 | 0% | 100% | Last Result |
| 29 | 0% | 100% | |
| 30 | 0% | 100% | |
| 31 | 0.1% | 100% | |
| 32 | 3% | 99.9% | Majority |
| 33 | 22% | 97% | |
| 34 | 16% | 75% | Median |
| 35 | 23% | 59% | |
| 36 | 13% | 36% | |
| 37 | 21% | 22% | |
| 38 | 1.0% | 1.0% | |
| 39 | 0% | 0% |
Samfylkingin – Vinstrihreyfingin – grænt framboð – Framsóknarflokkurinn – Miðflokkurinn
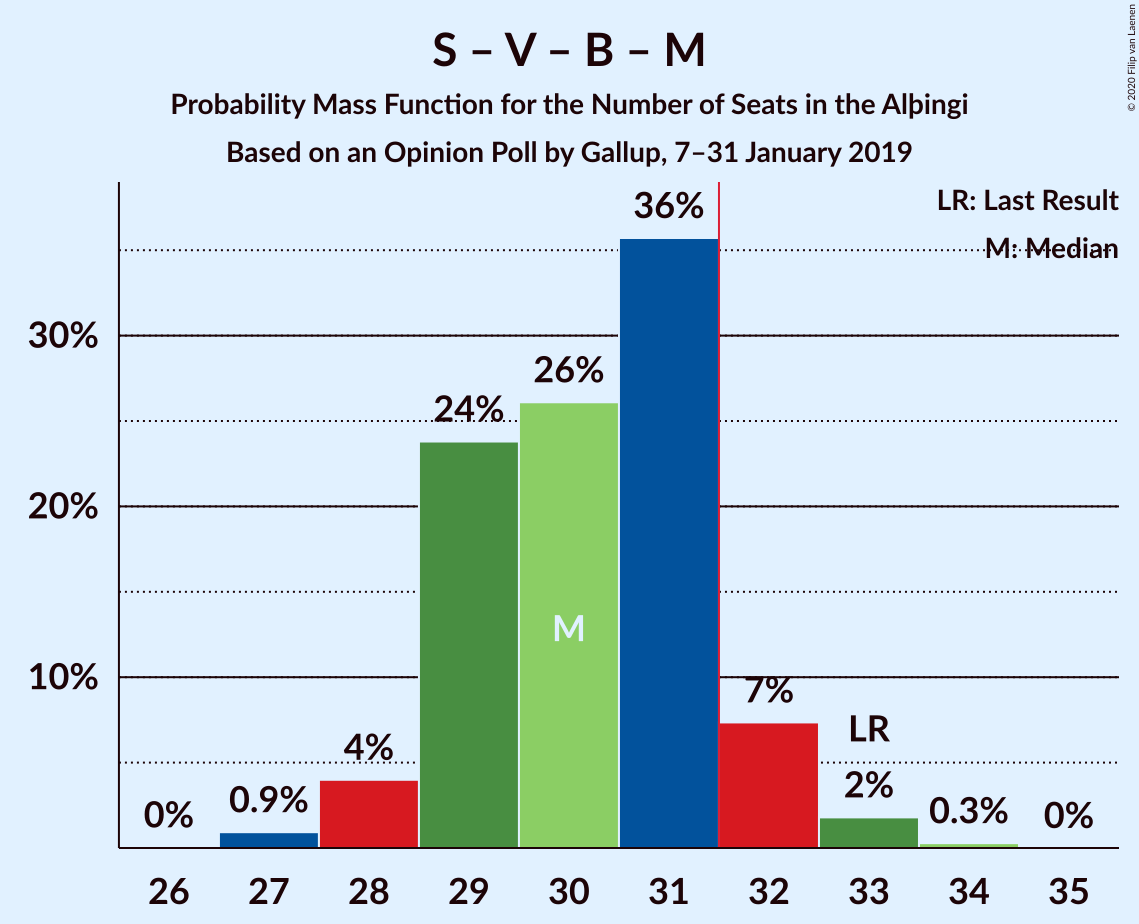
| Number of Seats | Probability | Accumulated | Special Marks |
|---|---|---|---|
| 27 | 0.9% | 100% | |
| 28 | 4% | 99.0% | |
| 29 | 24% | 95% | |
| 30 | 26% | 71% | Median |
| 31 | 36% | 45% | |
| 32 | 7% | 9% | Majority |
| 33 | 2% | 2% | Last Result |
| 34 | 0.3% | 0.3% | |
| 35 | 0% | 0% |
Sjálfstæðisflokkurinn – Vinstrihreyfingin – grænt framboð – Framsóknarflokkurinn
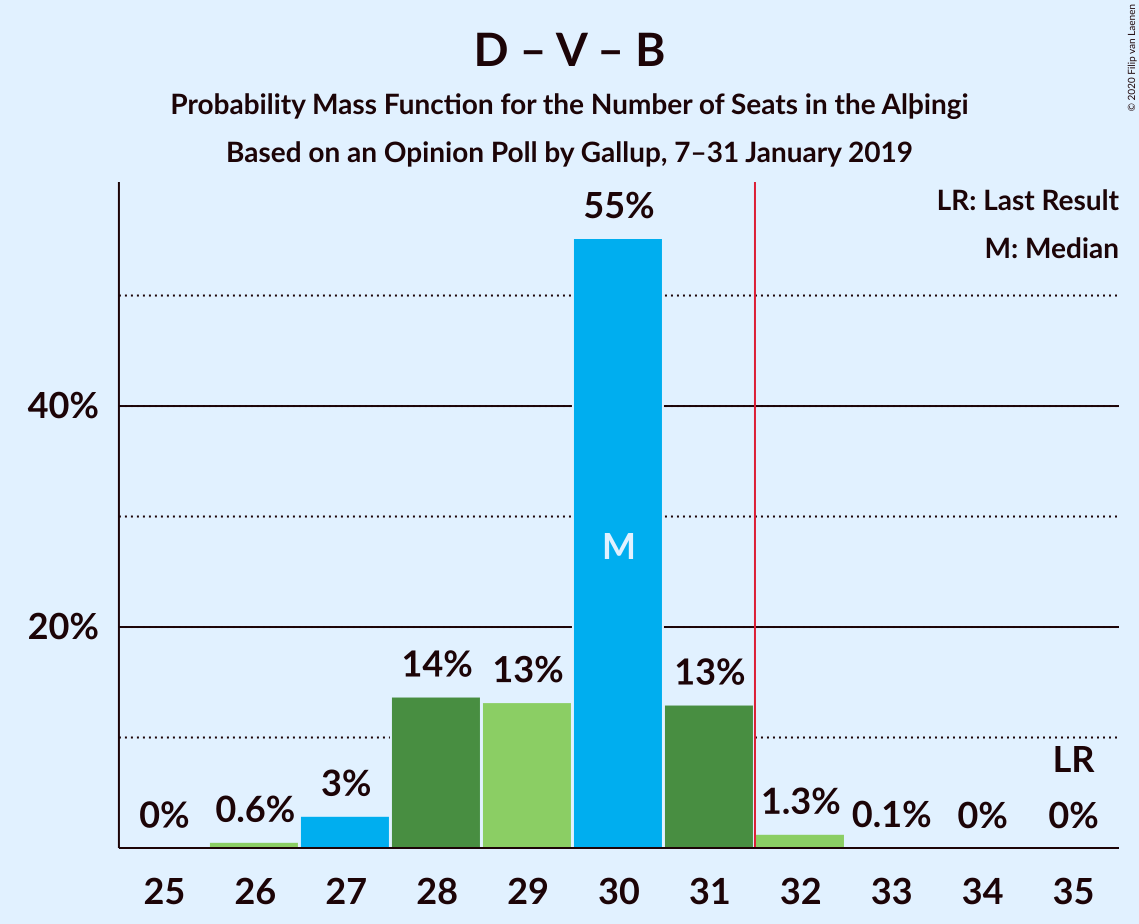
| Number of Seats | Probability | Accumulated | Special Marks |
|---|---|---|---|
| 26 | 0.6% | 100% | |
| 27 | 3% | 99.4% | |
| 28 | 14% | 96% | |
| 29 | 13% | 83% | Median |
| 30 | 55% | 70% | |
| 31 | 13% | 14% | |
| 32 | 1.3% | 1.4% | Majority |
| 33 | 0.1% | 0.1% | |
| 34 | 0% | 0% | |
| 35 | 0% | 0% | Last Result |
Samfylkingin – Píratar – Vinstrihreyfingin – grænt framboð
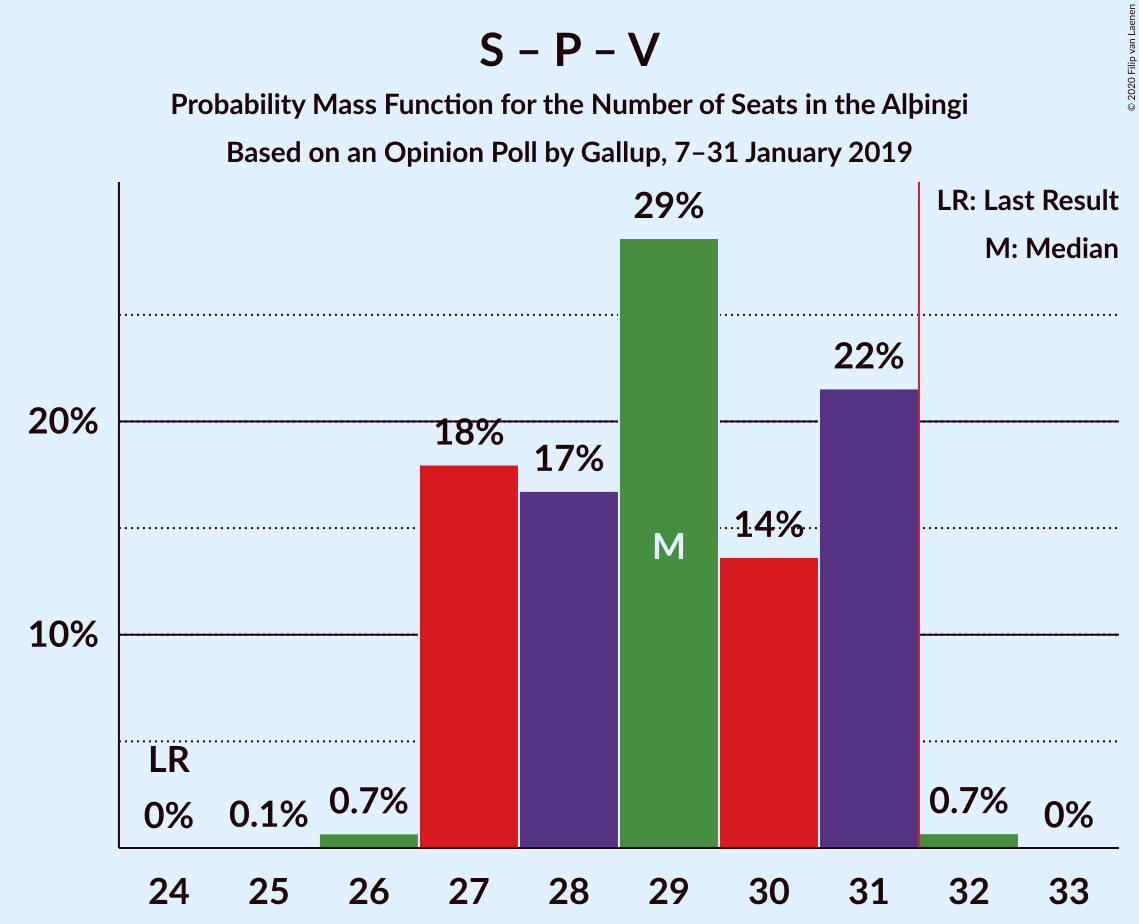
| Number of Seats | Probability | Accumulated | Special Marks |
|---|---|---|---|
| 24 | 0% | 100% | Last Result |
| 25 | 0.1% | 100% | |
| 26 | 0.7% | 99.9% | |
| 27 | 18% | 99.3% | |
| 28 | 17% | 81% | Median |
| 29 | 29% | 65% | |
| 30 | 14% | 36% | |
| 31 | 22% | 22% | |
| 32 | 0.7% | 0.7% | Majority |
| 33 | 0% | 0% |
Sjálfstæðisflokkurinn – Samfylkingin
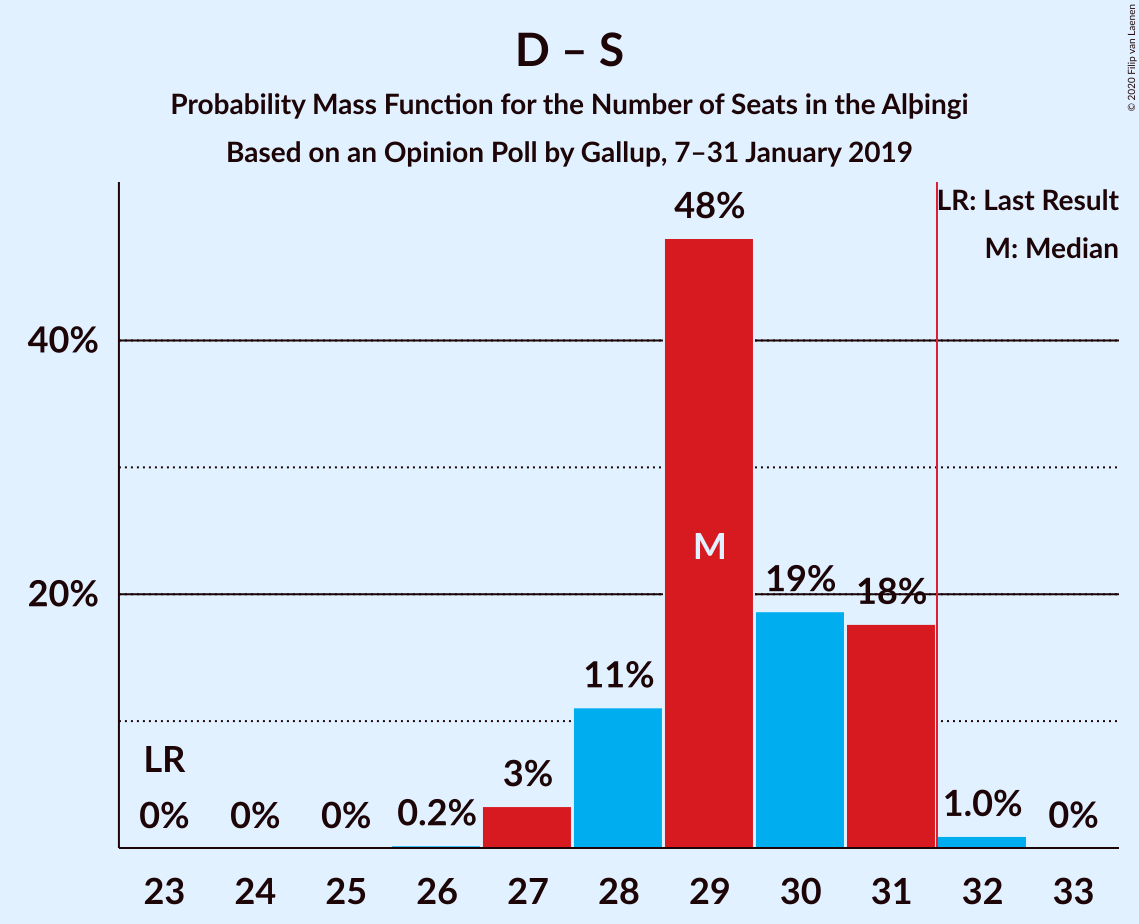
| Number of Seats | Probability | Accumulated | Special Marks |
|---|---|---|---|
| 23 | 0% | 100% | Last Result |
| 24 | 0% | 100% | |
| 25 | 0% | 100% | |
| 26 | 0.2% | 100% | |
| 27 | 3% | 99.8% | |
| 28 | 11% | 96% | |
| 29 | 48% | 85% | Median |
| 30 | 19% | 37% | |
| 31 | 18% | 19% | |
| 32 | 1.0% | 1.0% | Majority |
| 33 | 0% | 0% |
Sjálfstæðisflokkurinn – Framsóknarflokkurinn – Miðflokkurinn
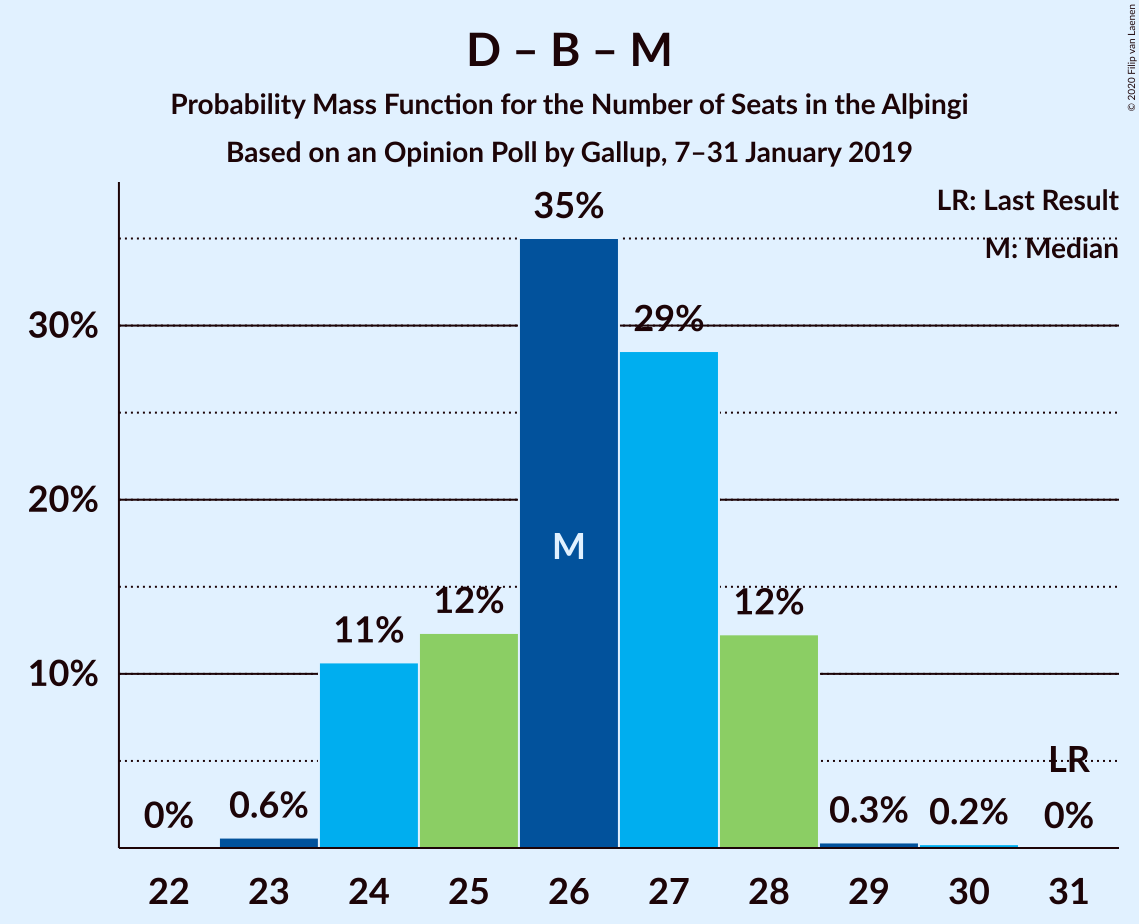
| Number of Seats | Probability | Accumulated | Special Marks |
|---|---|---|---|
| 23 | 0.6% | 100% | |
| 24 | 11% | 99.4% | |
| 25 | 12% | 89% | |
| 26 | 35% | 76% | Median |
| 27 | 29% | 41% | |
| 28 | 12% | 13% | |
| 29 | 0.3% | 0.5% | |
| 30 | 0.2% | 0.2% | |
| 31 | 0% | 0% | Last Result |
Samfylkingin – Vinstrihreyfingin – grænt framboð – Framsóknarflokkurinn
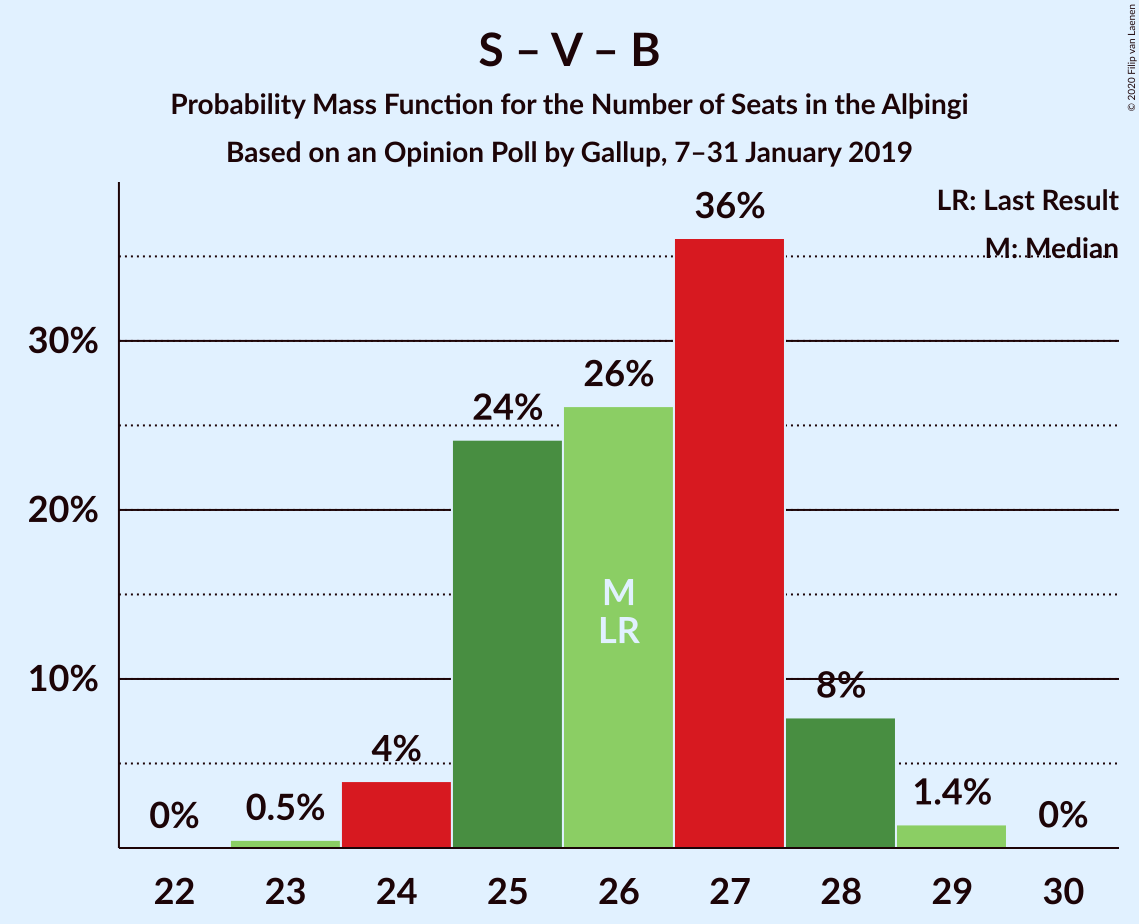
| Number of Seats | Probability | Accumulated | Special Marks |
|---|---|---|---|
| 23 | 0.5% | 100% | |
| 24 | 4% | 99.5% | |
| 25 | 24% | 96% | |
| 26 | 26% | 71% | Last Result, Median |
| 27 | 36% | 45% | |
| 28 | 8% | 9% | |
| 29 | 1.4% | 1.4% | |
| 30 | 0% | 0% |
Samfylkingin – Vinstrihreyfingin – grænt framboð – Miðflokkurinn
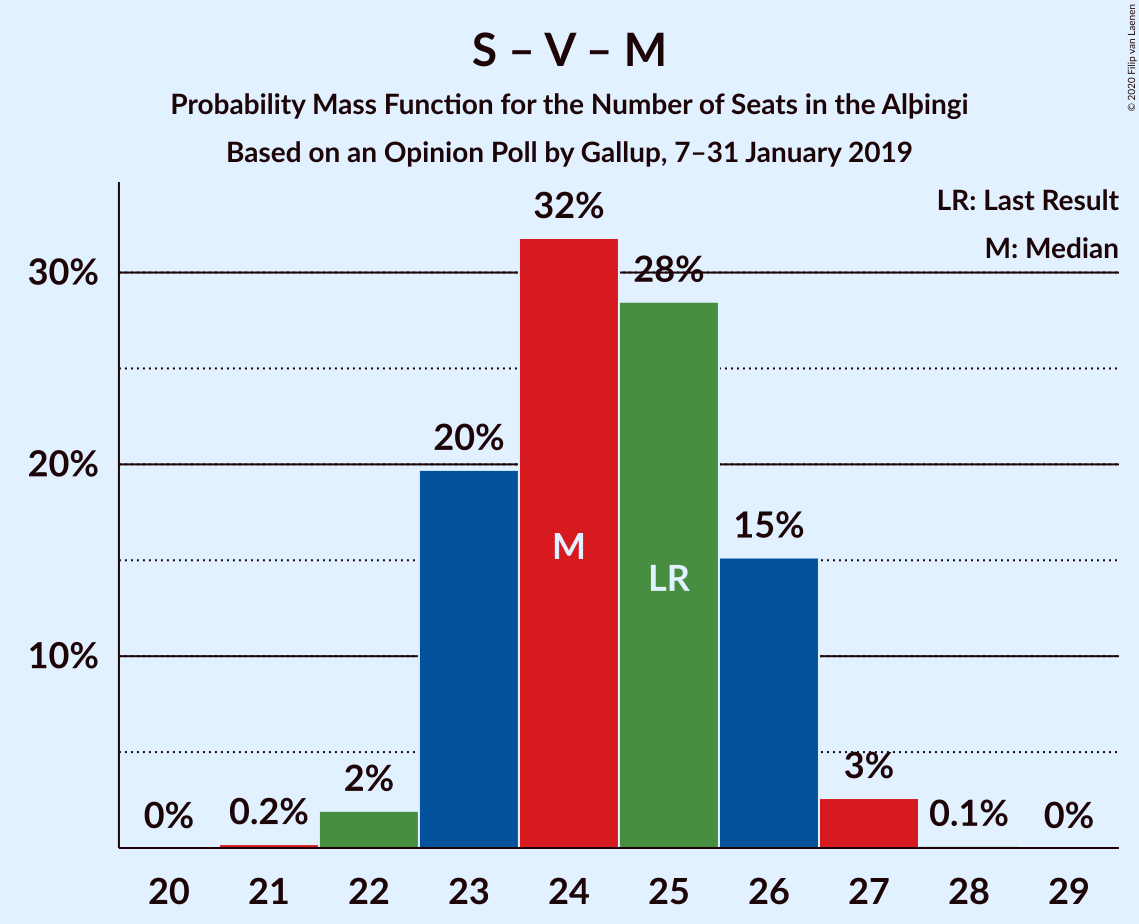
| Number of Seats | Probability | Accumulated | Special Marks |
|---|---|---|---|
| 21 | 0.2% | 100% | |
| 22 | 2% | 99.8% | |
| 23 | 20% | 98% | |
| 24 | 32% | 78% | Median |
| 25 | 28% | 46% | Last Result |
| 26 | 15% | 18% | |
| 27 | 3% | 3% | |
| 28 | 0.1% | 0.1% | |
| 29 | 0% | 0% |
Sjálfstæðisflokkurinn – Vinstrihreyfingin – grænt framboð
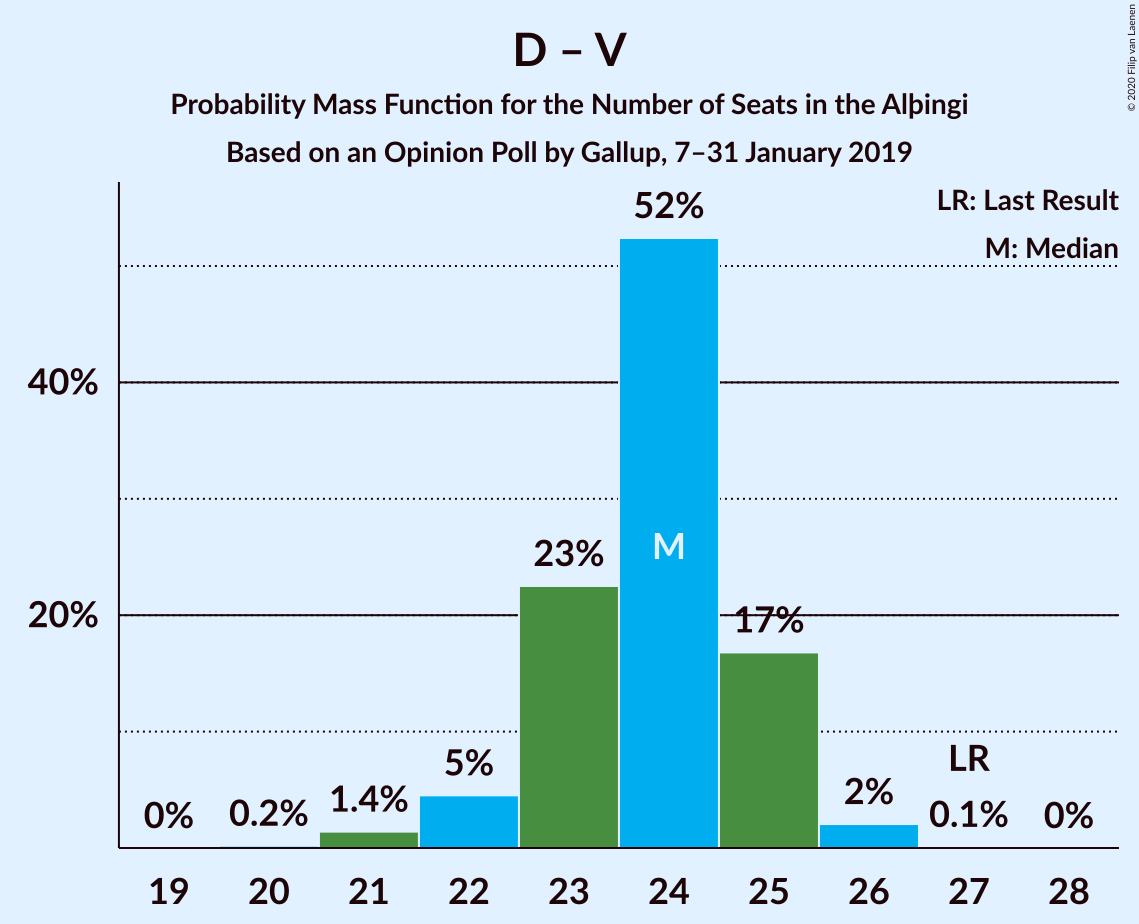
| Number of Seats | Probability | Accumulated | Special Marks |
|---|---|---|---|
| 20 | 0.2% | 100% | |
| 21 | 1.4% | 99.8% | |
| 22 | 5% | 98% | |
| 23 | 23% | 94% | Median |
| 24 | 52% | 71% | |
| 25 | 17% | 19% | |
| 26 | 2% | 2% | |
| 27 | 0.1% | 0.1% | Last Result |
| 28 | 0% | 0% |
Sjálfstæðisflokkurinn – Framsóknarflokkurinn
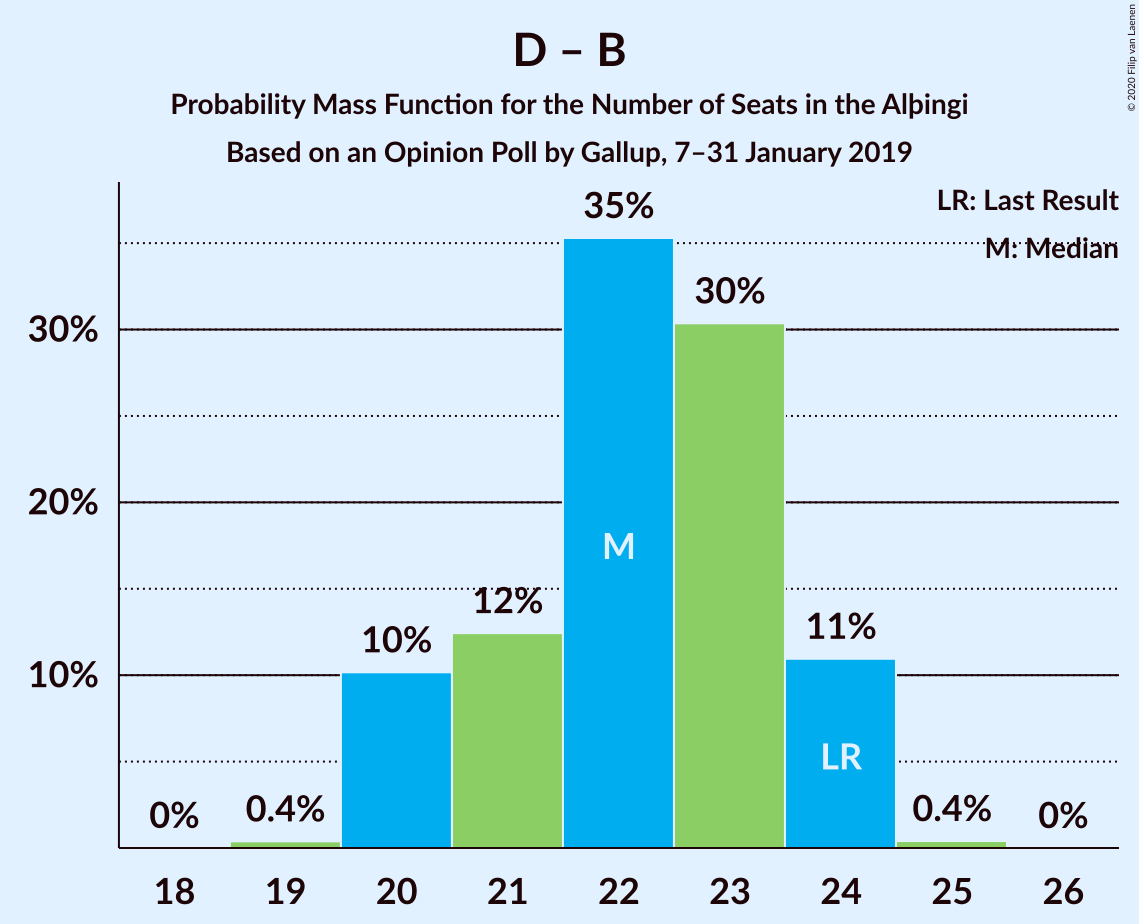
| Number of Seats | Probability | Accumulated | Special Marks |
|---|---|---|---|
| 19 | 0.4% | 100% | |
| 20 | 10% | 99.6% | |
| 21 | 12% | 89% | |
| 22 | 35% | 77% | Median |
| 23 | 30% | 42% | |
| 24 | 11% | 11% | Last Result |
| 25 | 0.4% | 0.4% | |
| 26 | 0% | 0% |
Sjálfstæðisflokkurinn – Viðreisn
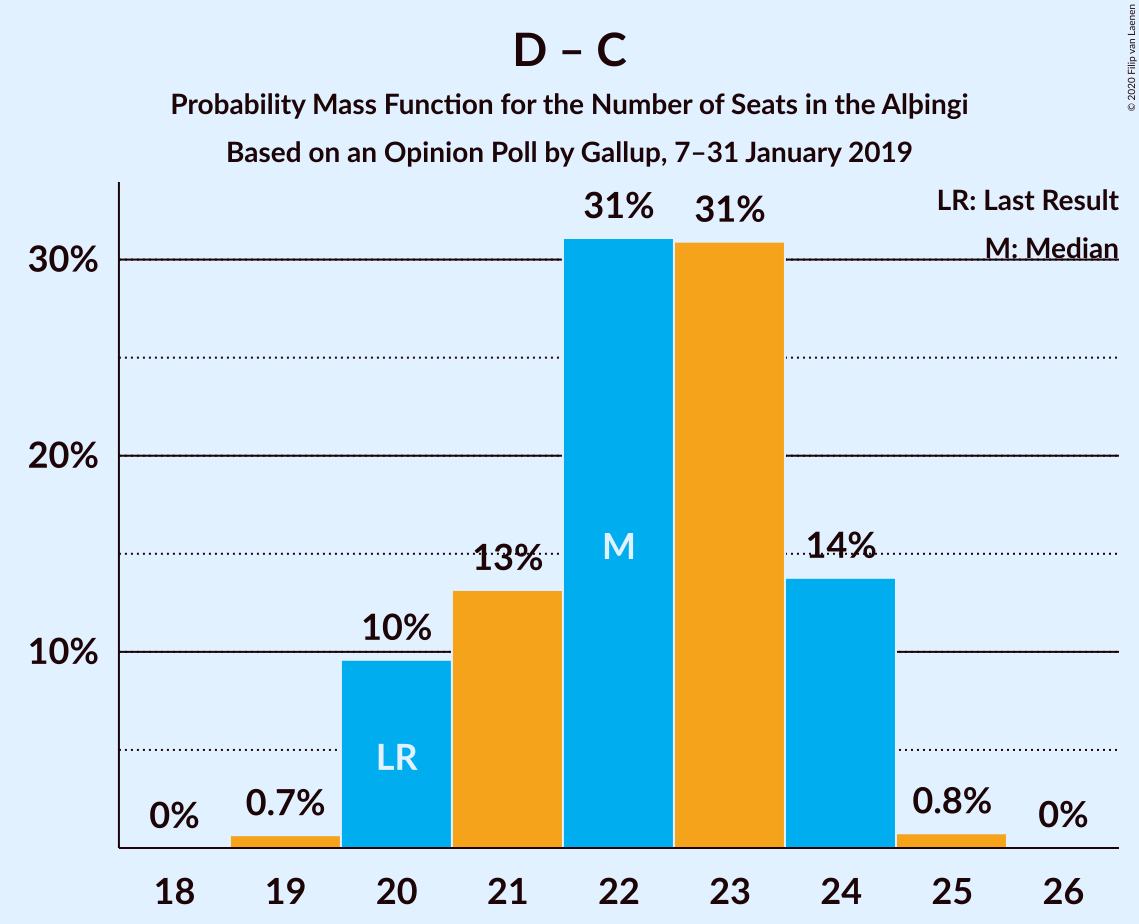
| Number of Seats | Probability | Accumulated | Special Marks |
|---|---|---|---|
| 19 | 0.7% | 100% | |
| 20 | 10% | 99.3% | Last Result |
| 21 | 13% | 90% | |
| 22 | 31% | 77% | Median |
| 23 | 31% | 45% | |
| 24 | 14% | 15% | |
| 25 | 0.8% | 0.8% | |
| 26 | 0% | 0% |
Samfylkingin – Vinstrihreyfingin – grænt framboð
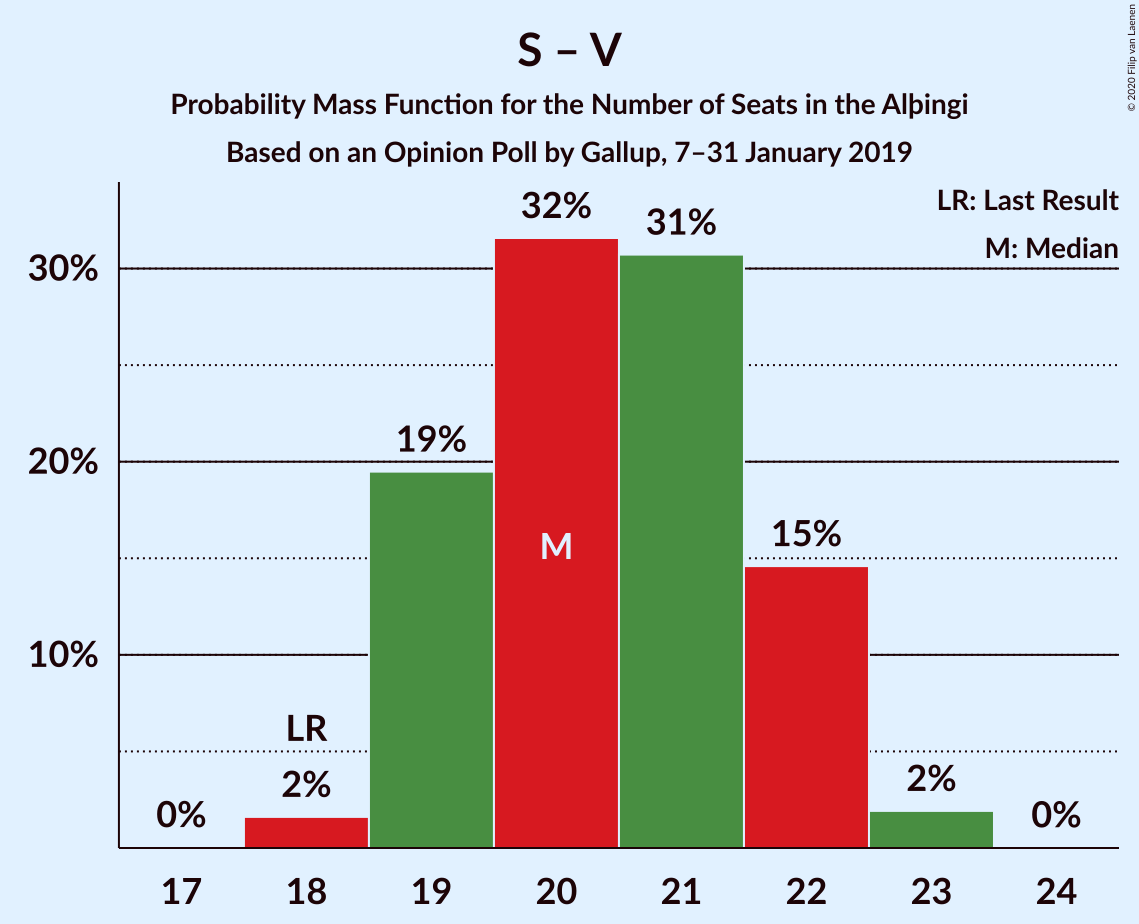
| Number of Seats | Probability | Accumulated | Special Marks |
|---|---|---|---|
| 18 | 2% | 100% | Last Result |
| 19 | 19% | 98% | |
| 20 | 32% | 79% | Median |
| 21 | 31% | 47% | |
| 22 | 15% | 17% | |
| 23 | 2% | 2% | |
| 24 | 0% | 0% |
Sjálfstæðisflokkurinn – Miðflokkurinn
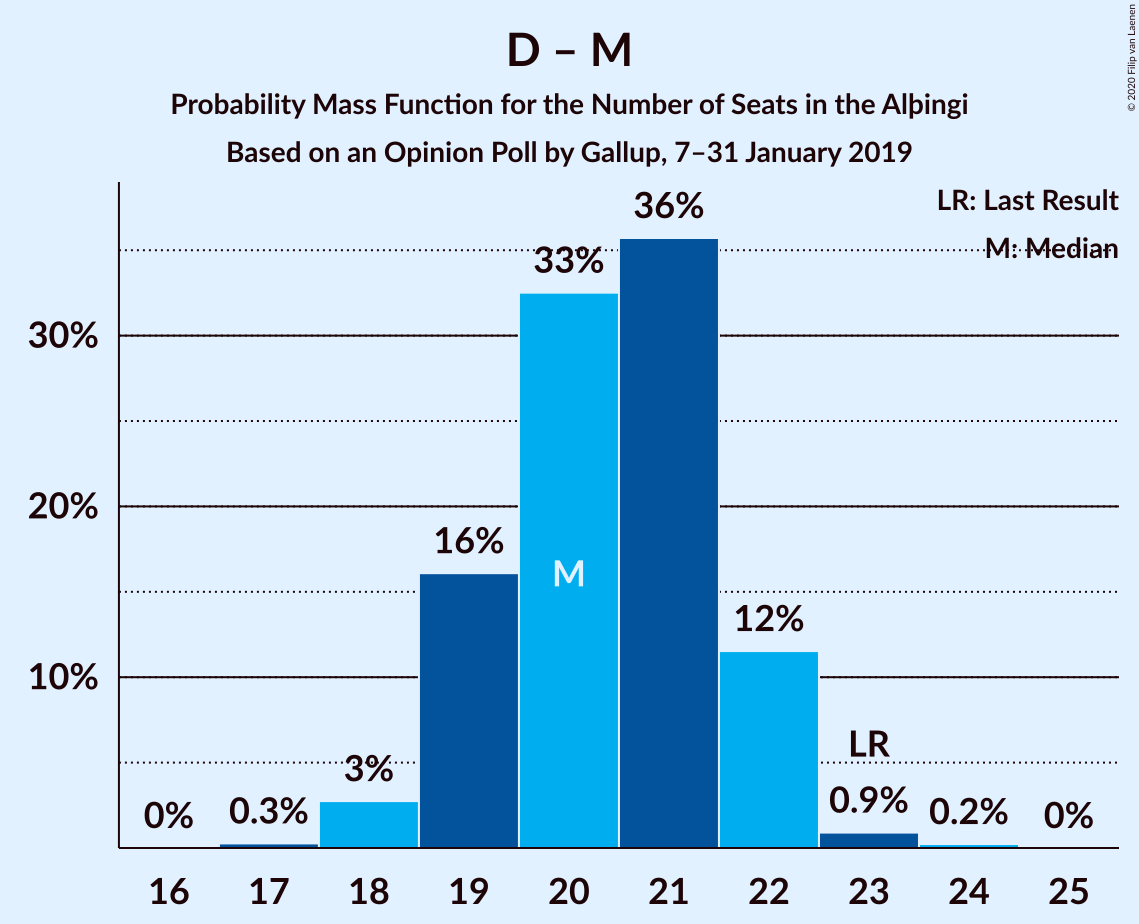
| Number of Seats | Probability | Accumulated | Special Marks |
|---|---|---|---|
| 17 | 0.3% | 100% | |
| 18 | 3% | 99.7% | |
| 19 | 16% | 97% | |
| 20 | 33% | 81% | Median |
| 21 | 36% | 48% | |
| 22 | 12% | 13% | |
| 23 | 0.9% | 1.1% | Last Result |
| 24 | 0.2% | 0.2% | |
| 25 | 0% | 0% |
Vinstrihreyfingin – grænt framboð – Framsóknarflokkurinn – Miðflokkurinn
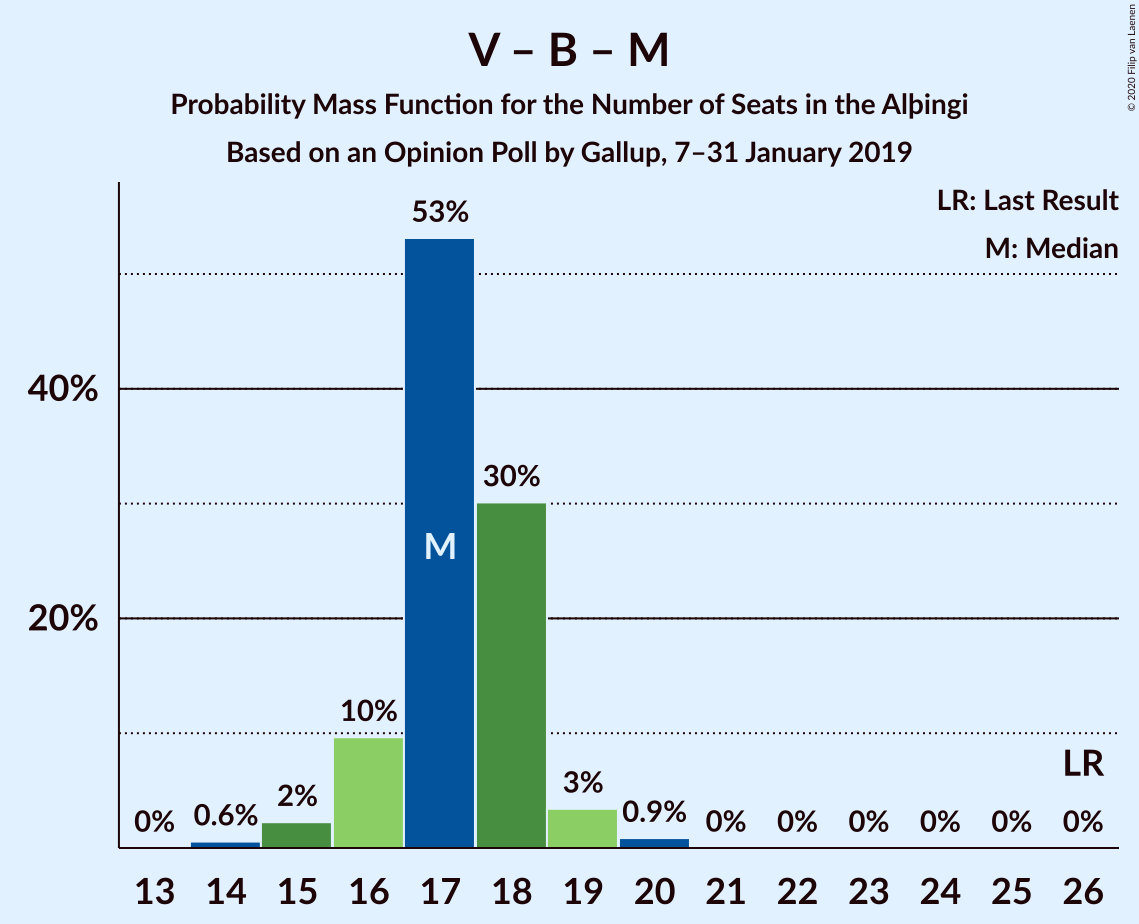
| Number of Seats | Probability | Accumulated | Special Marks |
|---|---|---|---|
| 14 | 0.6% | 100% | |
| 15 | 2% | 99.4% | |
| 16 | 10% | 97% | |
| 17 | 53% | 88% | Median |
| 18 | 30% | 34% | |
| 19 | 3% | 4% | |
| 20 | 0.9% | 0.9% | |
| 21 | 0% | 0% | |
| 22 | 0% | 0% | |
| 23 | 0% | 0% | |
| 24 | 0% | 0% | |
| 25 | 0% | 0% | |
| 26 | 0% | 0% | Last Result |
Píratar – Vinstrihreyfingin – grænt framboð
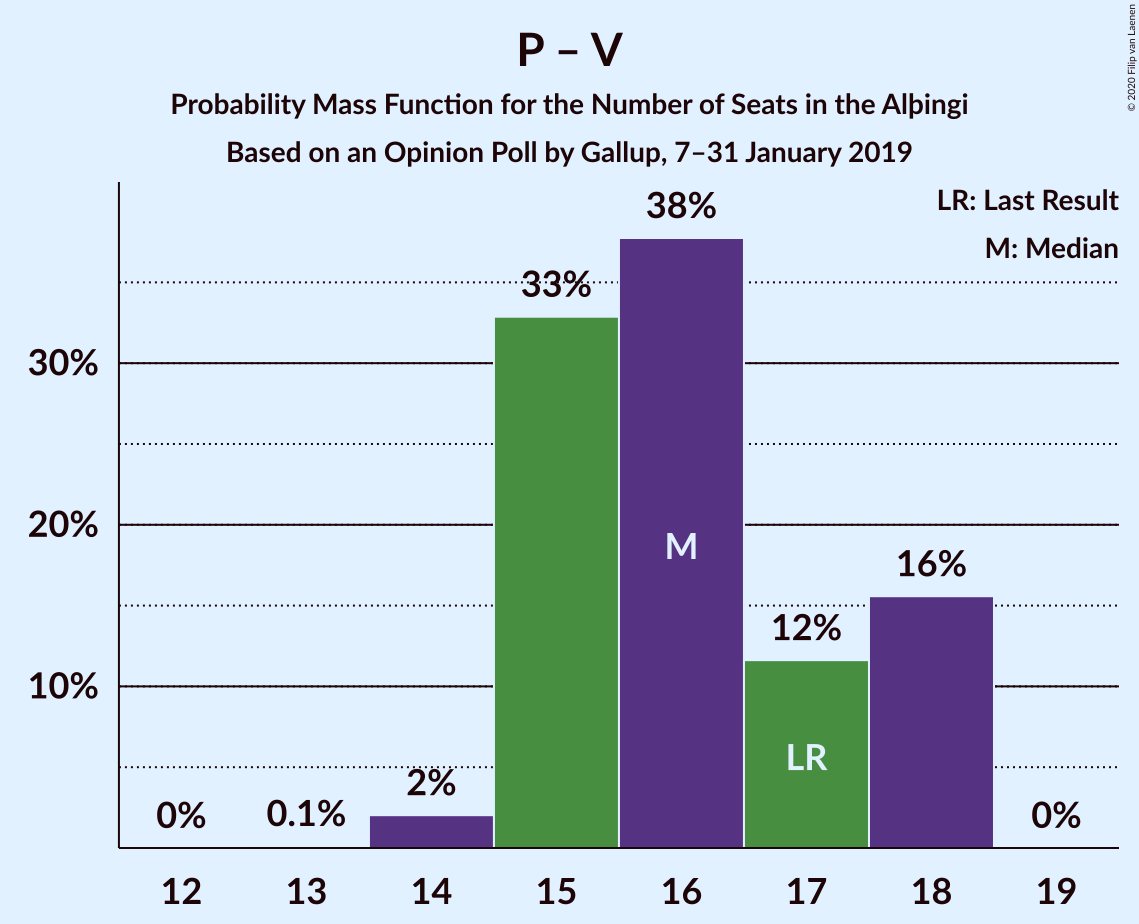
| Number of Seats | Probability | Accumulated | Special Marks |
|---|---|---|---|
| 13 | 0.1% | 100% | |
| 14 | 2% | 99.9% | |
| 15 | 33% | 98% | Median |
| 16 | 38% | 65% | |
| 17 | 12% | 27% | Last Result |
| 18 | 16% | 16% | |
| 19 | 0% | 0% |
Vinstrihreyfingin – grænt framboð – Framsóknarflokkurinn
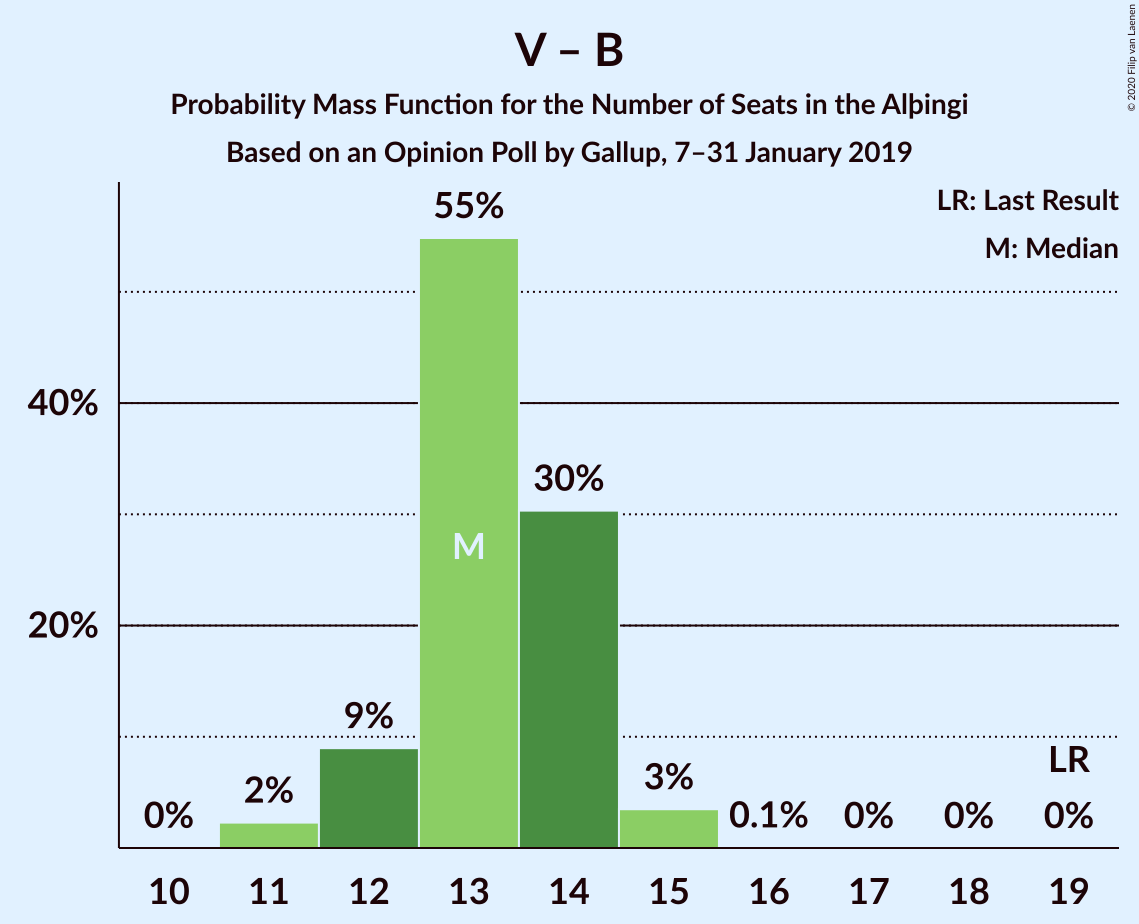
| Number of Seats | Probability | Accumulated | Special Marks |
|---|---|---|---|
| 11 | 2% | 100% | |
| 12 | 9% | 98% | |
| 13 | 55% | 89% | Median |
| 14 | 30% | 34% | |
| 15 | 3% | 4% | |
| 16 | 0.1% | 0.1% | |
| 17 | 0% | 0% | |
| 18 | 0% | 0% | |
| 19 | 0% | 0% | Last Result |
Vinstrihreyfingin – grænt framboð – Miðflokkurinn
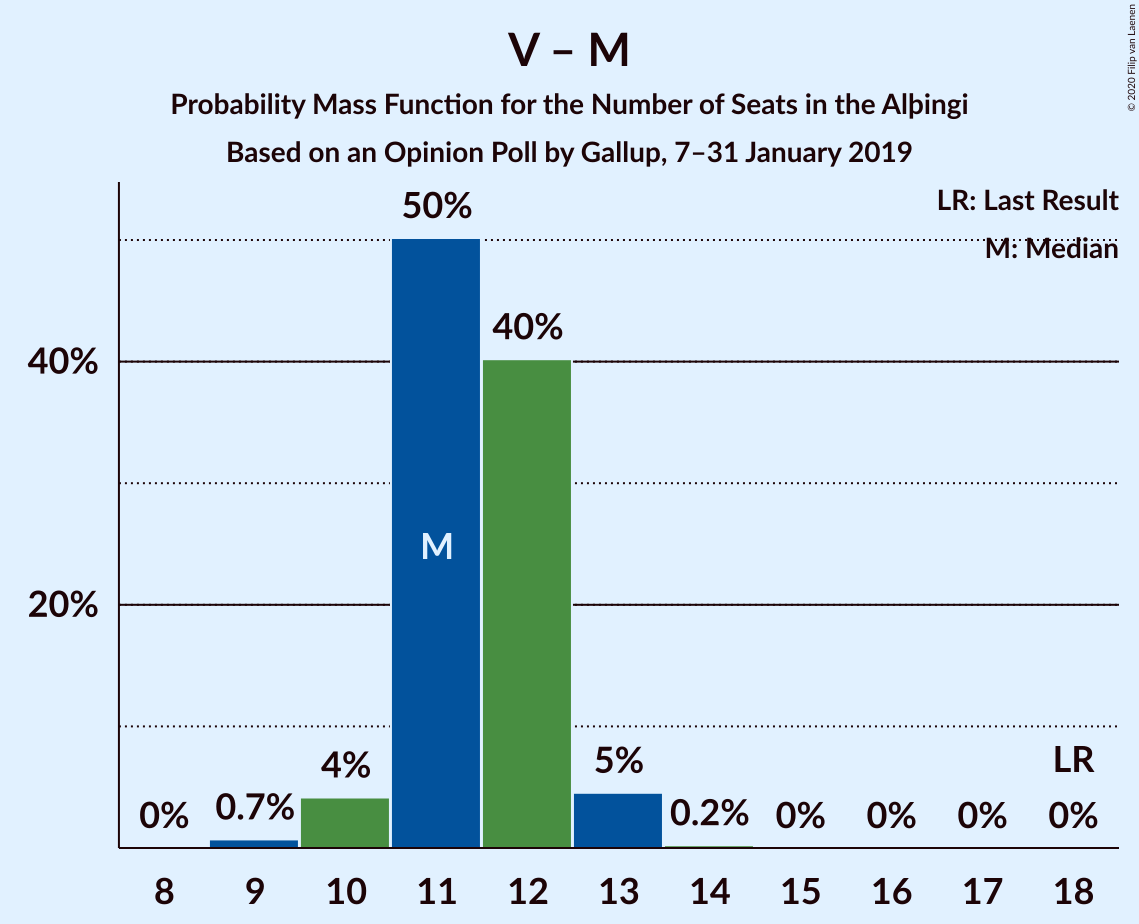
| Number of Seats | Probability | Accumulated | Special Marks |
|---|---|---|---|
| 9 | 0.7% | 100% | |
| 10 | 4% | 99.3% | |
| 11 | 50% | 95% | Median |
| 12 | 40% | 45% | |
| 13 | 5% | 5% | |
| 14 | 0.2% | 0.2% | |
| 15 | 0% | 0% | |
| 16 | 0% | 0% | |
| 17 | 0% | 0% | |
| 18 | 0% | 0% | Last Result |
Technical Information
Opinion Poll
- Polling firm: Gallup
- Commissioner(s): —
- Fieldwork period: 7–31 January 2019
Calculations
- Sample size: 2307
- Simulations done: 1,048,576
- Error estimate: 1.81%