Poll Average
Voting Intentions | Seats | Coalitions | Technical Information
Summary
The table below lists the polls on which the average is based. They are the most recent polls (less than 90 days old) registered and analyzed so far.
| Period | Polling firm/Commissioner(s) | LINKE | Tierschutz | GRÜNEN | Volt | PIRATEN | SPD | FDP | FW | CDU | CSU | FAMILIE | ÖDP | AfD | PARTEI | BSW | dieBasis | |
|---|---|---|---|---|---|---|---|---|---|---|---|---|---|---|---|---|---|---|
| 9 June 2024 | General Election | 0.0% 0 |
0.0% 0 |
0.0% 0 |
0.0% 0 |
0.0% 0 |
0.0% 0 |
0.0% 0 |
0.0% 0 |
0.0% 0 |
0.0% 0 |
0.0% 0 |
0.0% 0 |
0.0% 0 |
0.0% 0 |
0.0% 0 |
0.0% 0 |
0.0% 0 |
| N/A | Poll Average | 9–13% 8–13 |
1–2% 1–2 |
10–14% 9–14 |
0–2% 0–2 |
N/A N/A |
13–17% 12–17 |
2–5% 2–5 |
1–3% 1–3 |
17–23% 16–22 |
4–7% 4–7 |
N/A N/A |
N/A N/A |
22–28% 21–26 |
0–1% 0–1 |
0–5% 0–5 |
0–1% 0–1 |
N/A N/A |
| 13–16 February 2026 | INSA and YouGov BILD |
9–11% 8–11 |
1–2% 1–2 |
10–12% 9–12 |
1% 1 |
N/A N/A |
14–17% 13–16 |
2–4% 2–4 |
1–3% 1–2 |
17–21% 16–20 |
5–8% 5–7 |
N/A N/A |
N/A N/A |
24–27% 23–26 |
0–1% 0–1 |
3–5% 3–5 |
0–1% 0 |
N/A N/A |
| 10–16 February 2026 | Forsa RTL n-tv |
9–11% 8–11 |
1–2% 1–2 |
11–14% 10–13 |
1–2% 1–2 |
N/A N/A |
12–16% 12–16 |
2–4% 2–3 |
2–3% 2–3 |
19–22% 18–22 |
5–7% 4–7 |
N/A N/A |
N/A N/A |
23–27% 22–26 |
0–1% 0–1 |
2–4% 2–4 |
0–1% 0–1 |
N/A N/A |
| 4–10 February 2026 | Verian FOCUS |
9–13% 9–12 |
1–2% 1–2 |
10–14% 10–13 |
1–2% 1–2 |
N/A N/A |
13–17% 13–16 |
3–5% 3–5 |
1–3% 1–3 |
18–22% 17–21 |
4–6% 4–7 |
N/A N/A |
N/A N/A |
22–26% 21–25 |
0–1% 0–1 |
2–4% 2–4 |
0–1% 0–1 |
N/A N/A |
| 6–9 February 2026 | YouGov | 9–11% 8–11 |
1–2% 1–2 |
9–12% 9–11 |
1% 1 |
N/A N/A |
14–18% 14–17 |
3–5% 3–5 |
1–3% 1–3 |
18–22% 17–21 |
4–6% 4–6 |
N/A N/A |
N/A N/A |
23–27% 22–25 |
0–1% 0–1 |
3–5% 3–5 |
0–1% 0–1 |
N/A N/A |
| 6–8 February 2026 | Ipsos | 10–14% 10–14 |
0–2% 1 |
11–15% 11–14 |
0–1% 0–1 |
N/A N/A |
13–17% 12–16 |
3–5% 3–5 |
1–2% 1–2 |
16–21% 16–20 |
4–6% 4–6 |
N/A N/A |
N/A N/A |
23–29% 23–28 |
0–1% 0–1 |
2–4% 2–4 |
0–1% 0–1 |
N/A N/A |
| 3–5 February 2026 | Forschungsgruppe Wahlen ZDF |
8–12% 8–13 |
0–2% 0–2 |
11–15% 10–14 |
0–1% 0–1 |
N/A N/A |
13–17% 12–16 |
3–5% 3–5 |
1–2% 1–2 |
18–23% 17–22 |
4–7% 4–7 |
N/A N/A |
N/A N/A |
22–27% 20–25 |
0–1% 0–1 |
3–6% 3–6 |
0–1% 0–1 |
N/A N/A |
| 2–4 February 2026 | Infratest dimap ARD |
8–12% 8–11 |
1–2% 1–2 |
10–14% 10–13 |
1–2% 1–2 |
N/A N/A |
13–17% 12–16 |
2–4% 2–4 |
2–3% 2–3 |
18–23% 18–21 |
4–7% 4–6 |
N/A N/A |
N/A N/A |
22–26% 21–25 |
0–1% 0–1 |
2–4% 2–4 |
0–1% 0–1 |
N/A N/A |
| 6–19 January 2026 | Allensbach Frankfurter Allgemeine Zeitung |
8–12% 8–11 |
1–3% 1–3 |
10–14% 9–12 |
1–2% 1–2 |
N/A N/A |
13–17% 13–17 |
3–5% 3–4 |
2–4% 2–3 |
19–24% 18–22 |
4–7% 4–7 |
N/A N/A |
N/A N/A |
22–28% 22–25 |
0–2% 1 |
0–1% 0 |
0–1% 0–1 |
N/A N/A |
| 9 June 2024 | General Election | 0.0% 0 |
0.0% 0 |
0.0% 0 |
0.0% 0 |
0.0% 0 |
0.0% 0 |
0.0% 0 |
0.0% 0 |
0.0% 0 |
0.0% 0 |
0.0% 0 |
0.0% 0 |
0.0% 0 |
0.0% 0 |
0.0% 0 |
0.0% 0 |
0.0% 0 |
Only polls for which at least the sample size has been published are included in the table above.
Legend:
- Top half of each row: Voting intentions (95% confidence interval)
- Bottom half of each row: Seat projections for the European Parliament (95% confidence interval)
- LINKE: Die Linke (GUE/NGL)
- Tierschutz: Partei Mensch Umwelt Tierschutz (GUE/NGL)
- GRÜNEN: Bündnis 90/Die Grünen (Greens/EFA)
- Volt: Volt Europa (Greens/EFA)
- PIRATEN: Piratenpartei Deutschland (Greens/EFA)
- SPD: Sozialdemokratische Partei Deutschlands (S&D)
- FDP: Freie Demokratische Partei (RE)
- FW: Freie Wähler (RE)
- CDU: Christlich Demokratische Union Deutschlands (EPP)
- CSU: Christlich-Soziale Union in Bayern (EPP)
- FAMILIE: Familienpartei Deutschlands (EPP)
- ÖDP: Ökologisch-Demokratische Partei (EPP)
- AfD: Alternative für Deutschland (ESN)
- PARTEI: Die PARTEI (NI)
- BSW: Bündnis Sahra Wagenknecht (NI)
- dieBasis: Basisdemokratische Partei Deutschland (*)
- PDF: Partei des Fortschritts (*)
- N/A (single party): Party not included the published results
- N/A (entire row): Calculation for this opinion poll not started yet
Voting Intentions

Confidence Intervals
| Party | Last Result | Median | 80% Confidence Interval | 90% Confidence Interval | 95% Confidence Interval | 99% Confidence Interval |
|---|---|---|---|---|---|---|
| Die Linke (GUE/NGL) | 0.0% | 10.3% | 9.2–11.9% | 8.9–12.5% | 8.6–13.0% | 8.1–13.9% |
| Partei Mensch Umwelt Tierschutz (GUE/NGL) | 0.0% | 1.3% | 0.8–1.9% | 0.6–2.0% | 0.6–2.2% | 0.4–2.6% |
| Bündnis 90/Die Grünen (Greens/EFA) | 0.0% | 11.9% | 10.5–13.5% | 10.2–14.0% | 9.9–14.4% | 9.4–15.3% |
| Volt Europa (Greens/EFA) | 0.0% | 1.0% | 0.6–1.4% | 0.5–1.6% | 0.4–1.7% | 0.3–2.0% |
| Piratenpartei Deutschland (Greens/EFA) | 0.0% | N/A | N/A | N/A | N/A | N/A |
| Sozialdemokratische Partei Deutschlands (S&D) | 0.0% | 15.1% | 13.7–16.5% | 13.3–16.9% | 13.0–17.2% | 12.4–17.9% |
| Freie Demokratische Partei (RE) | 0.0% | 3.6% | 2.8–4.5% | 2.6–4.7% | 2.4–5.0% | 2.2–5.4% |
| Freie Wähler (RE) | 0.0% | 2.1% | 1.3–2.8% | 1.2–3.1% | 1.0–3.3% | 0.8–3.7% |
| Christlich Demokratische Union Deutschlands (EPP) | 0.0% | 20.0% | 18.2–21.8% | 17.6–22.3% | 17.1–22.8% | 16.2–23.7% |
| Christlich-Soziale Union in Bayern (EPP) | 0.0% | 5.5% | 4.6–6.6% | 4.4–6.9% | 4.1–7.1% | 3.7–7.6% |
| Familienpartei Deutschlands (EPP) | 0.0% | N/A | N/A | N/A | N/A | N/A |
| Ökologisch-Demokratische Partei (EPP) | 0.0% | N/A | N/A | N/A | N/A | N/A |
| Alternative für Deutschland (ESN) | 0.0% | 24.8% | 23.1–26.6% | 22.6–27.1% | 22.2–27.6% | 21.4–28.6% |
| Die PARTEI (NI) | 0.0% | 0.7% | 0.4–1.1% | 0.3–1.2% | 0.3–1.3% | 0.2–1.6% |
| Bündnis Sahra Wagenknecht (NI) | 0.0% | 3.3% | 0.3–4.5% | 0.1–4.8% | 0.1–5.0% | 0.0–5.6% |
| Basisdemokratische Partei Deutschland (*) | 0.0% | 0.3% | 0.1–0.5% | 0.1–0.6% | 0.1–0.7% | 0.1–0.8% |
| Partei des Fortschritts (*) | 0.0% | N/A | N/A | N/A | N/A | N/A |
Sozialdemokratische Partei Deutschlands (S&D)
For a full overview of the results for this party, see the Sozialdemokratische Partei Deutschlands (S&D) page.
| Voting Intentions | Probability | Accumulated | Special Marks |
|---|---|---|---|
| 0.0–0.5% | 0% | 100% | Last Result |
| 0.5–1.5% | 0% | 100% | |
| 1.5–2.5% | 0% | 100% | |
| 2.5–3.5% | 0% | 100% | |
| 3.5–4.5% | 0% | 100% | |
| 4.5–5.5% | 0% | 100% | |
| 5.5–6.5% | 0% | 100% | |
| 6.5–7.5% | 0% | 100% | |
| 7.5–8.5% | 0% | 100% | |
| 8.5–9.5% | 0% | 100% | |
| 9.5–10.5% | 0% | 100% | |
| 10.5–11.5% | 0% | 100% | |
| 11.5–12.5% | 0.8% | 100% | |
| 12.5–13.5% | 7% | 99.2% | |
| 13.5–14.5% | 24% | 92% | |
| 14.5–15.5% | 35% | 68% | Median |
| 15.5–16.5% | 25% | 34% | |
| 16.5–17.5% | 8% | 9% | |
| 17.5–18.5% | 1.1% | 1.2% | |
| 18.5–19.5% | 0.1% | 0.1% | |
| 19.5–20.5% | 0% | 0% |
Die PARTEI (NI)
For a full overview of the results for this party, see the Die PARTEI (NI) page.
| Voting Intentions | Probability | Accumulated | Special Marks |
|---|---|---|---|
| 0.0–0.5% | 29% | 100% | Last Result |
| 0.5–1.5% | 71% | 71% | Median |
| 1.5–2.5% | 0.5% | 0.5% | |
| 2.5–3.5% | 0% | 0% |
Basisdemokratische Partei Deutschland (*)
For a full overview of the results for this party, see the Basisdemokratische Partei Deutschland (*) page.
| Voting Intentions | Probability | Accumulated | Special Marks |
|---|---|---|---|
| 0.0–0.5% | 93% | 100% | Last Result, Median |
| 0.5–1.5% | 7% | 7% | |
| 1.5–2.5% | 0% | 0% |
Alternative für Deutschland (ESN)
For a full overview of the results for this party, see the Alternative für Deutschland (ESN) page.
| Voting Intentions | Probability | Accumulated | Special Marks |
|---|---|---|---|
| 0.0–0.5% | 0% | 100% | Last Result |
| 0.5–1.5% | 0% | 100% | |
| 1.5–2.5% | 0% | 100% | |
| 2.5–3.5% | 0% | 100% | |
| 3.5–4.5% | 0% | 100% | |
| 4.5–5.5% | 0% | 100% | |
| 5.5–6.5% | 0% | 100% | |
| 6.5–7.5% | 0% | 100% | |
| 7.5–8.5% | 0% | 100% | |
| 8.5–9.5% | 0% | 100% | |
| 9.5–10.5% | 0% | 100% | |
| 10.5–11.5% | 0% | 100% | |
| 11.5–12.5% | 0% | 100% | |
| 12.5–13.5% | 0% | 100% | |
| 13.5–14.5% | 0% | 100% | |
| 14.5–15.5% | 0% | 100% | |
| 15.5–16.5% | 0% | 100% | |
| 16.5–17.5% | 0% | 100% | |
| 17.5–18.5% | 0% | 100% | |
| 18.5–19.5% | 0% | 100% | |
| 19.5–20.5% | 0.1% | 100% | |
| 20.5–21.5% | 0.6% | 99.9% | |
| 21.5–22.5% | 4% | 99.3% | |
| 22.5–23.5% | 13% | 95% | |
| 23.5–24.5% | 25% | 82% | |
| 24.5–25.5% | 28% | 57% | Median |
| 25.5–26.5% | 19% | 29% | |
| 26.5–27.5% | 7% | 10% | |
| 27.5–28.5% | 2% | 3% | |
| 28.5–29.5% | 0.5% | 0.6% | |
| 29.5–30.5% | 0.1% | 0.1% | |
| 30.5–31.5% | 0% | 0% |
Bündnis Sahra Wagenknecht (NI)
For a full overview of the results for this party, see the Bündnis Sahra Wagenknecht (NI) page.
| Voting Intentions | Probability | Accumulated | Special Marks |
|---|---|---|---|
| 0.0–0.5% | 12% | 100% | Last Result |
| 0.5–1.5% | 0.2% | 88% | |
| 1.5–2.5% | 6% | 87% | |
| 2.5–3.5% | 41% | 81% | Median |
| 3.5–4.5% | 32% | 41% | |
| 4.5–5.5% | 8% | 8% | |
| 5.5–6.5% | 0.5% | 0.5% | |
| 6.5–7.5% | 0% | 0% |
Die Linke (GUE/NGL)
For a full overview of the results for this party, see the Die Linke (GUE/NGL) page.
| Voting Intentions | Probability | Accumulated | Special Marks |
|---|---|---|---|
| 0.0–0.5% | 0% | 100% | Last Result |
| 0.5–1.5% | 0% | 100% | |
| 1.5–2.5% | 0% | 100% | |
| 2.5–3.5% | 0% | 100% | |
| 3.5–4.5% | 0% | 100% | |
| 4.5–5.5% | 0% | 100% | |
| 5.5–6.5% | 0% | 100% | |
| 6.5–7.5% | 0% | 100% | |
| 7.5–8.5% | 2% | 100% | |
| 8.5–9.5% | 19% | 98% | |
| 9.5–10.5% | 39% | 79% | Median |
| 10.5–11.5% | 26% | 40% | |
| 11.5–12.5% | 10% | 15% | |
| 12.5–13.5% | 4% | 5% | |
| 13.5–14.5% | 0.9% | 1.0% | |
| 14.5–15.5% | 0.1% | 0.1% | |
| 15.5–16.5% | 0% | 0% |
Christlich Demokratische Union Deutschlands (EPP)
For a full overview of the results for this party, see the Christlich Demokratische Union Deutschlands (EPP) page.
| Voting Intentions | Probability | Accumulated | Special Marks |
|---|---|---|---|
| 0.0–0.5% | 0% | 100% | Last Result |
| 0.5–1.5% | 0% | 100% | |
| 1.5–2.5% | 0% | 100% | |
| 2.5–3.5% | 0% | 100% | |
| 3.5–4.5% | 0% | 100% | |
| 4.5–5.5% | 0% | 100% | |
| 5.5–6.5% | 0% | 100% | |
| 6.5–7.5% | 0% | 100% | |
| 7.5–8.5% | 0% | 100% | |
| 8.5–9.5% | 0% | 100% | |
| 9.5–10.5% | 0% | 100% | |
| 10.5–11.5% | 0% | 100% | |
| 11.5–12.5% | 0% | 100% | |
| 12.5–13.5% | 0% | 100% | |
| 13.5–14.5% | 0% | 100% | |
| 14.5–15.5% | 0.1% | 100% | |
| 15.5–16.5% | 0.9% | 99.9% | |
| 16.5–17.5% | 4% | 99.0% | |
| 17.5–18.5% | 11% | 95% | |
| 18.5–19.5% | 23% | 84% | |
| 19.5–20.5% | 27% | 62% | Median |
| 20.5–21.5% | 21% | 34% | |
| 21.5–22.5% | 10% | 13% | |
| 22.5–23.5% | 3% | 4% | |
| 23.5–24.5% | 0.6% | 0.7% | |
| 24.5–25.5% | 0.1% | 0.1% | |
| 25.5–26.5% | 0% | 0% |
Christlich-Soziale Union in Bayern (EPP)
For a full overview of the results for this party, see the Christlich-Soziale Union in Bayern (EPP) page.
| Voting Intentions | Probability | Accumulated | Special Marks |
|---|---|---|---|
| 0.0–0.5% | 0% | 100% | Last Result |
| 0.5–1.5% | 0% | 100% | |
| 1.5–2.5% | 0% | 100% | |
| 2.5–3.5% | 0.2% | 100% | |
| 3.5–4.5% | 9% | 99.8% | |
| 4.5–5.5% | 44% | 91% | Median |
| 5.5–6.5% | 37% | 47% | |
| 6.5–7.5% | 10% | 10% | |
| 7.5–8.5% | 0.7% | 0.7% | |
| 8.5–9.5% | 0% | 0% |
Partei Mensch Umwelt Tierschutz (GUE/NGL)
For a full overview of the results for this party, see the Partei Mensch Umwelt Tierschutz (GUE/NGL) page.
| Voting Intentions | Probability | Accumulated | Special Marks |
|---|---|---|---|
| 0.0–0.5% | 2% | 100% | Last Result |
| 0.5–1.5% | 71% | 98% | Median |
| 1.5–2.5% | 26% | 27% | |
| 2.5–3.5% | 0.5% | 0.5% | |
| 3.5–4.5% | 0% | 0% |
Bündnis 90/Die Grünen (Greens/EFA)
For a full overview of the results for this party, see the Bündnis 90/Die Grünen (Greens/EFA) page.
| Voting Intentions | Probability | Accumulated | Special Marks |
|---|---|---|---|
| 0.0–0.5% | 0% | 100% | Last Result |
| 0.5–1.5% | 0% | 100% | |
| 1.5–2.5% | 0% | 100% | |
| 2.5–3.5% | 0% | 100% | |
| 3.5–4.5% | 0% | 100% | |
| 4.5–5.5% | 0% | 100% | |
| 5.5–6.5% | 0% | 100% | |
| 6.5–7.5% | 0% | 100% | |
| 7.5–8.5% | 0% | 100% | |
| 8.5–9.5% | 0.8% | 100% | |
| 9.5–10.5% | 9% | 99.2% | |
| 10.5–11.5% | 28% | 90% | |
| 11.5–12.5% | 32% | 62% | Median |
| 12.5–13.5% | 20% | 30% | |
| 13.5–14.5% | 8% | 10% | |
| 14.5–15.5% | 2% | 2% | |
| 15.5–16.5% | 0.3% | 0.3% | |
| 16.5–17.5% | 0% | 0% |
Freie Wähler (RE)
For a full overview of the results for this party, see the Freie Wähler (RE) page.
| Voting Intentions | Probability | Accumulated | Special Marks |
|---|---|---|---|
| 0.0–0.5% | 0% | 100% | Last Result |
| 0.5–1.5% | 18% | 100% | |
| 1.5–2.5% | 61% | 82% | Median |
| 2.5–3.5% | 20% | 21% | |
| 3.5–4.5% | 1.0% | 1.0% | |
| 4.5–5.5% | 0% | 0% |
Volt Europa (Greens/EFA)
For a full overview of the results for this party, see the Volt Europa (Greens/EFA) page.
| Voting Intentions | Probability | Accumulated | Special Marks |
|---|---|---|---|
| 0.0–0.5% | 8% | 100% | Last Result |
| 0.5–1.5% | 86% | 92% | Median |
| 1.5–2.5% | 5% | 5% | |
| 2.5–3.5% | 0% | 0% |
Freie Demokratische Partei (RE)
For a full overview of the results for this party, see the Freie Demokratische Partei (RE) page.
| Voting Intentions | Probability | Accumulated | Special Marks |
|---|---|---|---|
| 0.0–0.5% | 0% | 100% | Last Result |
| 0.5–1.5% | 0% | 100% | |
| 1.5–2.5% | 4% | 100% | |
| 2.5–3.5% | 45% | 96% | |
| 3.5–4.5% | 42% | 51% | Median |
| 4.5–5.5% | 8% | 9% | |
| 5.5–6.5% | 0.3% | 0.3% | |
| 6.5–7.5% | 0% | 0% |
Seats
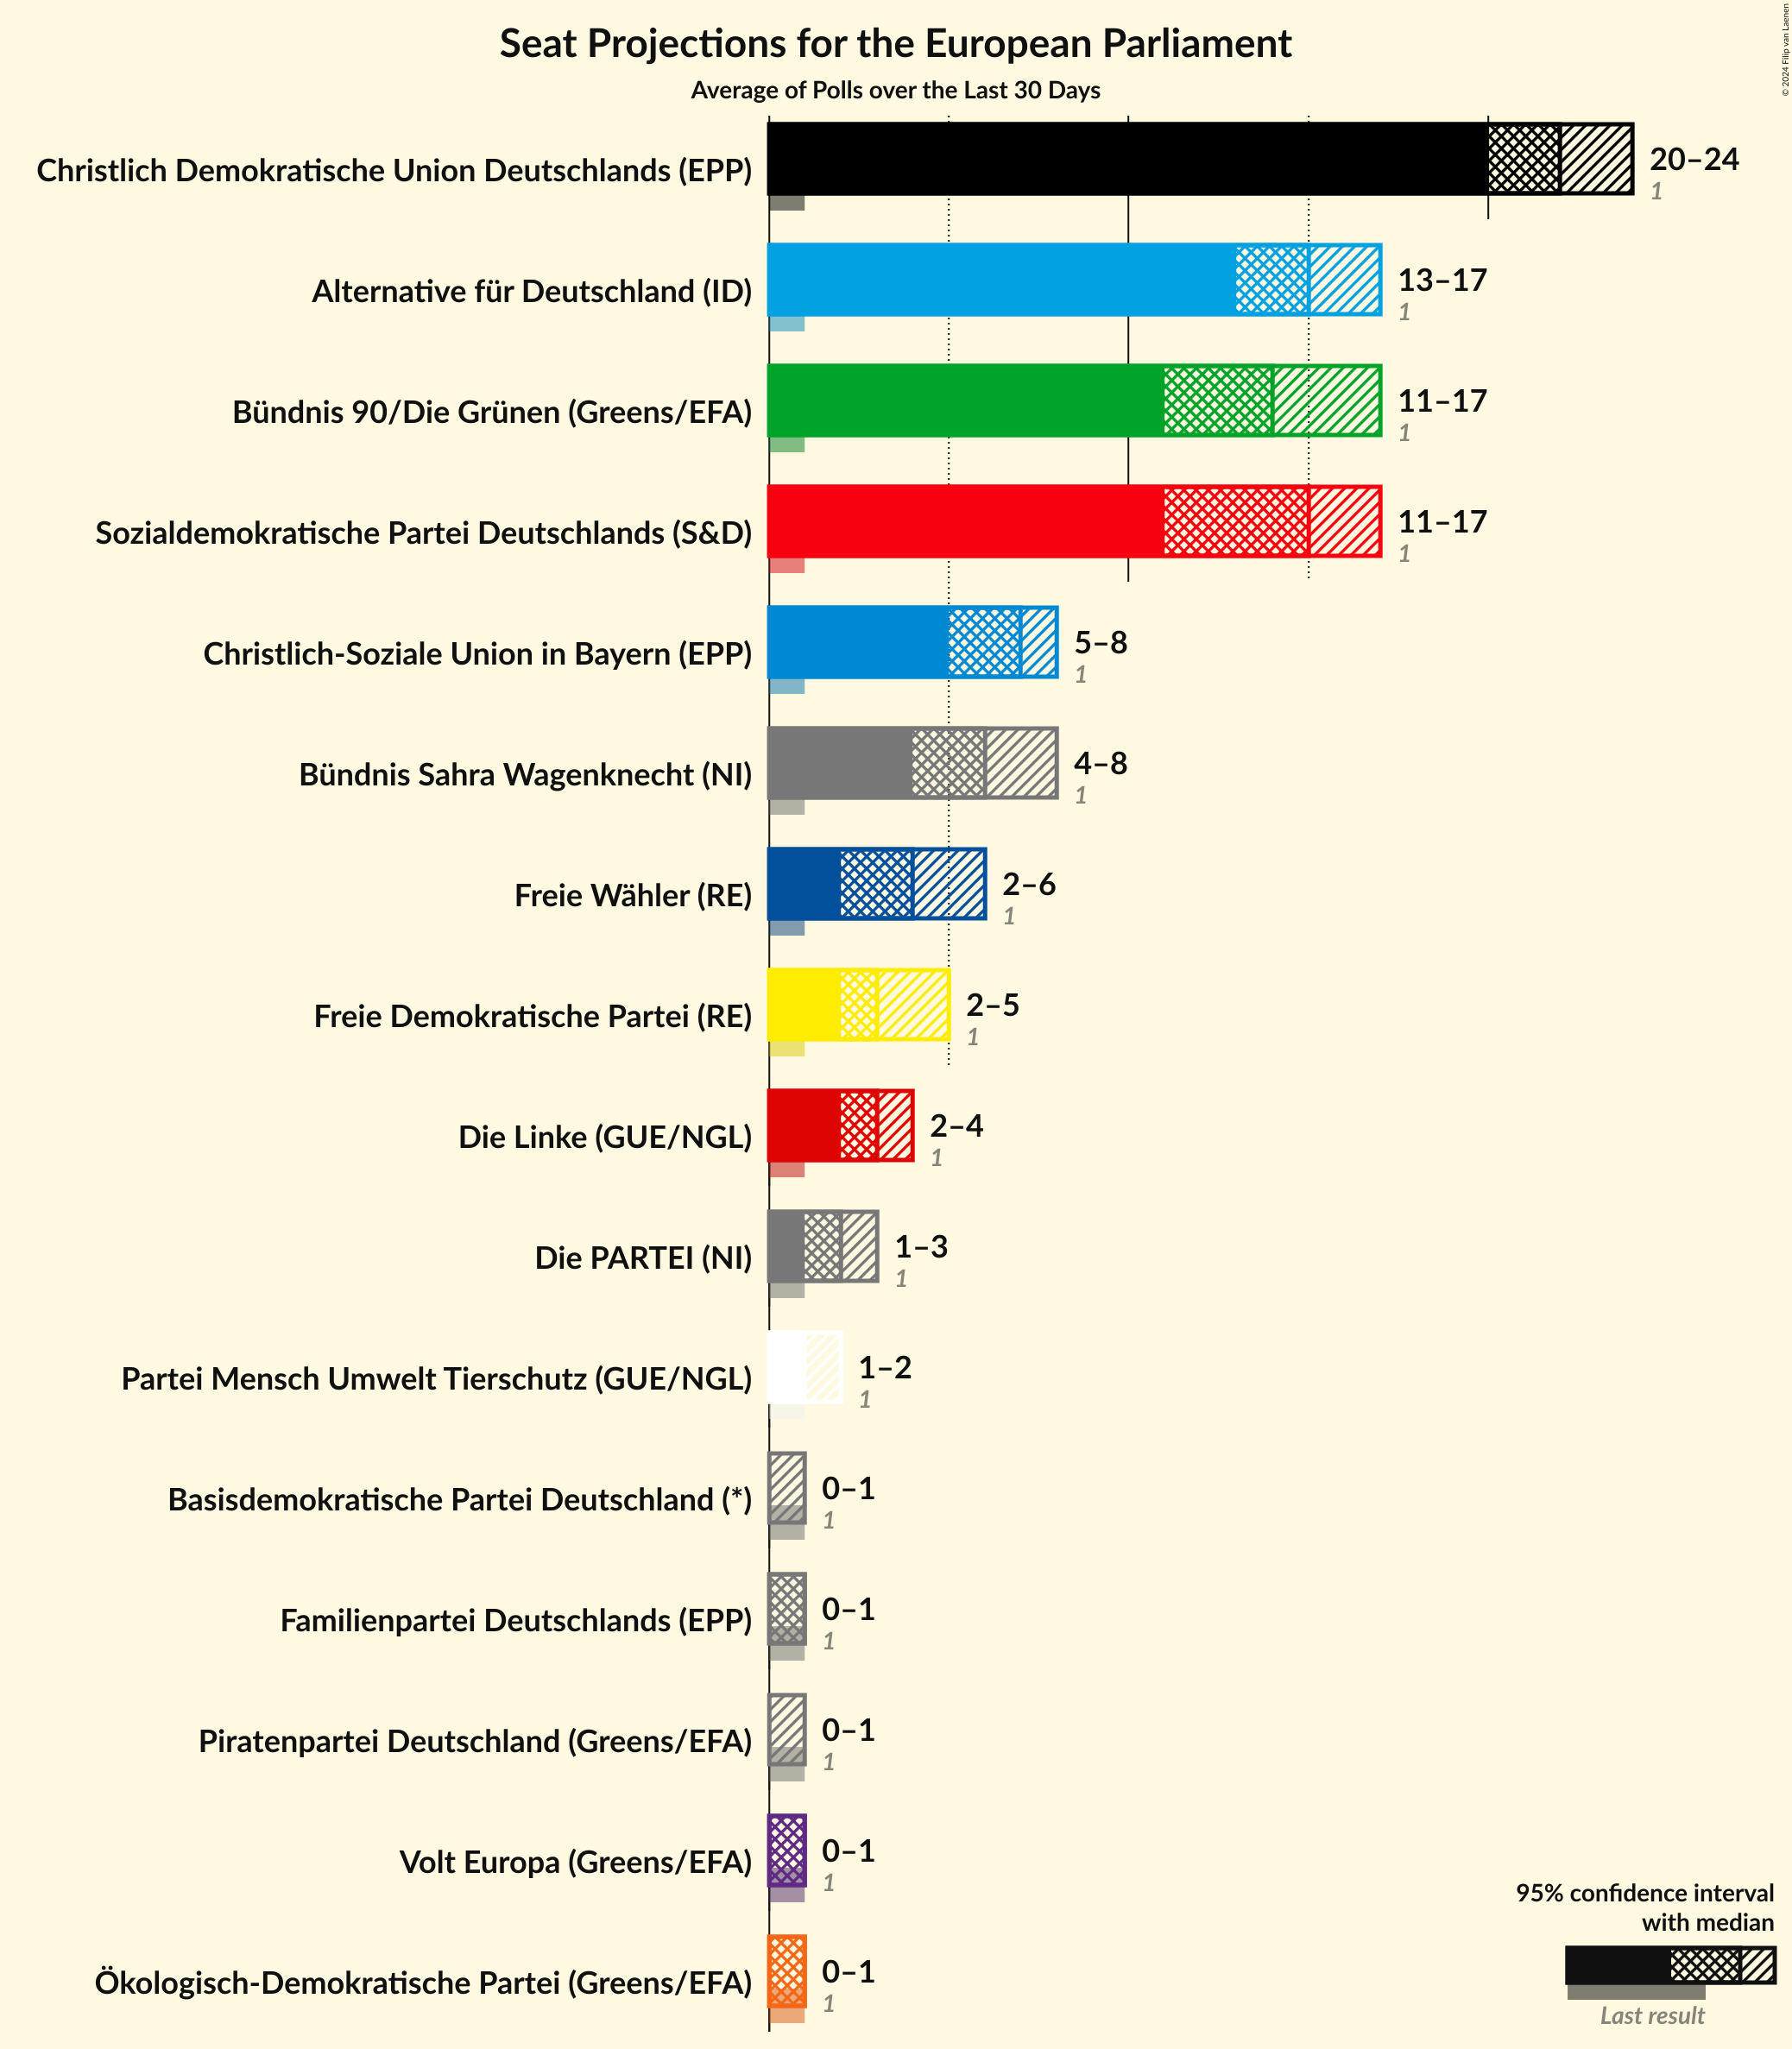
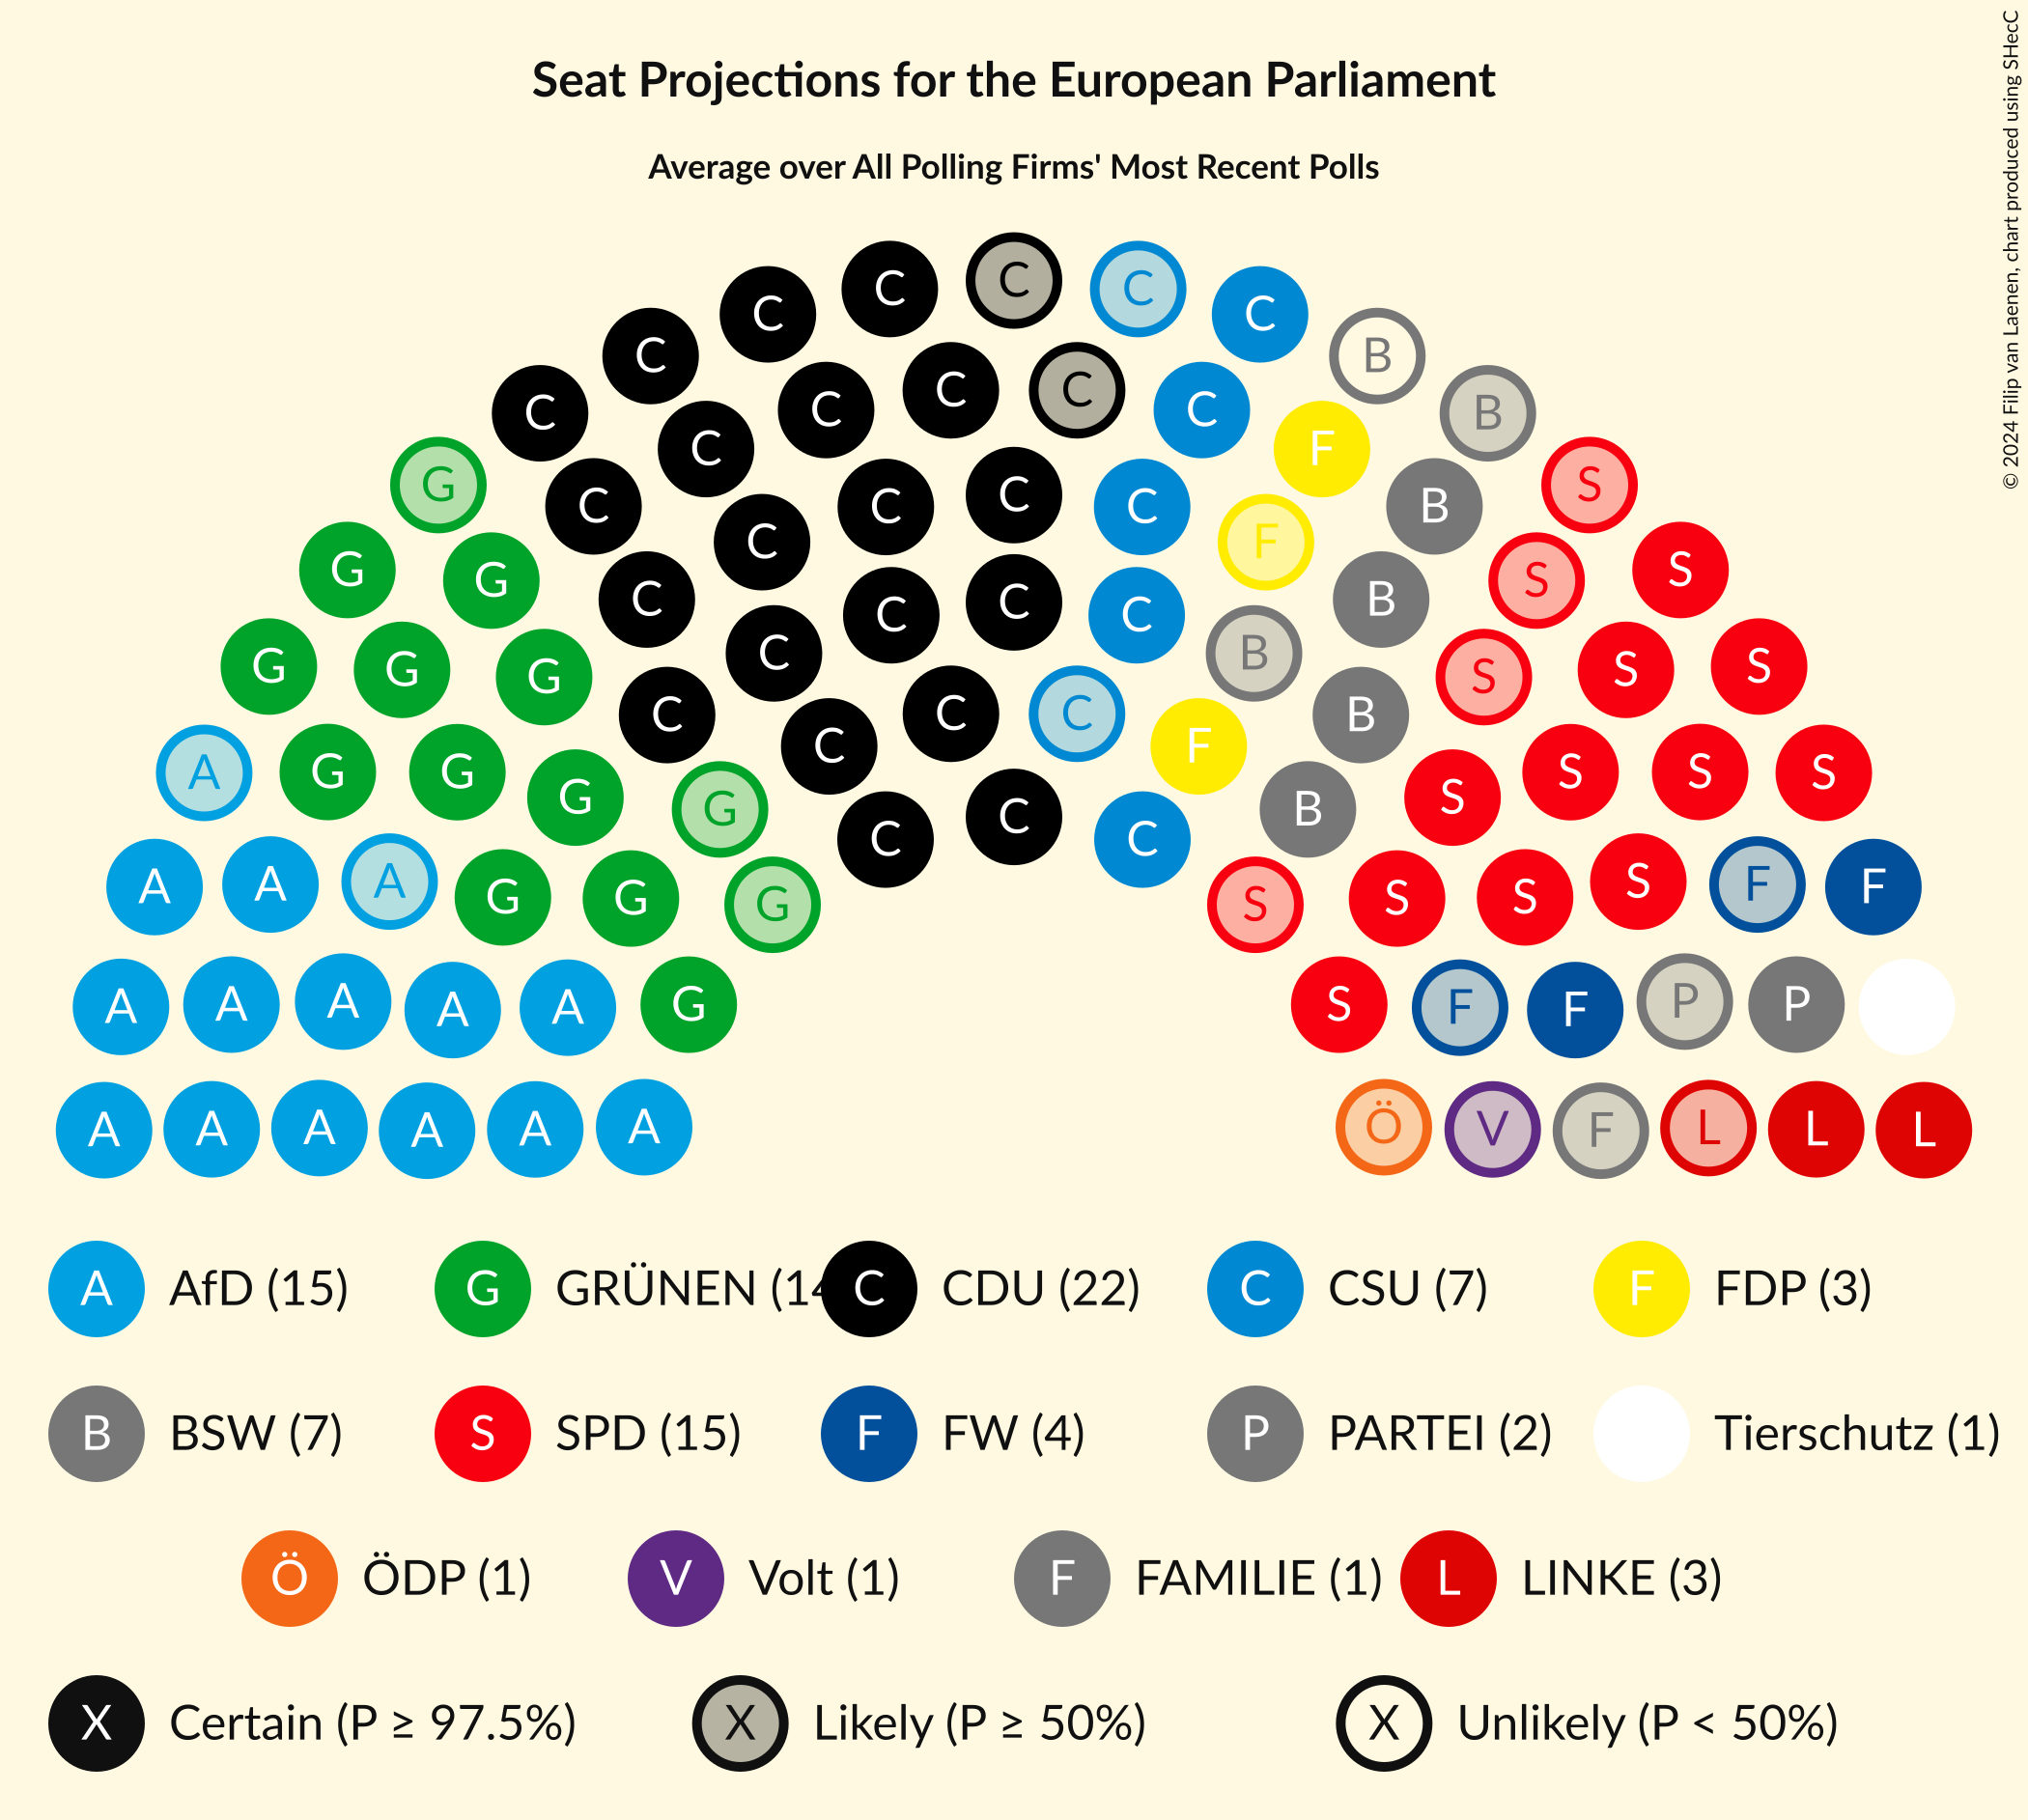
Confidence Intervals
Die Linke (GUE/NGL)
For a full overview of the results for this party, see the Die Linke (GUE/NGL) page.
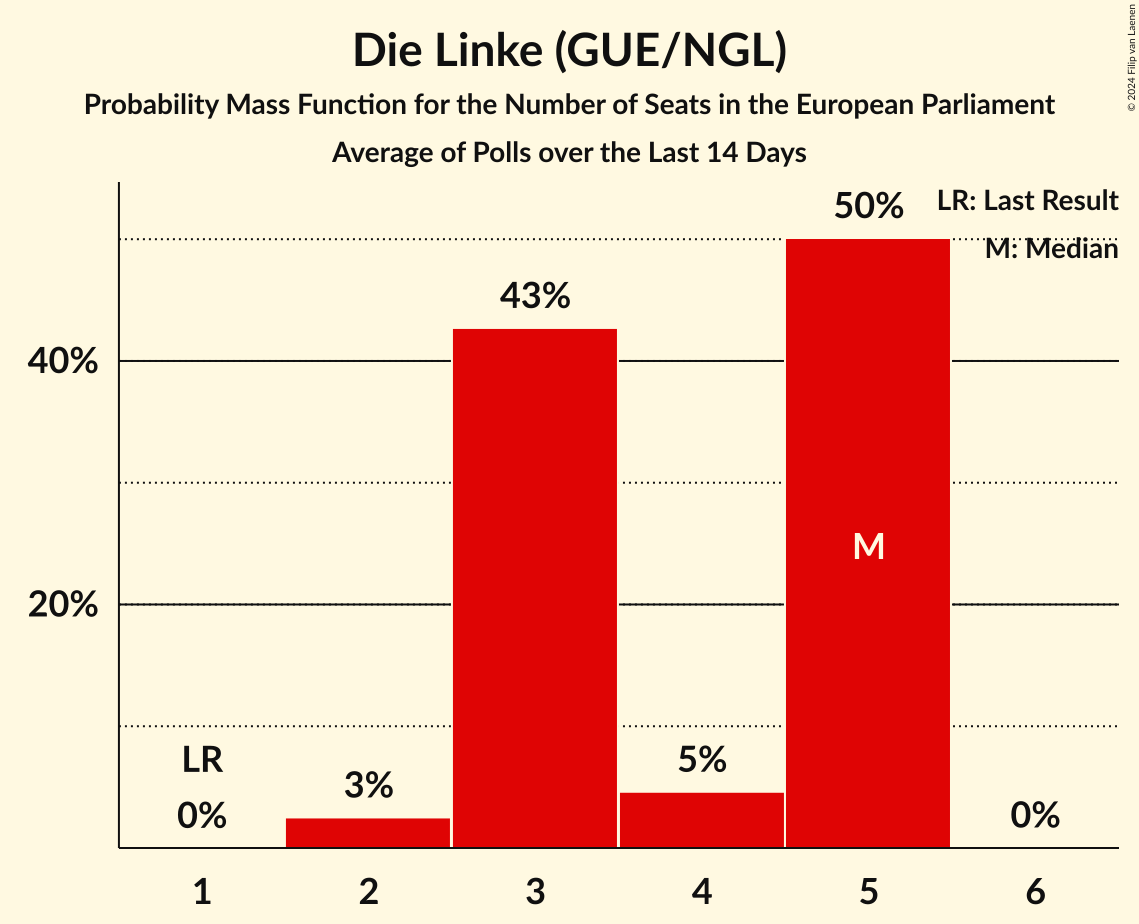
| Number of Seats | Probability | Accumulated | Special Marks |
|---|---|---|---|
| 0 | 0% | 100% | Last Result |
| 1 | 0% | 100% | |
| 2 | 0% | 100% | |
| 3 | 0% | 100% | |
| 4 | 0% | 100% | |
| 5 | 0% | 100% | |
| 6 | 0% | 100% | |
| 7 | 0.2% | 100% | |
| 8 | 6% | 99.8% | |
| 9 | 30% | 94% | |
| 10 | 35% | 63% | Median |
| 11 | 21% | 28% | |
| 12 | 2% | 7% | |
| 13 | 5% | 5% | |
| 14 | 0.4% | 0.4% | |
| 15 | 0% | 0% |
Partei Mensch Umwelt Tierschutz (GUE/NGL)
For a full overview of the results for this party, see the Partei Mensch Umwelt Tierschutz (GUE/NGL) page.
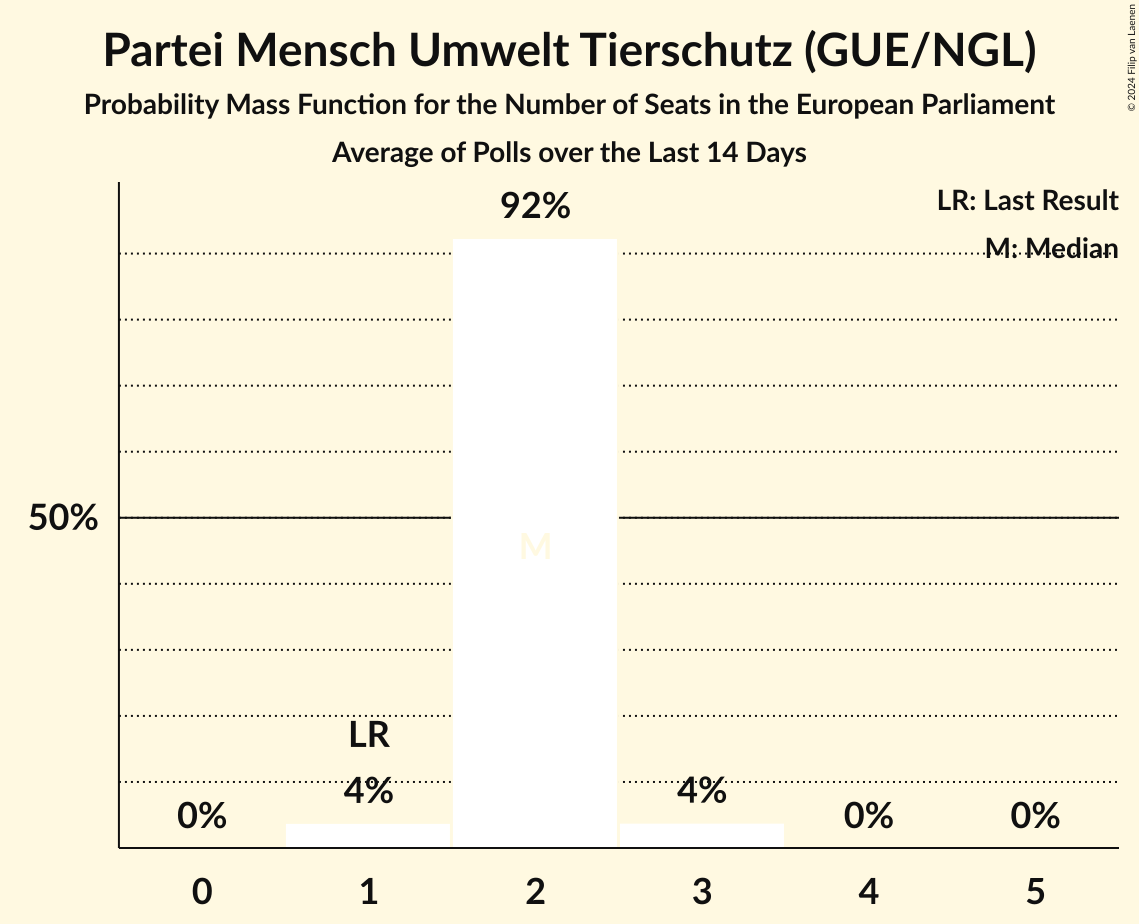
| Number of Seats | Probability | Accumulated | Special Marks |
|---|---|---|---|
| 0 | 1.1% | 100% | Last Result |
| 1 | 66% | 98.9% | Median |
| 2 | 32% | 32% | |
| 3 | 0.7% | 0.7% | |
| 4 | 0% | 0% |
Bündnis 90/Die Grünen (Greens/EFA)
For a full overview of the results for this party, see the Bündnis 90/Die Grünen (Greens/EFA) page.
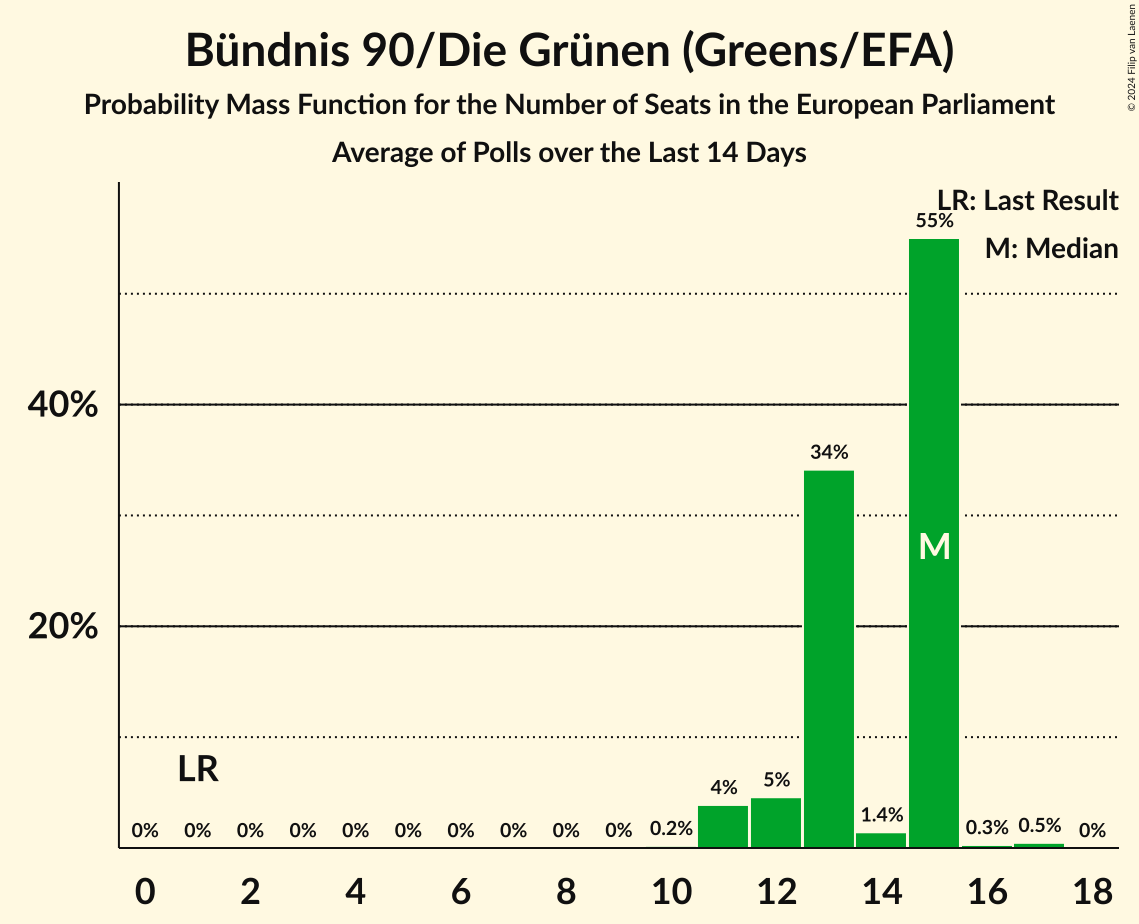
| Number of Seats | Probability | Accumulated | Special Marks |
|---|---|---|---|
| 0 | 0% | 100% | Last Result |
| 1 | 0% | 100% | |
| 2 | 0% | 100% | |
| 3 | 0% | 100% | |
| 4 | 0% | 100% | |
| 5 | 0% | 100% | |
| 6 | 0% | 100% | |
| 7 | 0% | 100% | |
| 8 | 0% | 100% | |
| 9 | 5% | 100% | |
| 10 | 14% | 95% | |
| 11 | 43% | 81% | Median |
| 12 | 20% | 38% | |
| 13 | 11% | 18% | |
| 14 | 7% | 7% | |
| 15 | 0.2% | 0.2% | |
| 16 | 0% | 0% |
Volt Europa (Greens/EFA)
For a full overview of the results for this party, see the Volt Europa (Greens/EFA) page.
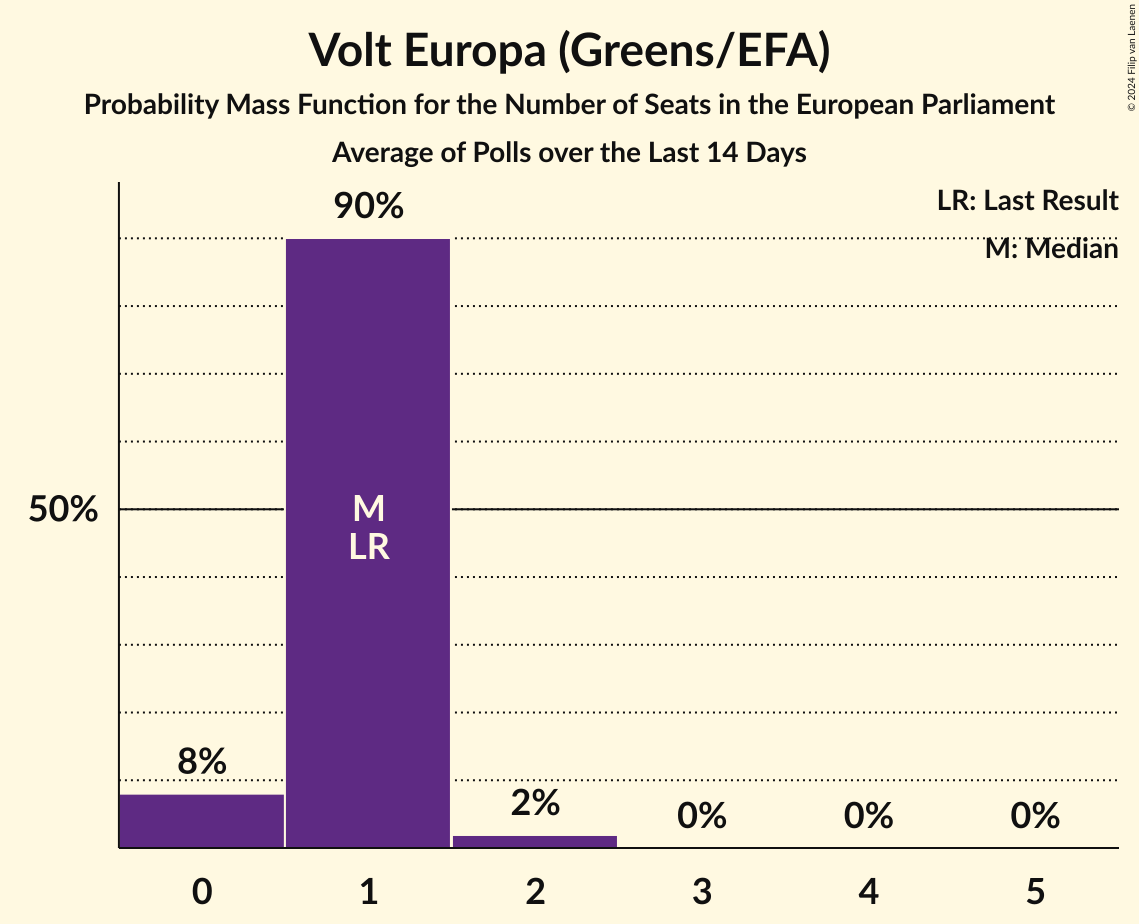
| Number of Seats | Probability | Accumulated | Special Marks |
|---|---|---|---|
| 0 | 8% | 100% | Last Result |
| 1 | 79% | 92% | Median |
| 2 | 13% | 13% | |
| 3 | 0% | 0% |
Piratenpartei Deutschland (Greens/EFA)
For a full overview of the results for this party, see the Piratenpartei Deutschland (Greens/EFA) page.
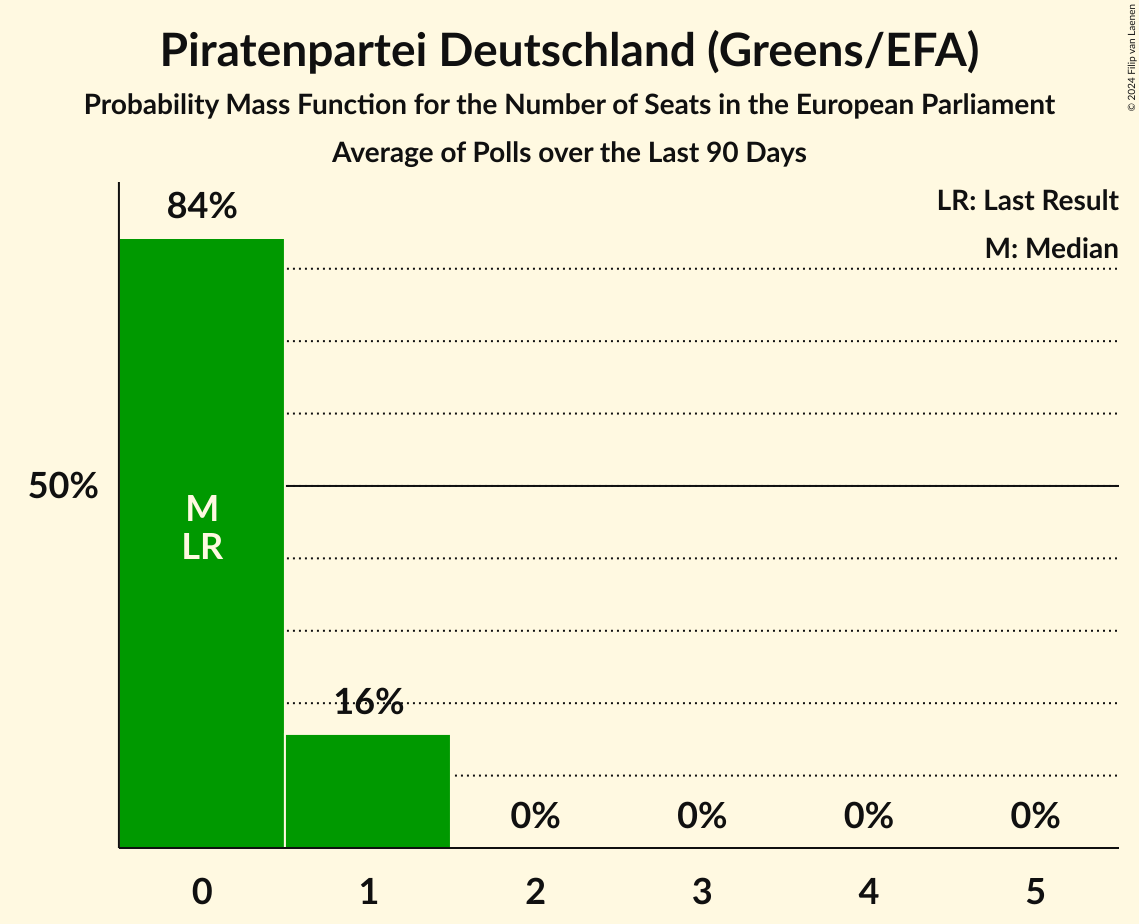
Sozialdemokratische Partei Deutschlands (S&D)
For a full overview of the results for this party, see the Sozialdemokratische Partei Deutschlands (S&D) page.
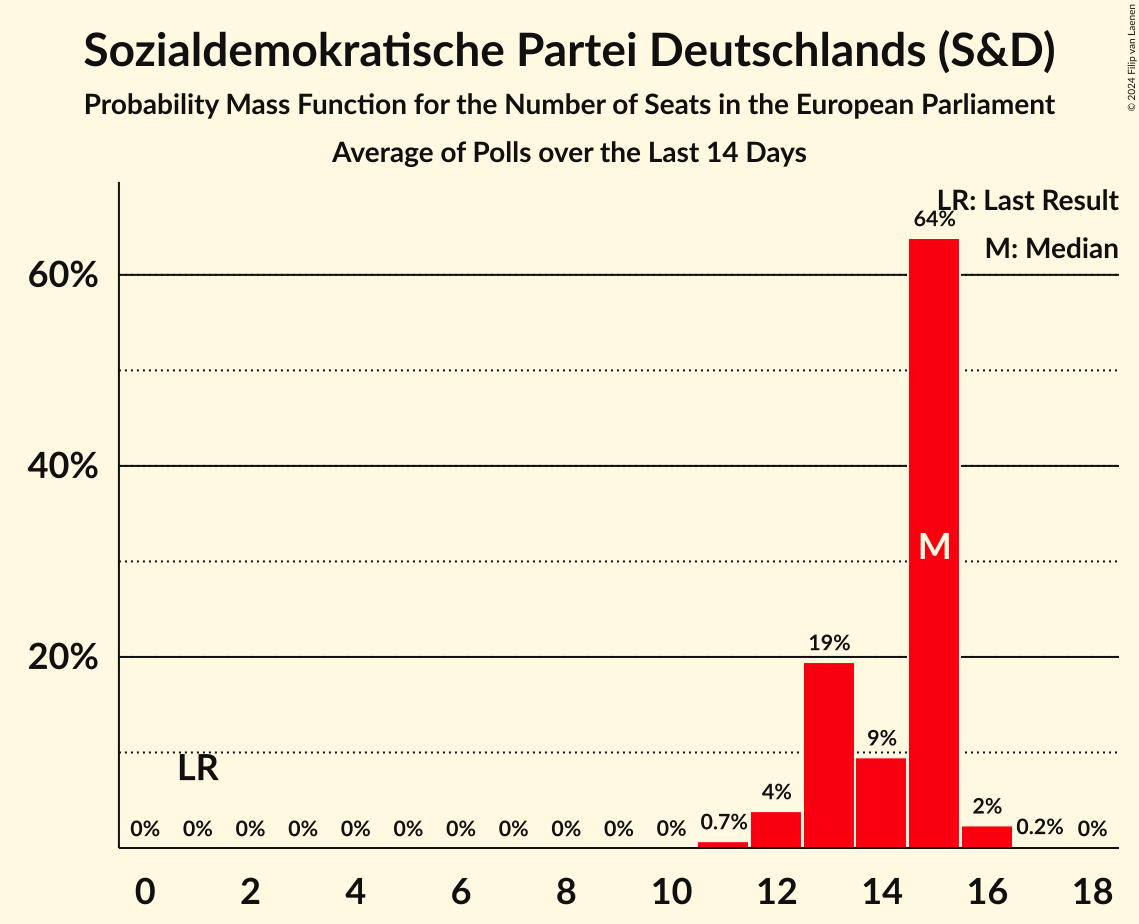
| Number of Seats | Probability | Accumulated | Special Marks |
|---|---|---|---|
| 0 | 0% | 100% | Last Result |
| 1 | 0% | 100% | |
| 2 | 0% | 100% | |
| 3 | 0% | 100% | |
| 4 | 0% | 100% | |
| 5 | 0% | 100% | |
| 6 | 0% | 100% | |
| 7 | 0% | 100% | |
| 8 | 0% | 100% | |
| 9 | 0% | 100% | |
| 10 | 0% | 100% | |
| 11 | 0.4% | 100% | |
| 12 | 5% | 99.6% | |
| 13 | 12% | 95% | |
| 14 | 37% | 83% | Median |
| 15 | 29% | 46% | |
| 16 | 11% | 18% | |
| 17 | 6% | 6% | |
| 18 | 0.2% | 0.2% | |
| 19 | 0% | 0% |
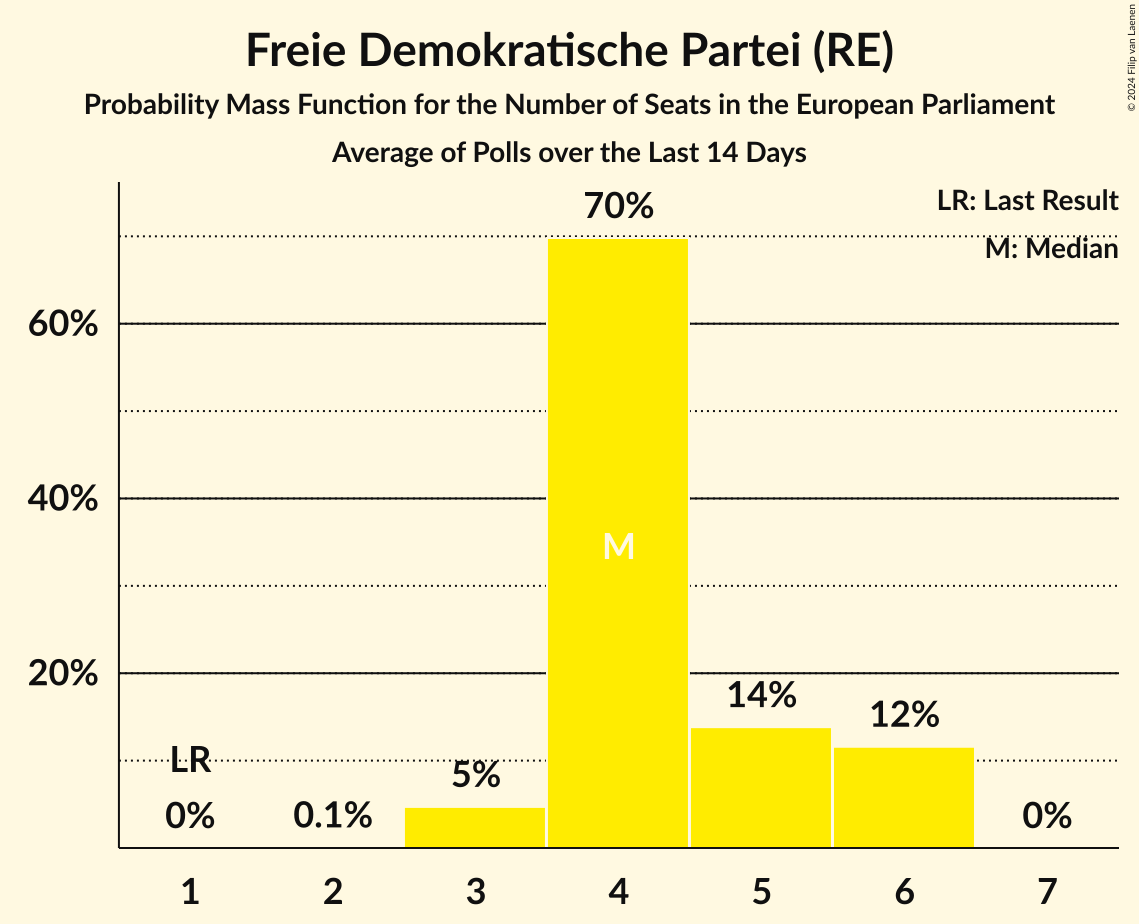
Freie Demokratische Partei (RE)
For a full overview of the results for this party, see the Freie Demokratische Partei (RE) page.
| Number of Seats | Probability | Accumulated | Special Marks |
|---|---|---|---|
| 0 | 0% | 100% | Last Result |
| 1 | 0% | 100% | |
| 2 | 9% | 100% | |
| 3 | 44% | 91% | Median |
| 4 | 40% | 47% | |
| 5 | 7% | 7% | |
| 6 | 0.1% | 0.1% | |
| 7 | 0% | 0% |
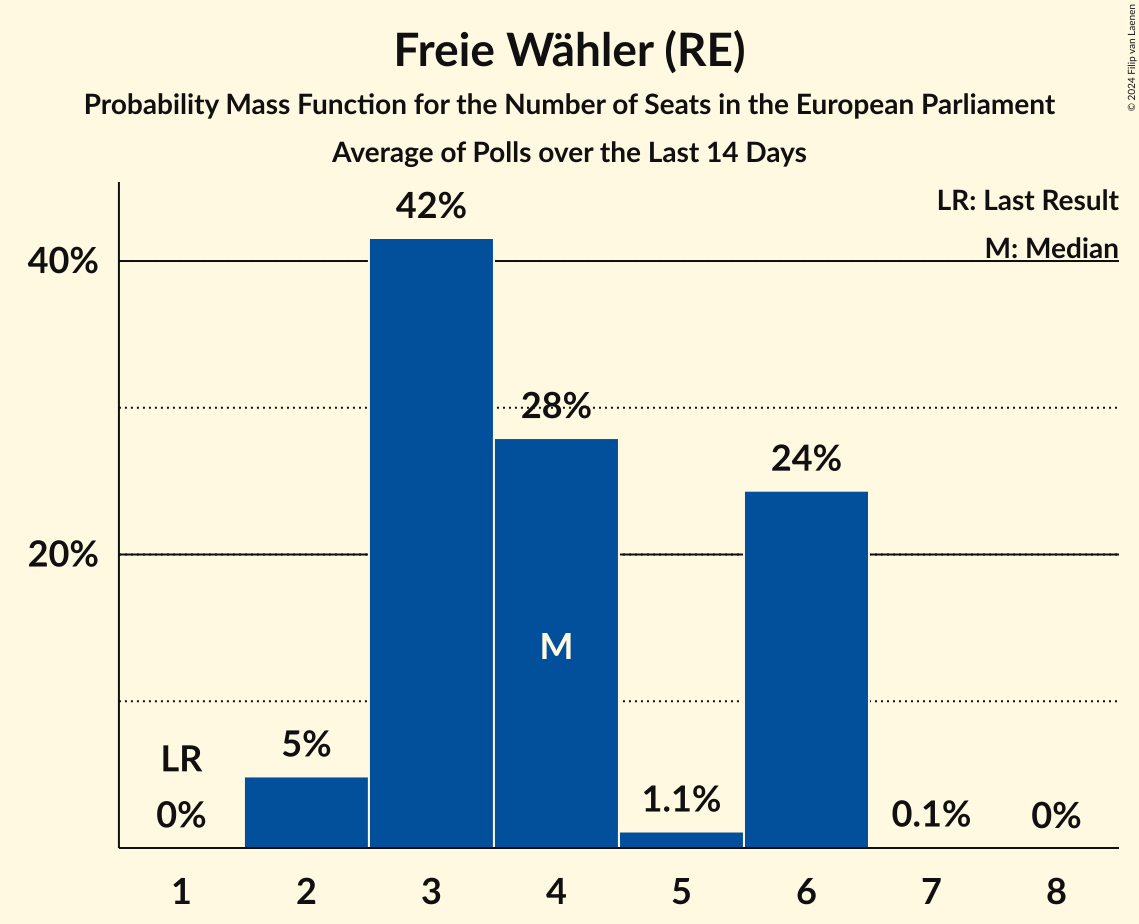
Freie Wähler (RE)
For a full overview of the results for this party, see the Freie Wähler (RE) page.
| Number of Seats | Probability | Accumulated | Special Marks |
|---|---|---|---|
| 0 | 0% | 100% | Last Result |
| 1 | 11% | 100% | |
| 2 | 69% | 89% | Median |
| 3 | 20% | 20% | |
| 4 | 0.3% | 0.3% | |
| 5 | 0% | 0% |
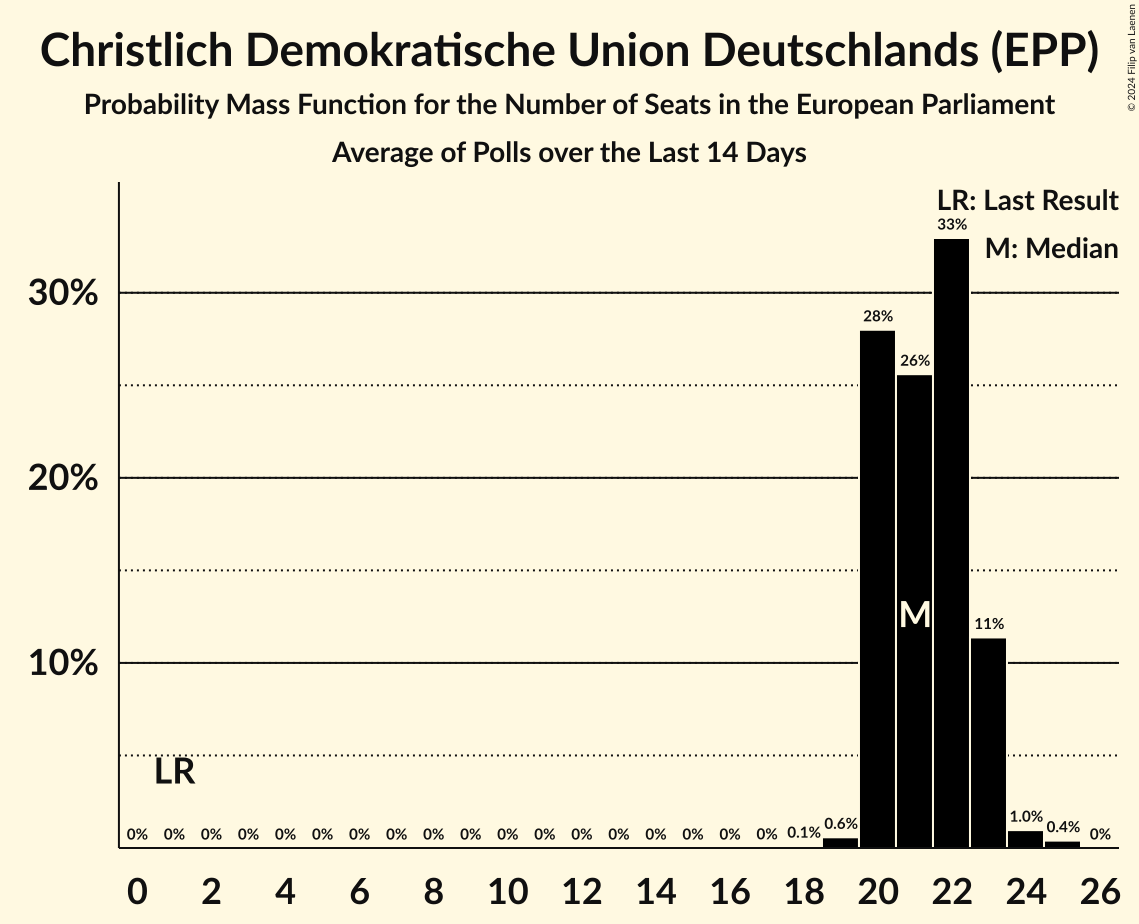
Christlich Demokratische Union Deutschlands (EPP)
For a full overview of the results for this party, see the Christlich Demokratische Union Deutschlands (EPP) page.
| Number of Seats | Probability | Accumulated | Special Marks |
|---|---|---|---|
| 0 | 0% | 100% | Last Result |
| 1 | 0% | 100% | |
| 2 | 0% | 100% | |
| 3 | 0% | 100% | |
| 4 | 0% | 100% | |
| 5 | 0% | 100% | |
| 6 | 0% | 100% | |
| 7 | 0% | 100% | |
| 8 | 0% | 100% | |
| 9 | 0% | 100% | |
| 10 | 0% | 100% | |
| 11 | 0% | 100% | |
| 12 | 0% | 100% | |
| 13 | 0% | 100% | |
| 14 | 0% | 100% | |
| 15 | 0.2% | 100% | |
| 16 | 5% | 99.7% | |
| 17 | 11% | 94% | |
| 18 | 24% | 84% | |
| 19 | 26% | 59% | Median |
| 20 | 22% | 33% | |
| 21 | 8% | 11% | |
| 22 | 3% | 3% | |
| 23 | 0.3% | 0.3% | |
| 24 | 0% | 0% |
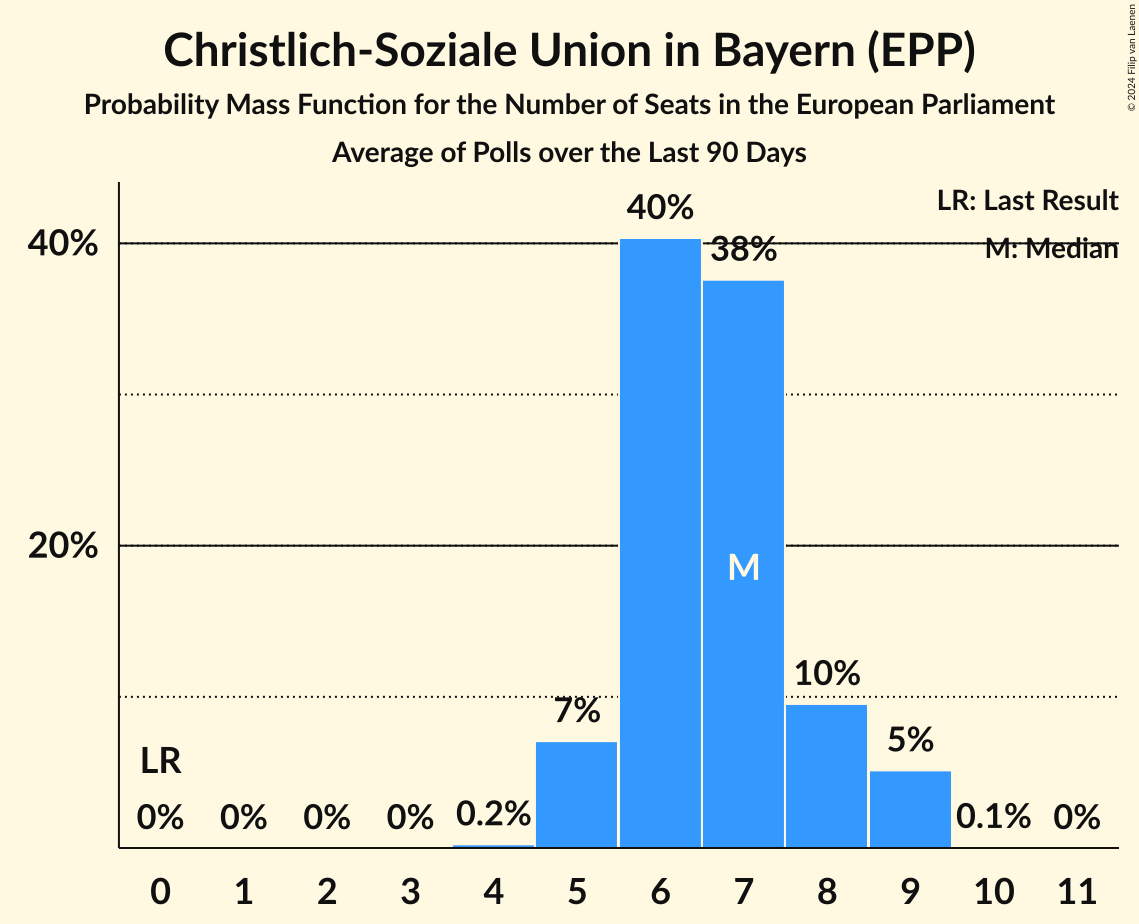
Christlich-Soziale Union in Bayern (EPP)
For a full overview of the results for this party, see the Christlich-Soziale Union in Bayern (EPP) page.
| Number of Seats | Probability | Accumulated | Special Marks |
|---|---|---|---|
| 0 | 0% | 100% | Last Result |
| 1 | 0% | 100% | |
| 2 | 0% | 100% | |
| 3 | 0.2% | 100% | |
| 4 | 12% | 99.8% | |
| 5 | 55% | 88% | Median |
| 6 | 26% | 33% | |
| 7 | 6% | 7% | |
| 8 | 0.3% | 0.3% | |
| 9 | 0% | 0% |
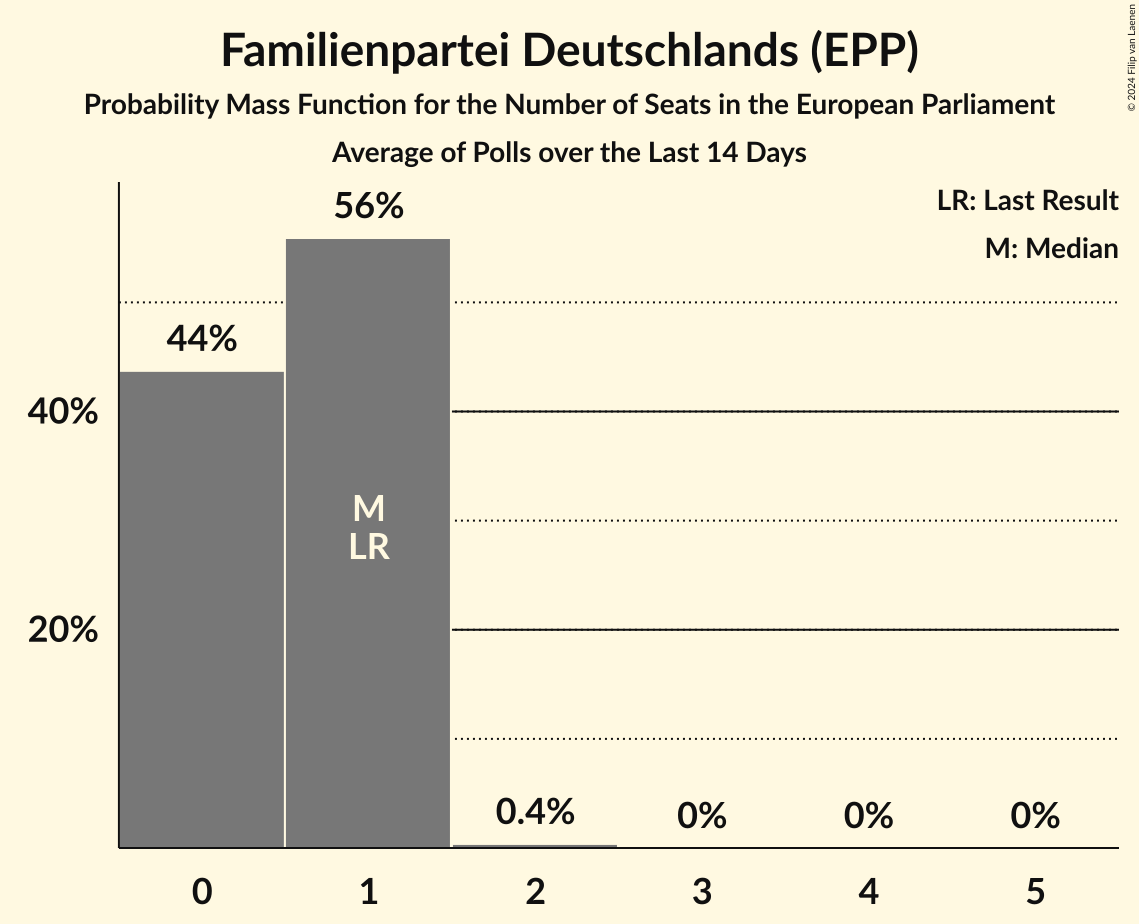
Familienpartei Deutschlands (EPP)
For a full overview of the results for this party, see the Familienpartei Deutschlands (EPP) page.
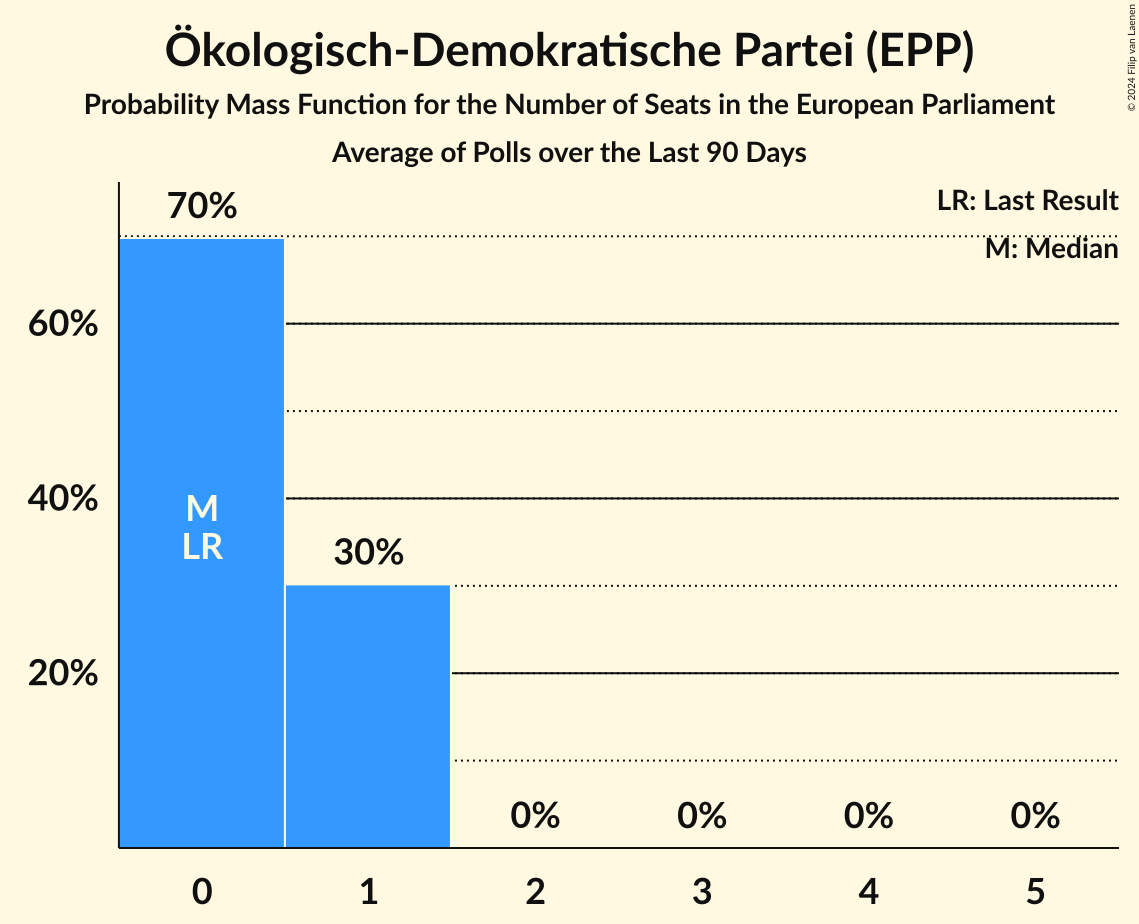
Ökologisch-Demokratische Partei (EPP)
For a full overview of the results for this party, see the Ökologisch-Demokratische Partei (EPP) page.
Alternative für Deutschland (ESN)
For a full overview of the results for this party, see the Alternative für Deutschland (ESN) page.
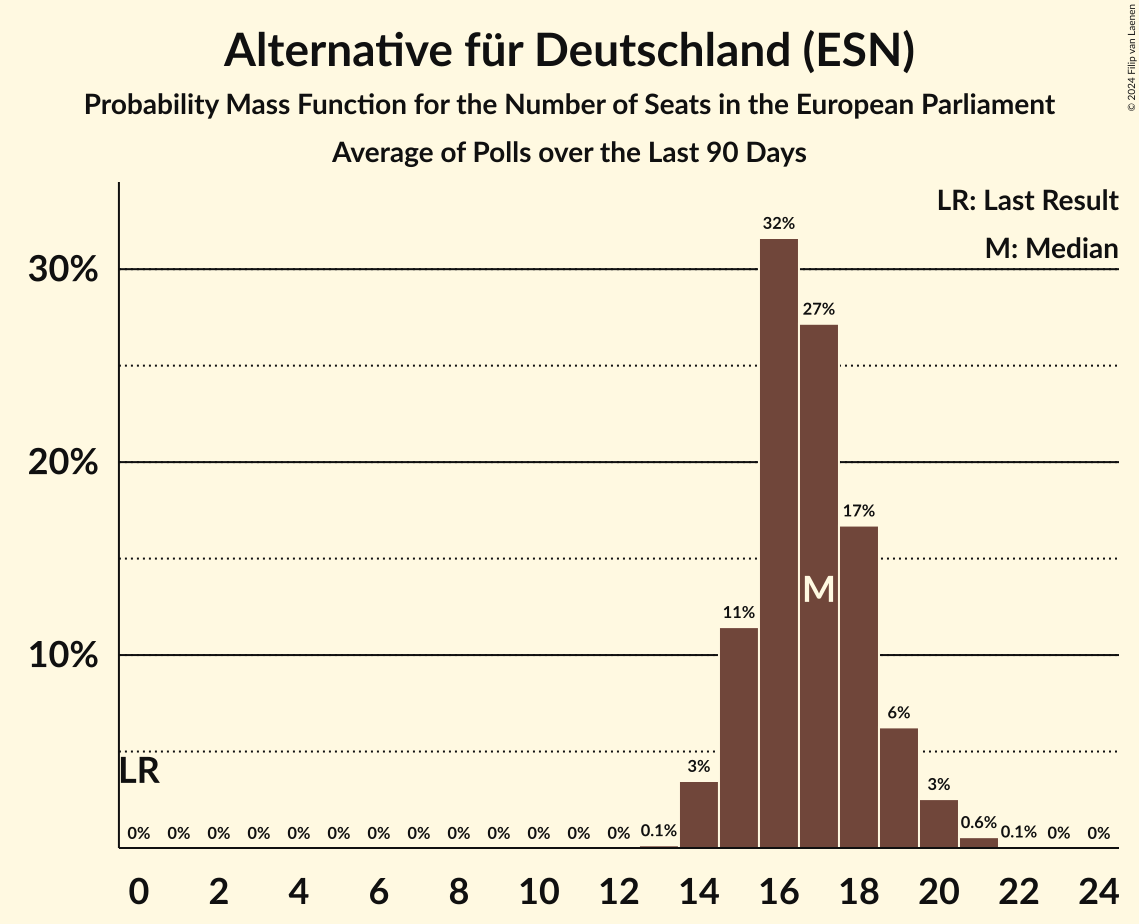
| Number of Seats | Probability | Accumulated | Special Marks |
|---|---|---|---|
| 0 | 0% | 100% | Last Result |
| 1 | 0% | 100% | |
| 2 | 0% | 100% | |
| 3 | 0% | 100% | |
| 4 | 0% | 100% | |
| 5 | 0% | 100% | |
| 6 | 0% | 100% | |
| 7 | 0% | 100% | |
| 8 | 0% | 100% | |
| 9 | 0% | 100% | |
| 10 | 0% | 100% | |
| 11 | 0% | 100% | |
| 12 | 0% | 100% | |
| 13 | 0% | 100% | |
| 14 | 0% | 100% | |
| 15 | 0% | 100% | |
| 16 | 0% | 100% | |
| 17 | 0% | 100% | |
| 18 | 0% | 100% | |
| 19 | 0% | 100% | |
| 20 | 0.7% | 100% | |
| 21 | 4% | 99.3% | |
| 22 | 17% | 95% | |
| 23 | 32% | 78% | Median |
| 24 | 28% | 45% | |
| 25 | 14% | 18% | |
| 26 | 3% | 4% | |
| 27 | 0.5% | 1.3% | |
| 28 | 0.7% | 0.7% | |
| 29 | 0% | 0% |
Die PARTEI (NI)
For a full overview of the results for this party, see the Die PARTEI (NI) page.
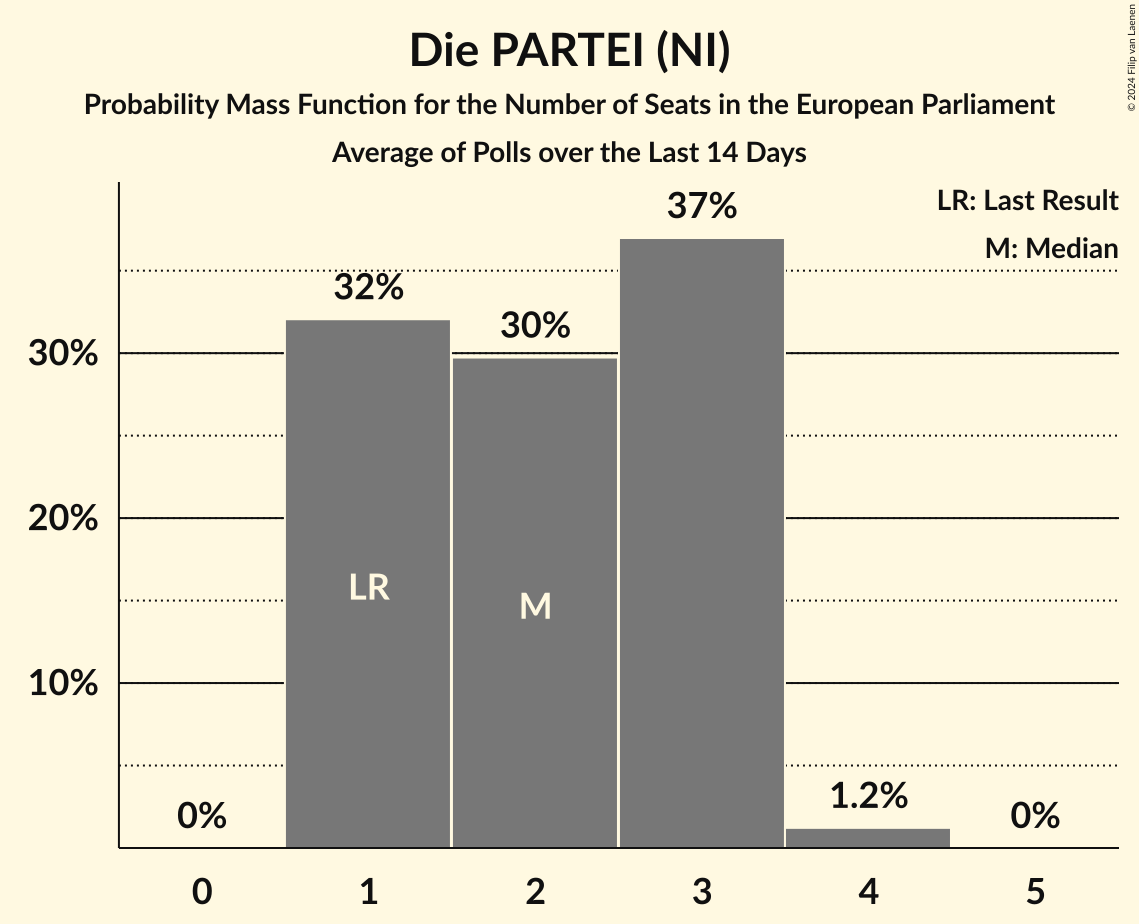
| Number of Seats | Probability | Accumulated | Special Marks |
|---|---|---|---|
| 0 | 21% | 100% | Last Result |
| 1 | 79% | 79% | Median |
| 2 | 0.3% | 0.3% | |
| 3 | 0% | 0% |
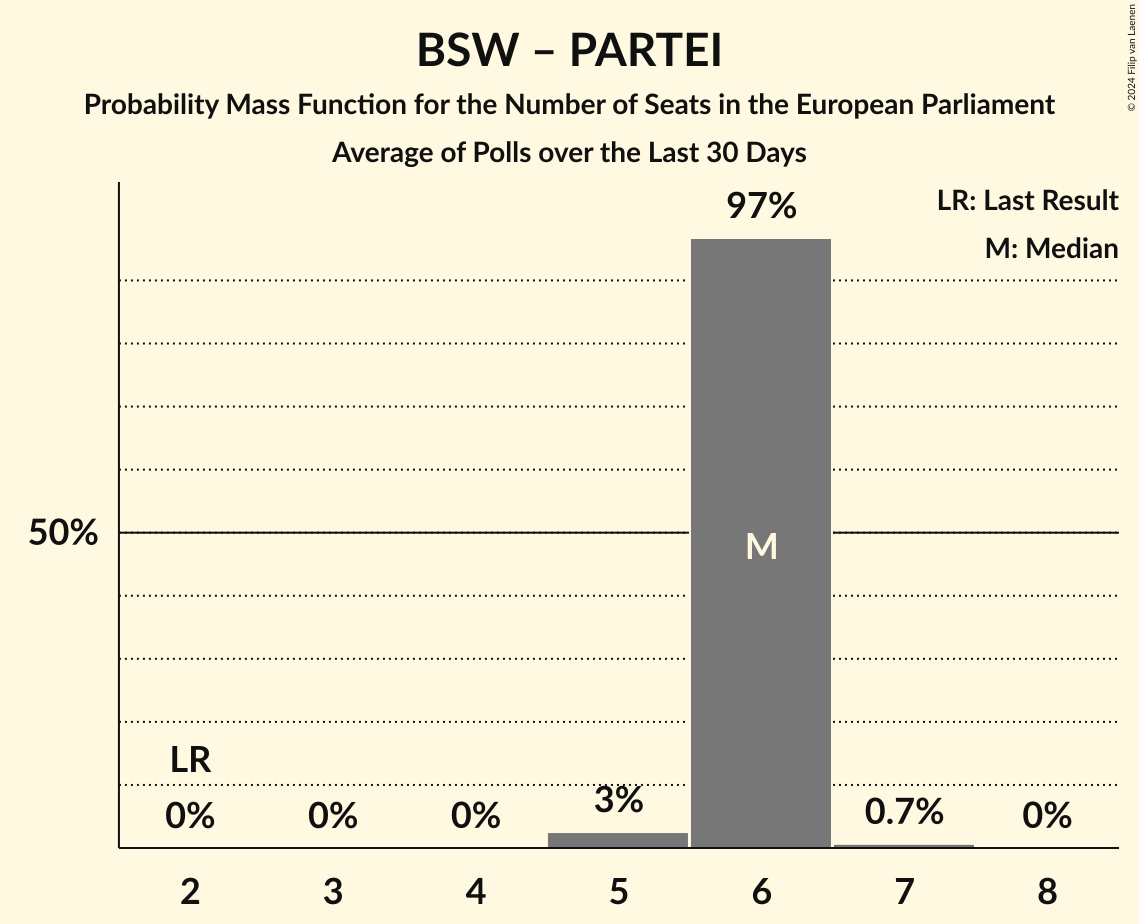
Bündnis Sahra Wagenknecht (NI)
For a full overview of the results for this party, see the Bündnis Sahra Wagenknecht (NI) page.
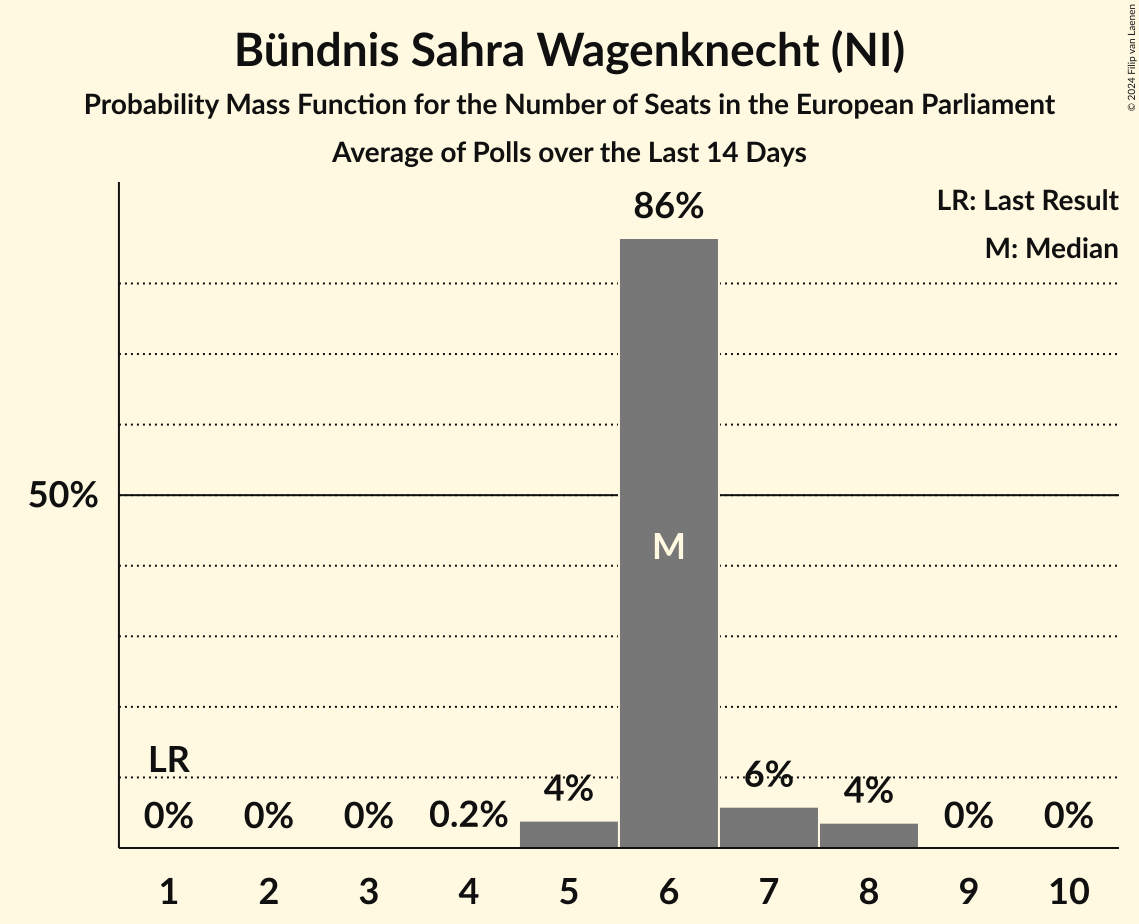
| Number of Seats | Probability | Accumulated | Special Marks |
|---|---|---|---|
| 0 | 12% | 100% | Last Result |
| 1 | 0.2% | 88% | |
| 2 | 10% | 87% | |
| 3 | 45% | 78% | Median |
| 4 | 28% | 33% | |
| 5 | 4% | 5% | |
| 6 | 0.4% | 0.4% | |
| 7 | 0% | 0% |
Basisdemokratische Partei Deutschland (*)
For a full overview of the results for this party, see the Basisdemokratische Partei Deutschland (*) page.
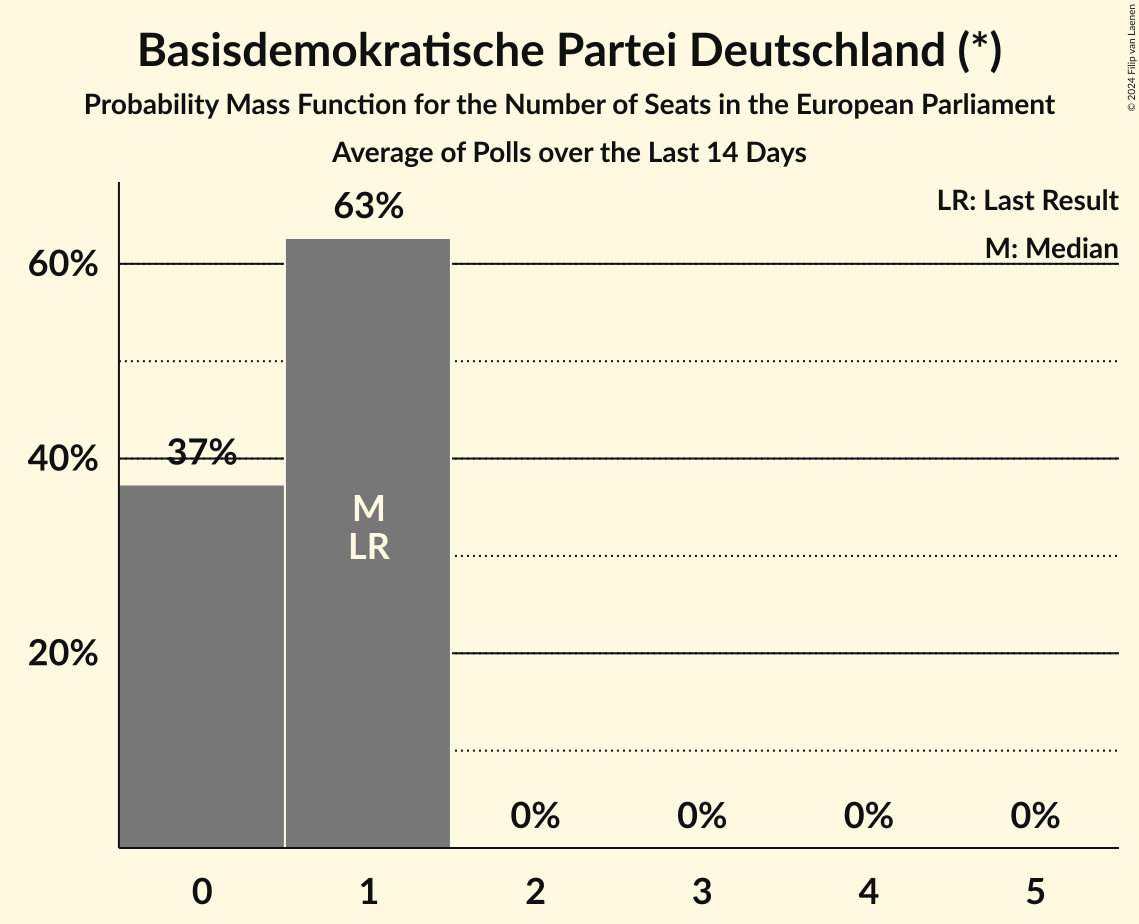
| Number of Seats | Probability | Accumulated | Special Marks |
|---|---|---|---|
| 0 | 93% | 100% | Last Result, Median |
| 1 | 7% | 7% | |
| 2 | 0% | 0% |
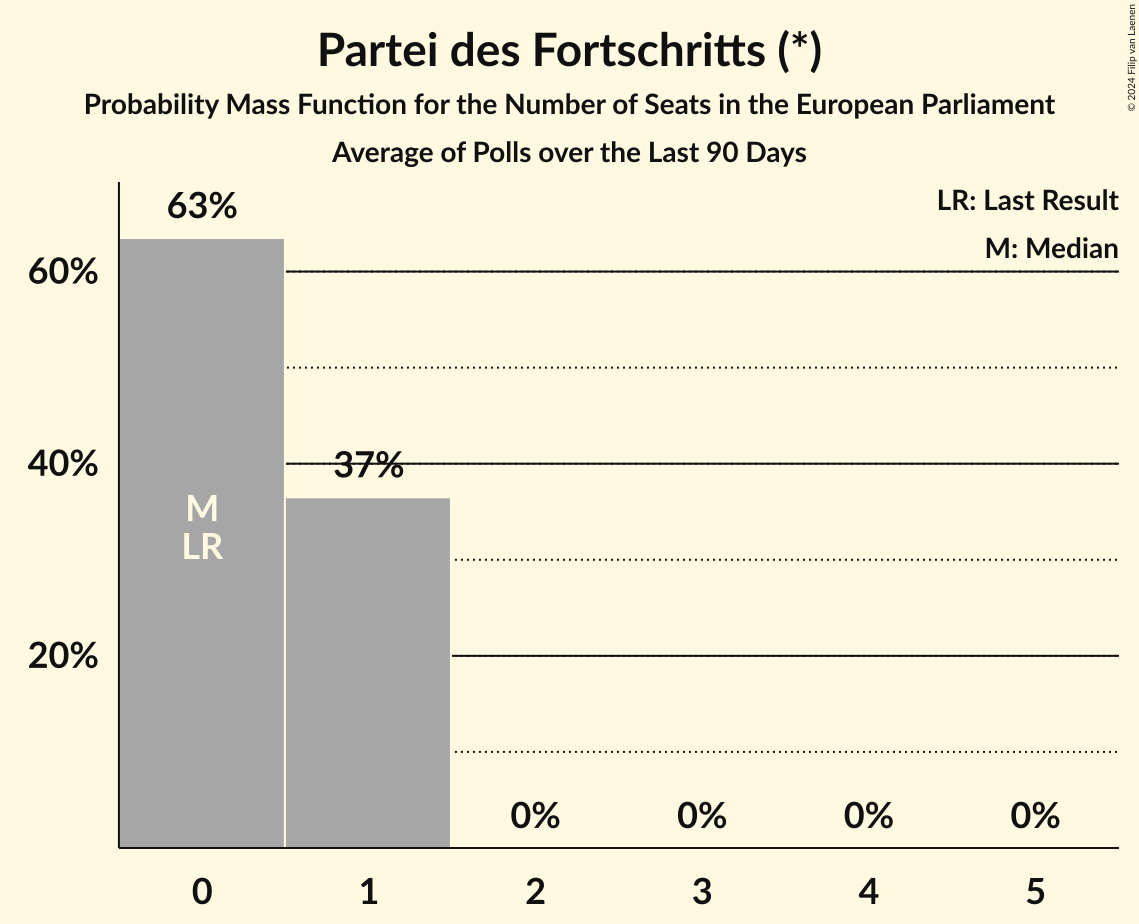
Partei des Fortschritts (*)
For a full overview of the results for this party, see the Partei des Fortschritts (*) page.
Coalitions
Confidence Intervals
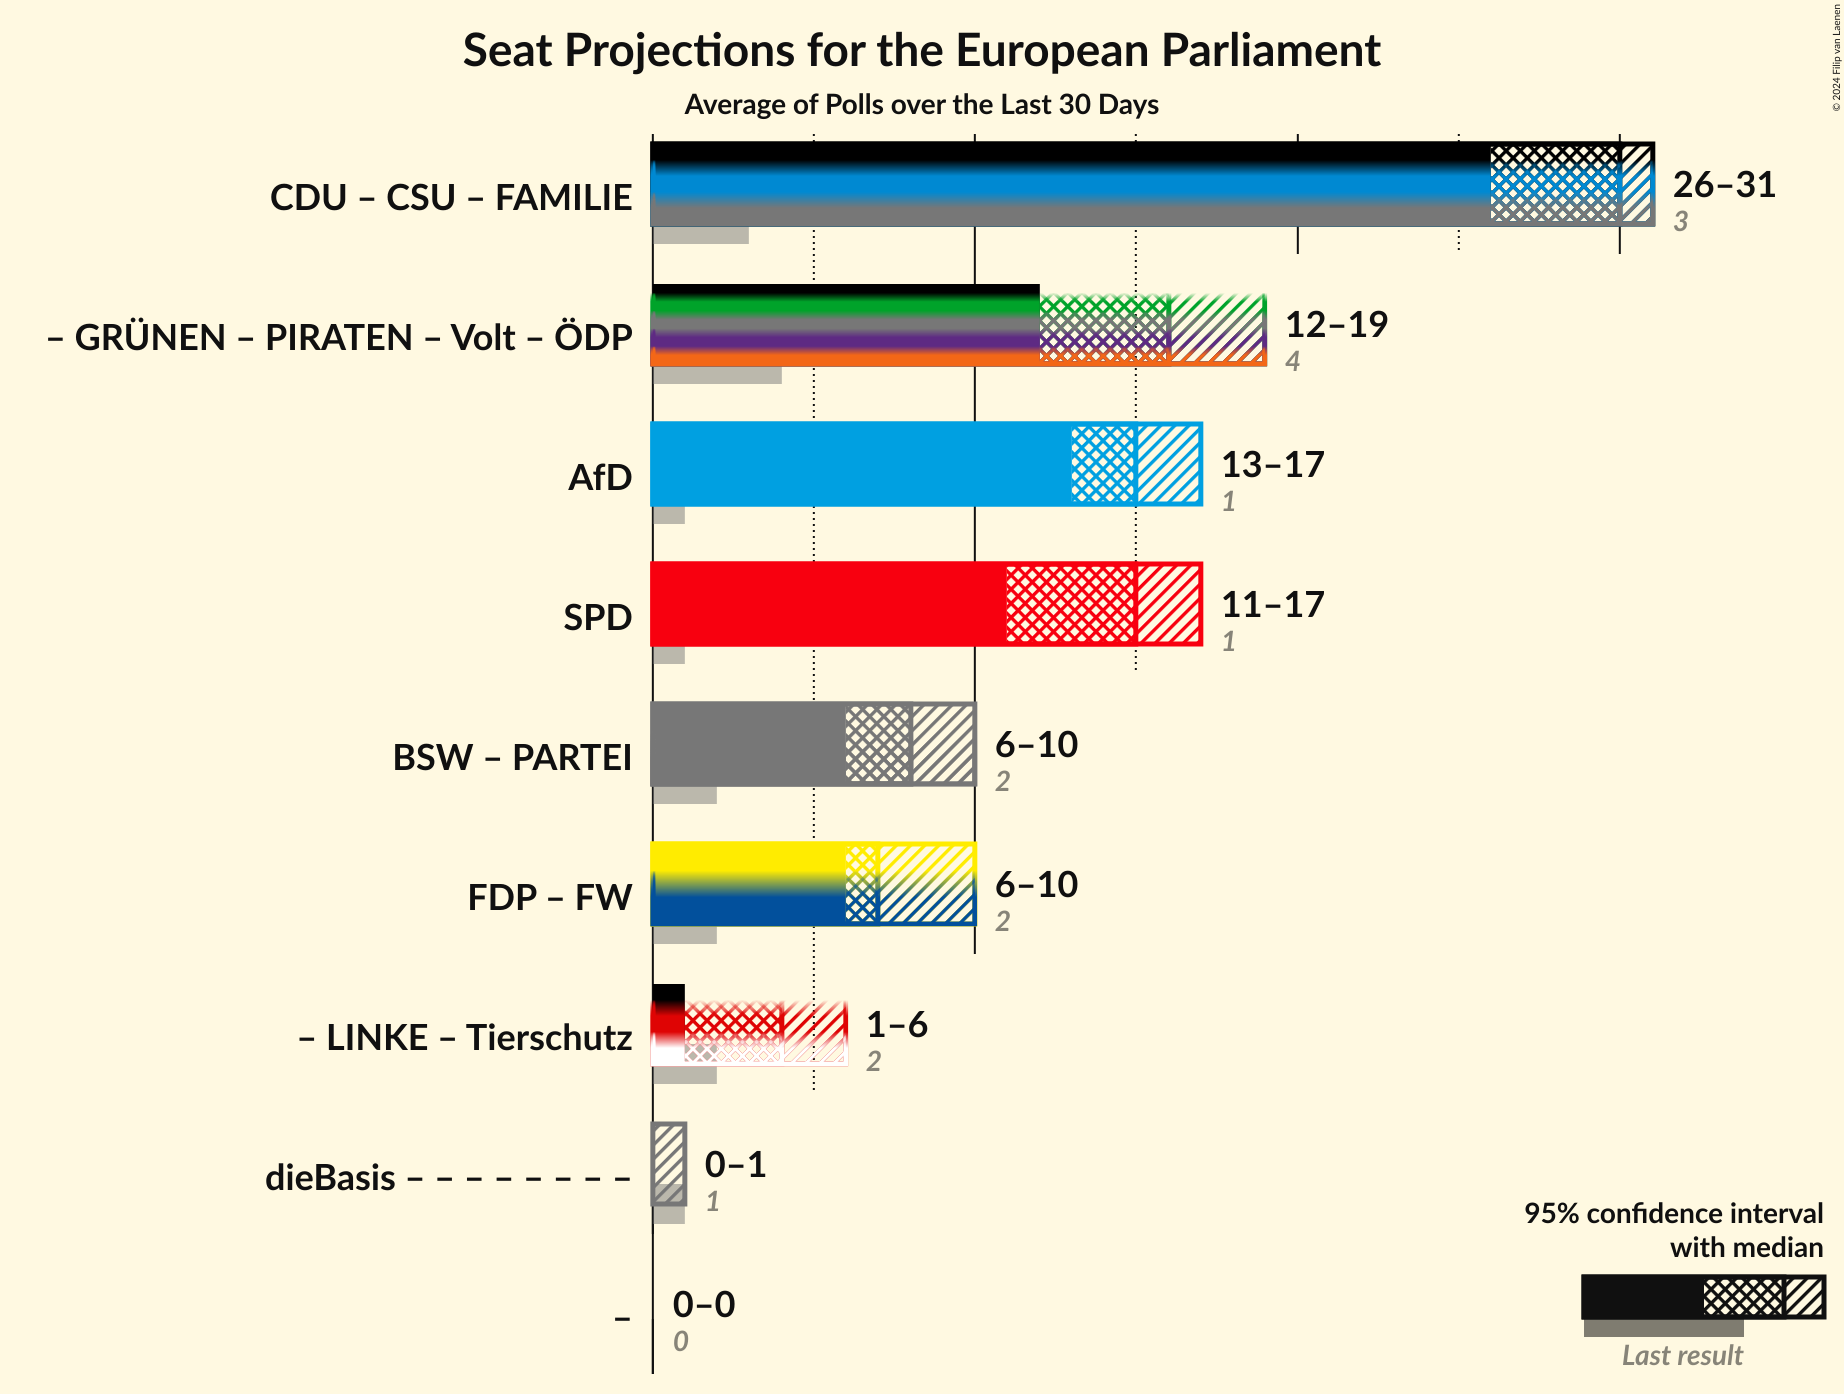
| Coalition | Last Result | Median | Majority? | 80% Confidence Interval | 90% Confidence Interval | 95% Confidence Interval | 99% Confidence Interval |
|---|---|---|---|---|---|---|---|
| Christlich Demokratische Union Deutschlands (EPP) – Christlich-Soziale Union in Bayern (EPP) – Familienpartei Deutschlands (EPP) – Ökologisch-Demokratische Partei (EPP) | 0 | 24 | 0% | 22–26 | 21–27 | 21–27 | 20–29 |
| Alternative für Deutschland (ESN) | 0 | 23 | 0% | 22–25 | 22–25 | 21–26 | 20–28 |
| Sozialdemokratische Partei Deutschlands (S&D) | 0 | 14 | 0% | 13–16 | 12–17 | 12–17 | 12–17 |
| Freie Demokratische Partei (RE) – Freie Wähler (RE) | 0 | 6 | 0% | 4–7 | 4–7 | 4–7 | 3–7 |
| Bündnis Sahra Wagenknecht (NI) – Die PARTEI (NI) | 0 | 4 | 0% | 1–5 | 1–5 | 1–6 | 1–6 |
Christlich Demokratische Union Deutschlands (EPP) – Christlich-Soziale Union in Bayern (EPP) – Familienpartei Deutschlands (EPP) – Ökologisch-Demokratische Partei (EPP)
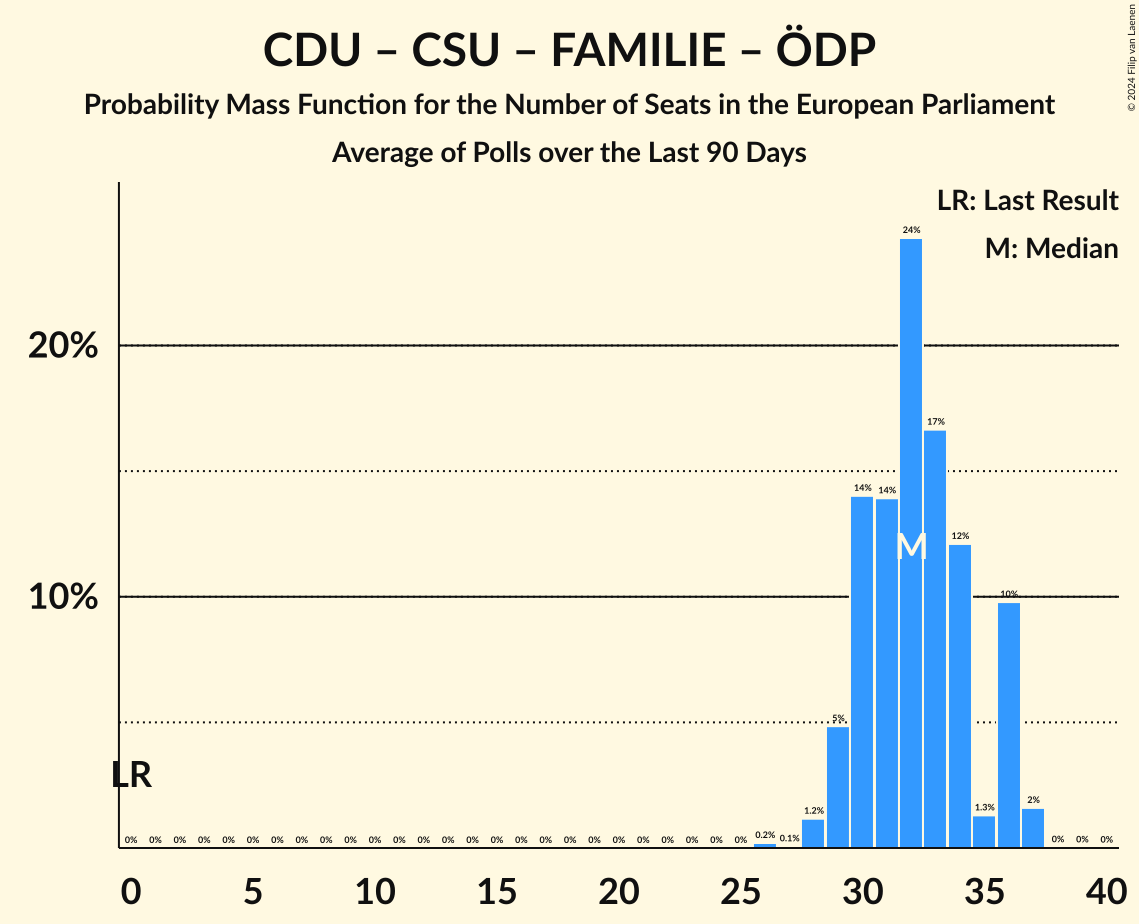
| Number of Seats | Probability | Accumulated | Special Marks |
|---|---|---|---|
| 0 | 0% | 100% | Last Result |
| 1 | 0% | 100% | |
| 2 | 0% | 100% | |
| 3 | 0% | 100% | |
| 4 | 0% | 100% | |
| 5 | 0% | 100% | |
| 6 | 0% | 100% | |
| 7 | 0% | 100% | |
| 8 | 0% | 100% | |
| 9 | 0% | 100% | |
| 10 | 0% | 100% | |
| 11 | 0% | 100% | |
| 12 | 0% | 100% | |
| 13 | 0% | 100% | |
| 14 | 0% | 100% | |
| 15 | 0% | 100% | |
| 16 | 0% | 100% | |
| 17 | 0% | 100% | |
| 18 | 0% | 100% | |
| 19 | 0.1% | 100% | |
| 20 | 0.5% | 99.8% | |
| 21 | 5% | 99.3% | |
| 22 | 9% | 94% | |
| 23 | 19% | 85% | |
| 24 | 27% | 67% | Median |
| 25 | 23% | 40% | |
| 26 | 11% | 17% | |
| 27 | 5% | 7% | |
| 28 | 0.9% | 2% | |
| 29 | 0.8% | 0.8% | |
| 30 | 0% | 0% |
Alternative für Deutschland (ESN)
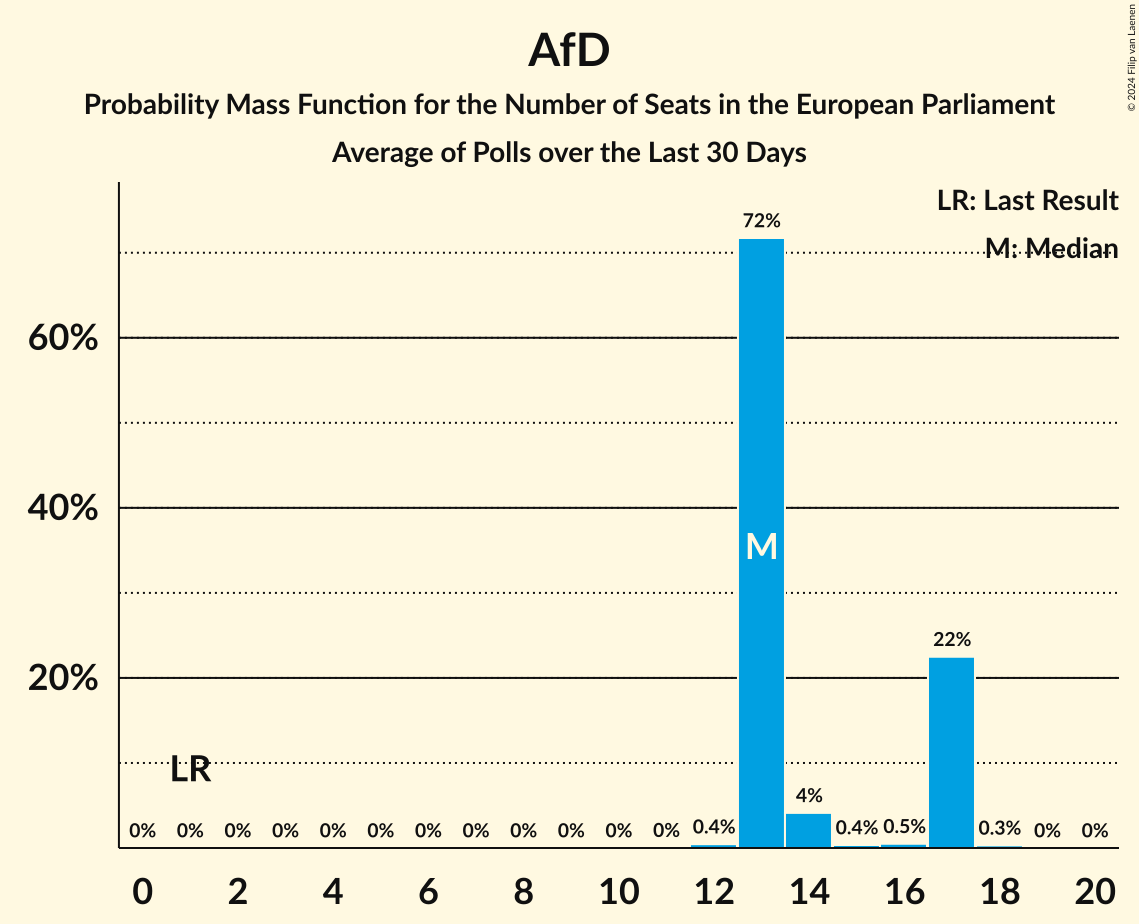
| Number of Seats | Probability | Accumulated | Special Marks |
|---|---|---|---|
| 0 | 0% | 100% | Last Result |
| 1 | 0% | 100% | |
| 2 | 0% | 100% | |
| 3 | 0% | 100% | |
| 4 | 0% | 100% | |
| 5 | 0% | 100% | |
| 6 | 0% | 100% | |
| 7 | 0% | 100% | |
| 8 | 0% | 100% | |
| 9 | 0% | 100% | |
| 10 | 0% | 100% | |
| 11 | 0% | 100% | |
| 12 | 0% | 100% | |
| 13 | 0% | 100% | |
| 14 | 0% | 100% | |
| 15 | 0% | 100% | |
| 16 | 0% | 100% | |
| 17 | 0% | 100% | |
| 18 | 0% | 100% | |
| 19 | 0% | 100% | |
| 20 | 0.7% | 100% | |
| 21 | 4% | 99.3% | |
| 22 | 17% | 95% | |
| 23 | 32% | 78% | Median |
| 24 | 28% | 45% | |
| 25 | 14% | 18% | |
| 26 | 3% | 4% | |
| 27 | 0.5% | 1.3% | |
| 28 | 0.7% | 0.7% | |
| 29 | 0% | 0% |
Sozialdemokratische Partei Deutschlands (S&D)
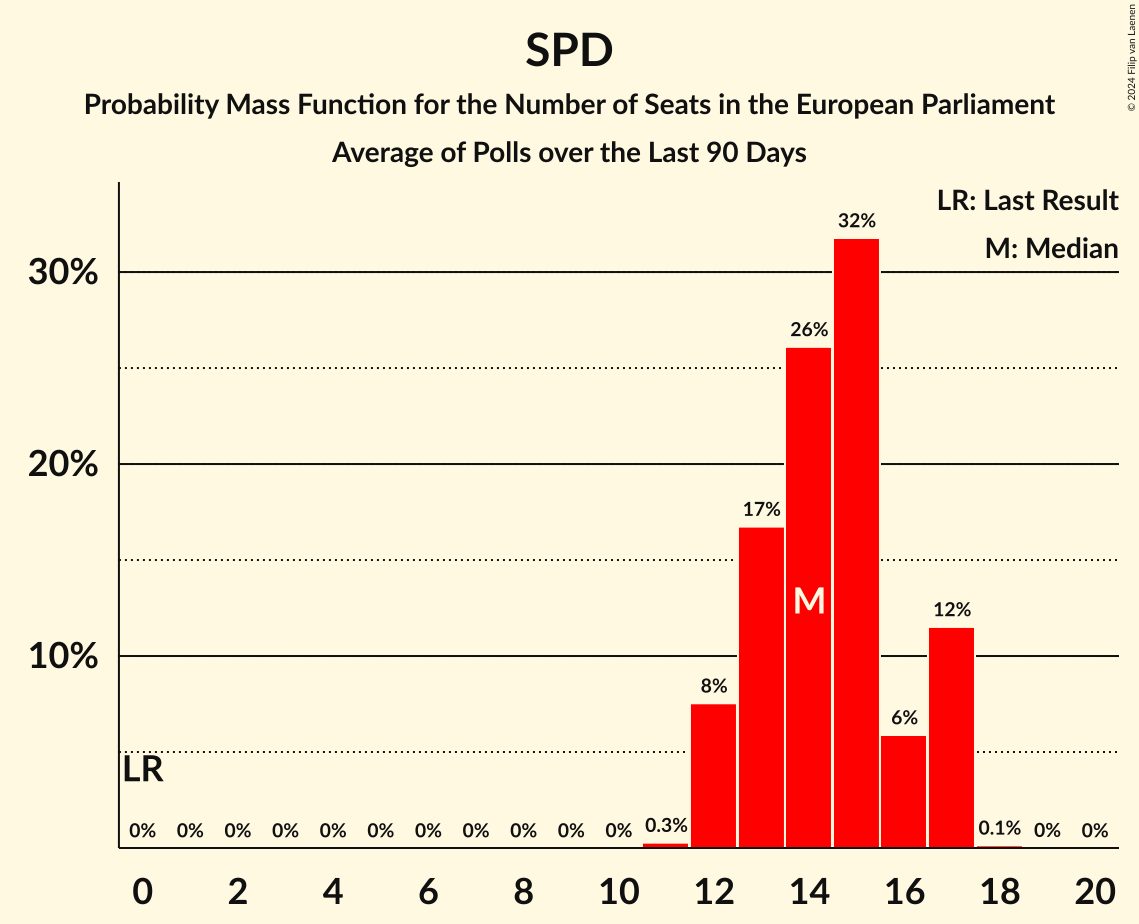
| Number of Seats | Probability | Accumulated | Special Marks |
|---|---|---|---|
| 0 | 0% | 100% | Last Result |
| 1 | 0% | 100% | |
| 2 | 0% | 100% | |
| 3 | 0% | 100% | |
| 4 | 0% | 100% | |
| 5 | 0% | 100% | |
| 6 | 0% | 100% | |
| 7 | 0% | 100% | |
| 8 | 0% | 100% | |
| 9 | 0% | 100% | |
| 10 | 0% | 100% | |
| 11 | 0.4% | 100% | |
| 12 | 5% | 99.6% | |
| 13 | 12% | 95% | |
| 14 | 37% | 83% | Median |
| 15 | 29% | 46% | |
| 16 | 11% | 18% | |
| 17 | 6% | 6% | |
| 18 | 0.2% | 0.2% | |
| 19 | 0% | 0% |
Freie Demokratische Partei (RE) – Freie Wähler (RE)
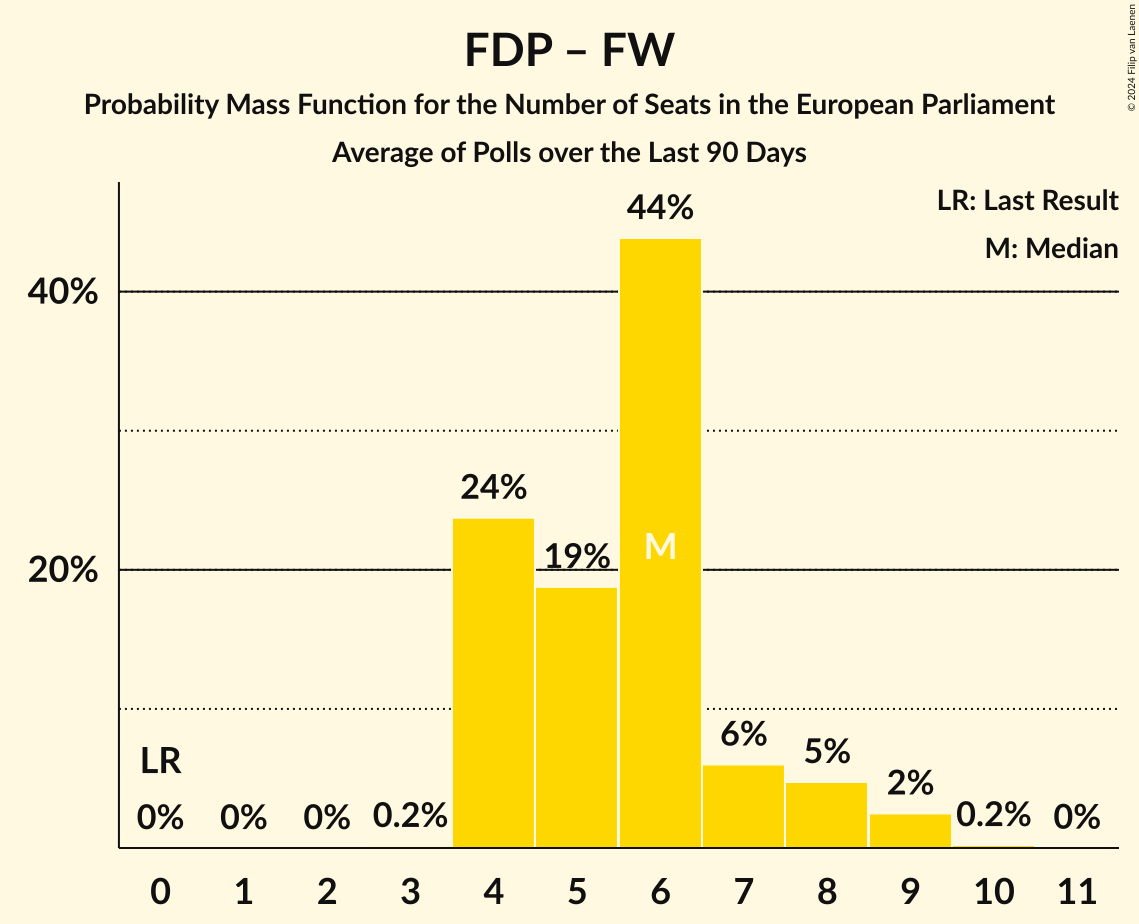
| Number of Seats | Probability | Accumulated | Special Marks |
|---|---|---|---|
| 0 | 0% | 100% | Last Result |
| 1 | 0% | 100% | |
| 2 | 0% | 100% | |
| 3 | 0.6% | 100% | |
| 4 | 10% | 99.4% | |
| 5 | 36% | 90% | Median |
| 6 | 44% | 54% | |
| 7 | 10% | 10% | |
| 8 | 0.3% | 0.3% | |
| 9 | 0% | 0% |
Bündnis Sahra Wagenknecht (NI) – Die PARTEI (NI)
| Number of Seats | Probability | Accumulated | Special Marks |
|---|---|---|---|
| 0 | 0.1% | 100% | Last Result |
| 1 | 12% | 99.9% | |
| 2 | 1.2% | 88% | |
| 3 | 23% | 87% | |
| 4 | 35% | 64% | Median |
| 5 | 26% | 29% | |
| 6 | 3% | 3% | |
| 7 | 0.2% | 0.2% | |
| 8 | 0% | 0% |
Technical Information
- Number of polls included in this average: 8
- Lowest number of simulations done in a poll included in this average: 2,097,152
- Total number of simulations done in the polls included in this average: 16,777,216
- Error estimate: 2.15%