Poll Average
Voting Intentions | Seats | Coalitions | Technical Information
Summary
The table below lists the polls on which the average is based. They are the most recent polls (less than 90 days old) registered and analyzed so far.
| Period | Polling firm/Commissioner(s) | CDU | SPD | AfD | FDP | LINKE | GRÜNEN | CSU | FW |
|---|---|---|---|---|---|---|---|---|---|
| 24 September 2017 | General Election | 26.8% 200 |
20.5% 153 |
12.6% 94 |
10.7% 80 |
9.2% 69 |
8.9% 67 |
6.2% 46 |
0.0% 0 |
| N/A | Poll Average | 15–21% 114–160 |
23–29% 178–218 |
10–13% 73–101 |
9–14% 67–108 |
5–9% 0–67 |
14–19% 104–143 |
3–5% 26–44 |
2–4% 0 |
| 13–17 September 2021 | INSA and YouGov | 15–19% 118–148 |
24–28% 186–220 |
9–13% 73–99 |
10–14% 81–106 |
5–7% 0–56 |
13–17% 104–131 |
3–5% 27–42 |
2–4% 0 |
| 15–16 September 2021 | Ipsos | 15–19% 116–141 |
25–29% 188–217 |
10–12% 73–93 |
9–11% 66–85 |
6–8% 45–61 |
16–20% 123–148 |
3–5% 27–40 |
N/A N/A |
| 14–16 September 2021 | Forschungsgruppe Wahlen | 16–20% 124–155 |
23–27% 177–214 |
9–13% 73–99 |
9–13% 73–99 |
5–7% 0–57 |
14–18% 110–140 |
3–5% 28–44 |
N/A N/A |
| 13–15 September 2021 | Infratest dimap | 16–20% 124–155 |
24–28% 185–220 |
9–13% 75–97 |
9–13% 73–98 |
5–7% 0–56 |
13–17% 103–131 |
3–5% 28–42 |
2–4% 0 |
| 9–14 September 2021 | YouGov | 15–18% 116–142 |
23–27% 183–214 |
10–13% 76–99 |
9–12% 69–90 |
7–9% 54–74 |
14–17% 106–131 |
3–5% 27–40 |
2–4% 0 |
| 8–14 September 2021 | Kantar | 15–18% 111–139 |
24–28% 183–217 |
10–14% 80–105 |
10–13% 73–97 |
5–7% 0–56 |
15–19% 116–145 |
3–5% 25–40 |
N/A N/A |
| 8–13 September 2021 | GMS | 16–21% 124–161 |
22–28% 168–211 |
9–13% 68–99 |
11–15% 82–115 |
5–8% 0–57 |
14–18% 104–139 |
3–6% 27–46 |
N/A N/A |
| 7–13 September 2021 | Forsa | 15–19% 120–146 |
23–27% 179–210 |
10–12% 75–97 |
10–12% 75–97 |
5–7% 39–55 |
15–19% 120–146 |
3–5% 28–41 |
2–4% 0 |
| 1–7 September 2021 | Allensbach | 18–23% 136–171 |
25–30% 185–223 |
9–13% 70–96 |
8–11% 60–85 |
5–7% 0–56 |
14–18% 102–134 |
4–6% 30–48 |
N/A N/A |
| 30 August–2 September 2021 | Trend Research | 14–19% 107–140 |
23–29% 177–215 |
10–14% 77–107 |
11–15% 83–114 |
6–9% 43–66 |
13–17% 98–130 |
3–5% 24–41 |
N/A N/A |
| 24 September 2017 | General Election | 26.8% 200 |
20.5% 153 |
12.6% 94 |
10.7% 80 |
9.2% 69 |
8.9% 67 |
6.2% 46 |
0.0% 0 |
Only polls for which at least the sample size has been published are included in the table above.
Legend:
- Top half of each row: Voting intentions (95% confidence interval)
- Bottom half of each row: Seat projections for the Bundestag (95% confidence interval)
- CDU: Christlich Demokratische Union Deutschlands
- SPD: Sozialdemokratische Partei Deutschlands
- AfD: Alternative für Deutschland
- FDP: Freie Demokratische Partei
- LINKE: Die Linke
- GRÜNEN: Bündnis 90/Die Grünen
- CSU: Christlich-Soziale Union in Bayern
- FW: Freie Wähler
- N/A (single party): Party not included the published results
- N/A (entire row): Calculation for this opinion poll not started yet
Voting Intentions

Confidence Intervals
| Party | Last Result | Median | 80% Confidence Interval | 90% Confidence Interval | 95% Confidence Interval | 99% Confidence Interval |
|---|---|---|---|---|---|---|
| Christlich Demokratische Union Deutschlands | 26.8% | 17.3% | 15.7–19.8% | 15.3–20.6% | 15.0–21.3% | 14.3–22.3% |
| Sozialdemokratische Partei Deutschlands | 20.5% | 25.8% | 24.2–27.6% | 23.7–28.1% | 23.3–28.6% | 22.5–29.5% |
| Alternative für Deutschland | 12.6% | 11.2% | 10.1–12.5% | 9.8–12.9% | 9.6–13.2% | 9.1–14.0% |
| Freie Demokratische Partei | 10.7% | 11.1% | 9.5–13.2% | 9.2–13.8% | 8.8–14.3% | 8.2–15.1% |
| Die Linke | 9.2% | 6.3% | 5.4–7.8% | 5.1–8.3% | 5.0–8.6% | 4.6–9.3% |
| Bündnis 90/Die Grünen | 8.9% | 15.9% | 14.3–17.9% | 13.9–18.4% | 13.6–18.8% | 12.9–19.6% |
| Christlich-Soziale Union in Bayern | 6.2% | 4.0% | 3.4–4.9% | 3.2–5.2% | 3.1–5.4% | 2.8–5.9% |
| Freie Wähler | 0.0% | 3.0% | 2.5–3.6% | 2.4–3.8% | 2.3–3.9% | 2.1–4.2% |
Christlich Demokratische Union Deutschlands
For a full overview of the results for this party, see the Christlich Demokratische Union Deutschlands page.
| Voting Intentions | Probability | Accumulated | Special Marks |
|---|---|---|---|
| 12.5–13.5% | 0.1% | 100% | |
| 13.5–14.5% | 1.0% | 99.9% | |
| 14.5–15.5% | 6% | 99.0% | |
| 15.5–16.5% | 20% | 92% | |
| 16.5–17.5% | 28% | 72% | Median |
| 17.5–18.5% | 21% | 44% | |
| 18.5–19.5% | 11% | 23% | |
| 19.5–20.5% | 6% | 12% | |
| 20.5–21.5% | 4% | 5% | |
| 21.5–22.5% | 1.4% | 2% | |
| 22.5–23.5% | 0.3% | 0.3% | |
| 23.5–24.5% | 0% | 0% | |
| 24.5–25.5% | 0% | 0% | |
| 25.5–26.5% | 0% | 0% | |
| 26.5–27.5% | 0% | 0% | Last Result |
Sozialdemokratische Partei Deutschlands
For a full overview of the results for this party, see the Sozialdemokratische Partei Deutschlands page.
| Voting Intentions | Probability | Accumulated | Special Marks |
|---|---|---|---|
| 20.5–21.5% | 0.1% | 100% | Last Result |
| 21.5–22.5% | 0.5% | 99.9% | |
| 22.5–23.5% | 3% | 99.4% | |
| 23.5–24.5% | 13% | 96% | |
| 24.5–25.5% | 25% | 83% | |
| 25.5–26.5% | 28% | 59% | Median |
| 26.5–27.5% | 20% | 31% | |
| 27.5–28.5% | 8% | 11% | |
| 28.5–29.5% | 2% | 3% | |
| 29.5–30.5% | 0.4% | 0.4% | |
| 30.5–31.5% | 0% | 0% |
Alternative für Deutschland
For a full overview of the results for this party, see the Alternative für Deutschland page.
| Voting Intentions | Probability | Accumulated | Special Marks |
|---|---|---|---|
| 7.5–8.5% | 0.1% | 100% | |
| 8.5–9.5% | 2% | 99.9% | |
| 9.5–10.5% | 20% | 98% | |
| 10.5–11.5% | 42% | 78% | Median |
| 11.5–12.5% | 26% | 35% | |
| 12.5–13.5% | 8% | 9% | Last Result |
| 13.5–14.5% | 1.2% | 1.3% | |
| 14.5–15.5% | 0.1% | 0.1% | |
| 15.5–16.5% | 0% | 0% |
Freie Demokratische Partei
For a full overview of the results for this party, see the Freie Demokratische Partei page.
| Voting Intentions | Probability | Accumulated | Special Marks |
|---|---|---|---|
| 6.5–7.5% | 0% | 100% | |
| 7.5–8.5% | 1.2% | 100% | |
| 8.5–9.5% | 9% | 98.8% | |
| 9.5–10.5% | 24% | 90% | |
| 10.5–11.5% | 29% | 65% | Last Result, Median |
| 11.5–12.5% | 19% | 36% | |
| 12.5–13.5% | 11% | 17% | |
| 13.5–14.5% | 5% | 7% | |
| 14.5–15.5% | 1.3% | 2% | |
| 15.5–16.5% | 0.2% | 0.2% | |
| 16.5–17.5% | 0% | 0% |
Die Linke
For a full overview of the results for this party, see the Die Linke page.
| Voting Intentions | Probability | Accumulated | Special Marks |
|---|---|---|---|
| 2.5–3.5% | 0% | 100% | |
| 3.5–4.5% | 0.4% | 100% | |
| 4.5–5.5% | 15% | 99.6% | |
| 5.5–6.5% | 44% | 85% | Median |
| 6.5–7.5% | 27% | 41% | |
| 7.5–8.5% | 11% | 14% | |
| 8.5–9.5% | 3% | 3% | Last Result |
| 9.5–10.5% | 0.2% | 0.2% | |
| 10.5–11.5% | 0% | 0% |
Bündnis 90/Die Grünen
For a full overview of the results for this party, see the Bündnis 90/Die Grünen page.
| Voting Intentions | Probability | Accumulated | Special Marks |
|---|---|---|---|
| 8.5–9.5% | 0% | 100% | Last Result |
| 9.5–10.5% | 0% | 100% | |
| 10.5–11.5% | 0% | 100% | |
| 11.5–12.5% | 0.1% | 100% | |
| 12.5–13.5% | 2% | 99.9% | |
| 13.5–14.5% | 12% | 98% | |
| 14.5–15.5% | 25% | 85% | |
| 15.5–16.5% | 26% | 60% | Median |
| 16.5–17.5% | 19% | 34% | |
| 17.5–18.5% | 11% | 15% | |
| 18.5–19.5% | 3% | 4% | |
| 19.5–20.5% | 0.5% | 0.5% | |
| 20.5–21.5% | 0% | 0% |
Christlich-Soziale Union in Bayern
For a full overview of the results for this party, see the Christlich-Soziale Union in Bayern page.
| Voting Intentions | Probability | Accumulated | Special Marks |
|---|---|---|---|
| 0.5–1.5% | 0% | 100% | |
| 1.5–2.5% | 0.1% | 100% | |
| 2.5–3.5% | 17% | 99.9% | |
| 3.5–4.5% | 62% | 83% | Median |
| 4.5–5.5% | 19% | 20% | |
| 5.5–6.5% | 2% | 2% | Last Result |
| 6.5–7.5% | 0% | 0% | |
| 7.5–8.5% | 0% | 0% |
Freie Wähler
For a full overview of the results for this party, see the Freie Wähler page.
| Voting Intentions | Probability | Accumulated | Special Marks |
|---|---|---|---|
| 0.0–0.5% | 0% | 100% | Last Result |
| 0.5–1.5% | 0% | 100% | |
| 1.5–2.5% | 11% | 100% | |
| 2.5–3.5% | 77% | 89% | Median |
| 3.5–4.5% | 12% | 12% | |
| 4.5–5.5% | 0.1% | 0.1% | |
| 5.5–6.5% | 0% | 0% |
Seats
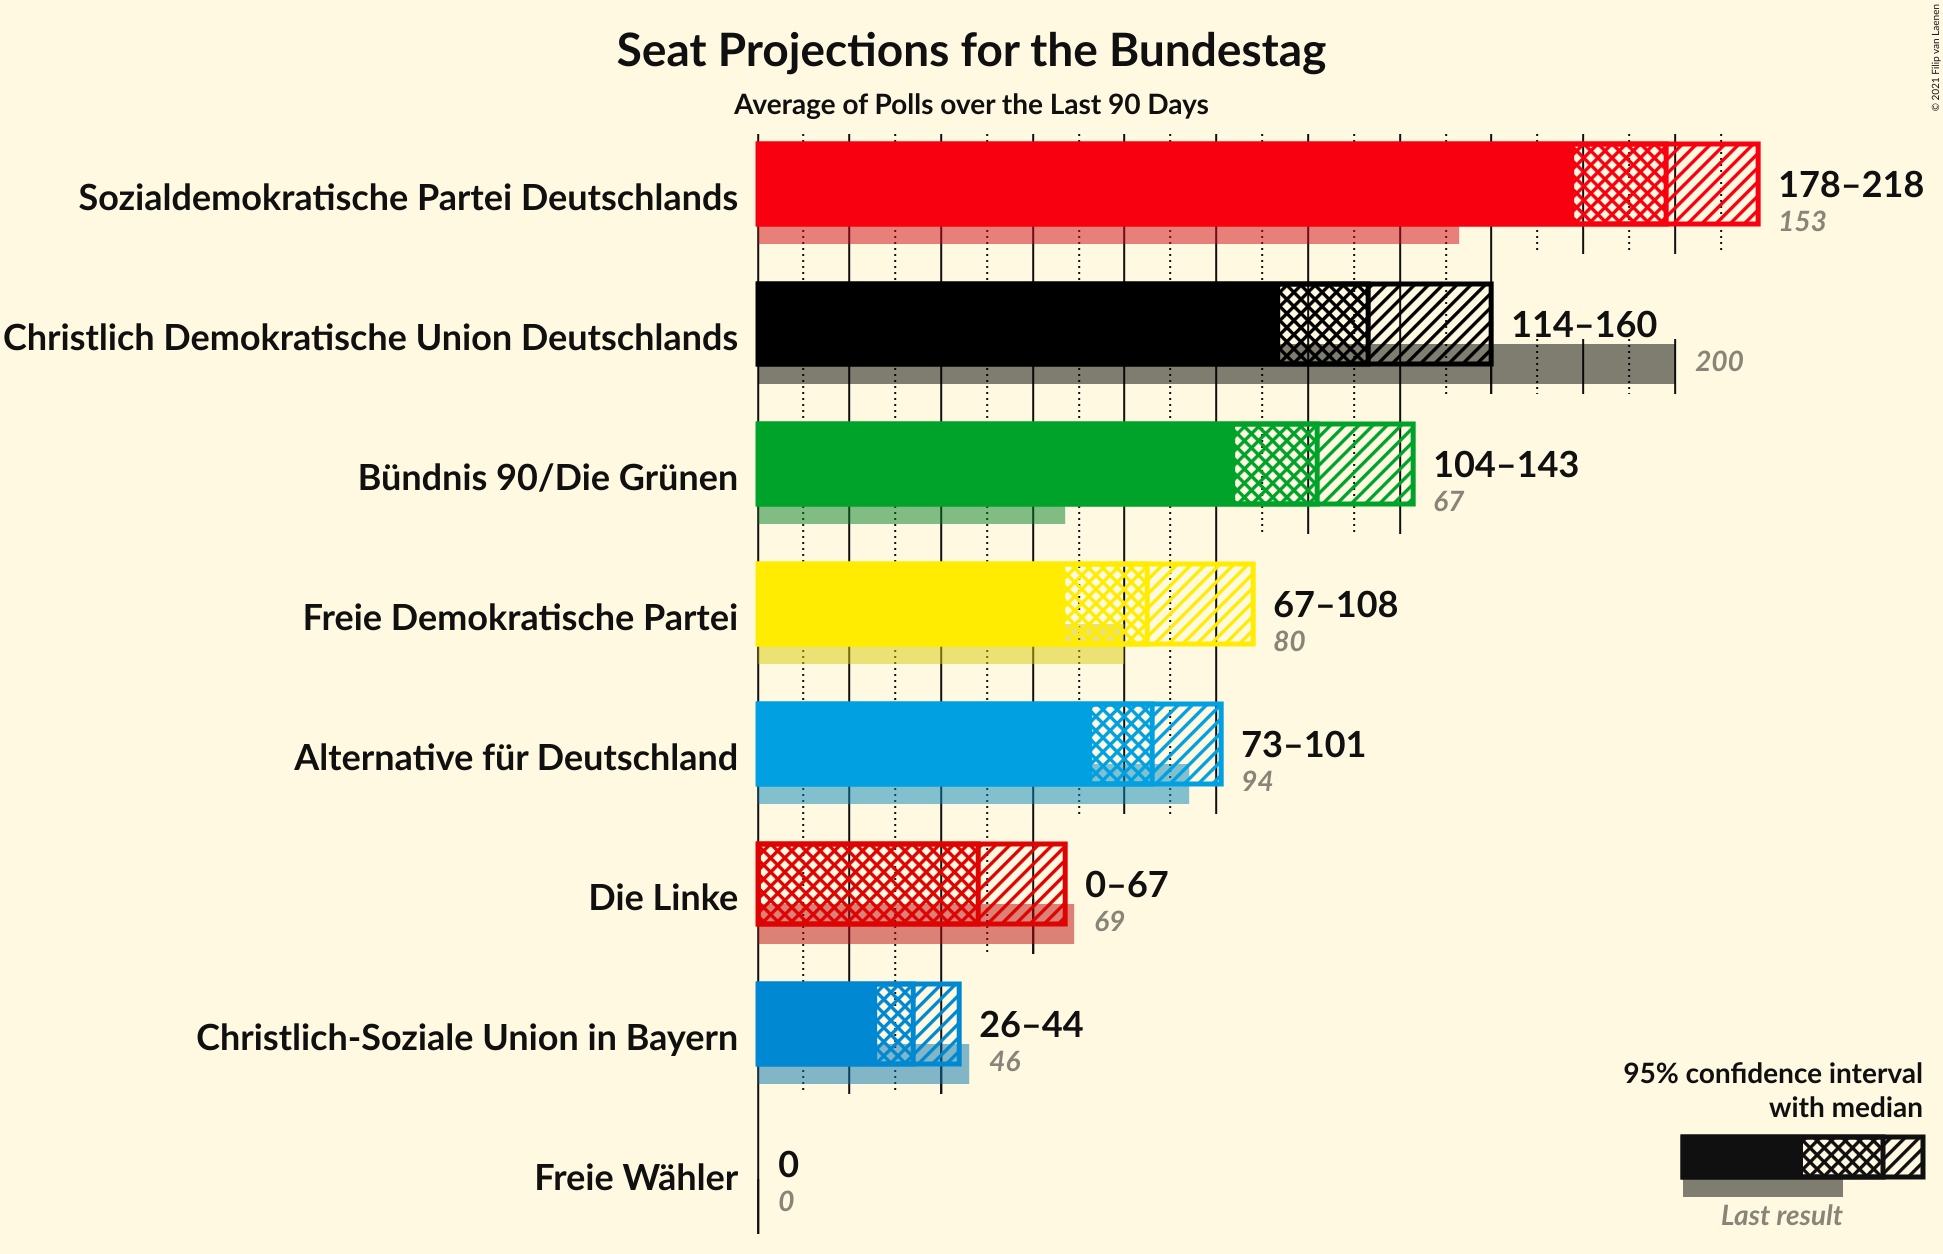
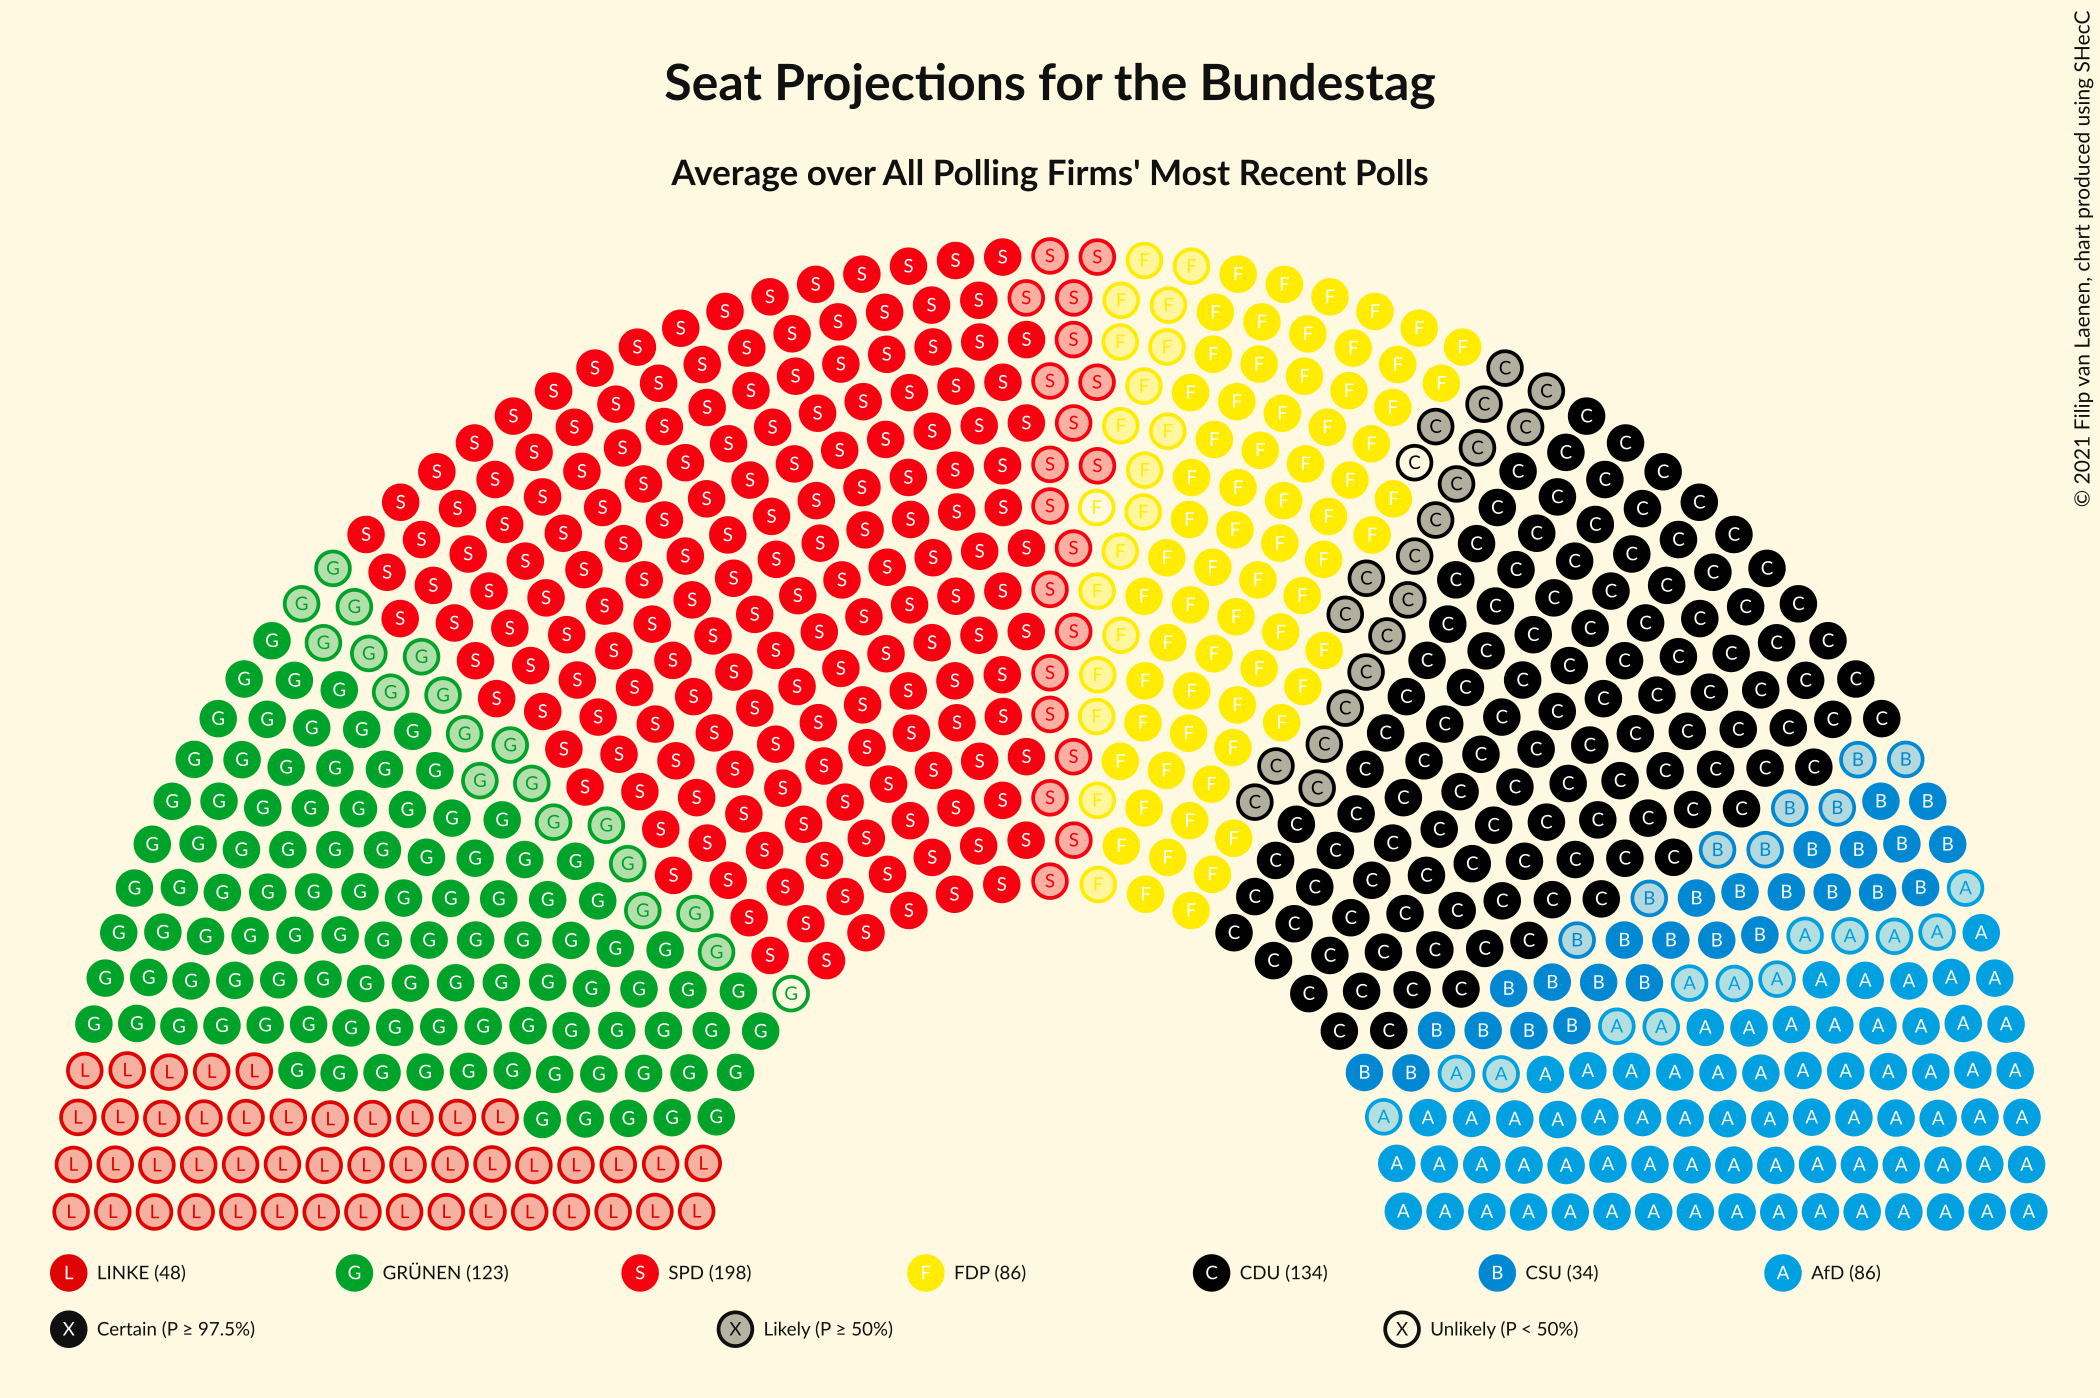
Confidence Intervals
| Party | Last Result | Median | 80% Confidence Interval | 90% Confidence Interval | 95% Confidence Interval | 99% Confidence Interval |
|---|---|---|---|---|---|---|
| Christlich Demokratische Union Deutschlands | 200 | 133 | 120–150 | 117–156 | 114–160 | 108–168 |
| Sozialdemokratische Partei Deutschlands | 153 | 198 | 185–211 | 181–214 | 178–218 | 170–225 |
| Alternative für Deutschland | 94 | 86 | 77–96 | 75–98 | 73–101 | 68–107 |
| Freie Demokratische Partei | 80 | 85 | 73–100 | 69–105 | 67–108 | 62–115 |
| Die Linke | 69 | 48 | 41–60 | 39–64 | 0–67 | 0–73 |
| Bündnis 90/Die Grünen | 67 | 122 | 109–136 | 106–140 | 104–143 | 99–148 |
| Christlich-Soziale Union in Bayern | 46 | 34 | 29–40 | 28–42 | 26–44 | 24–48 |
| Freie Wähler | 0 | 0 | 0 | 0 | 0 | 0 |
Christlich Demokratische Union Deutschlands
For a full overview of the results for this party, see the Christlich Demokratische Union Deutschlands page.
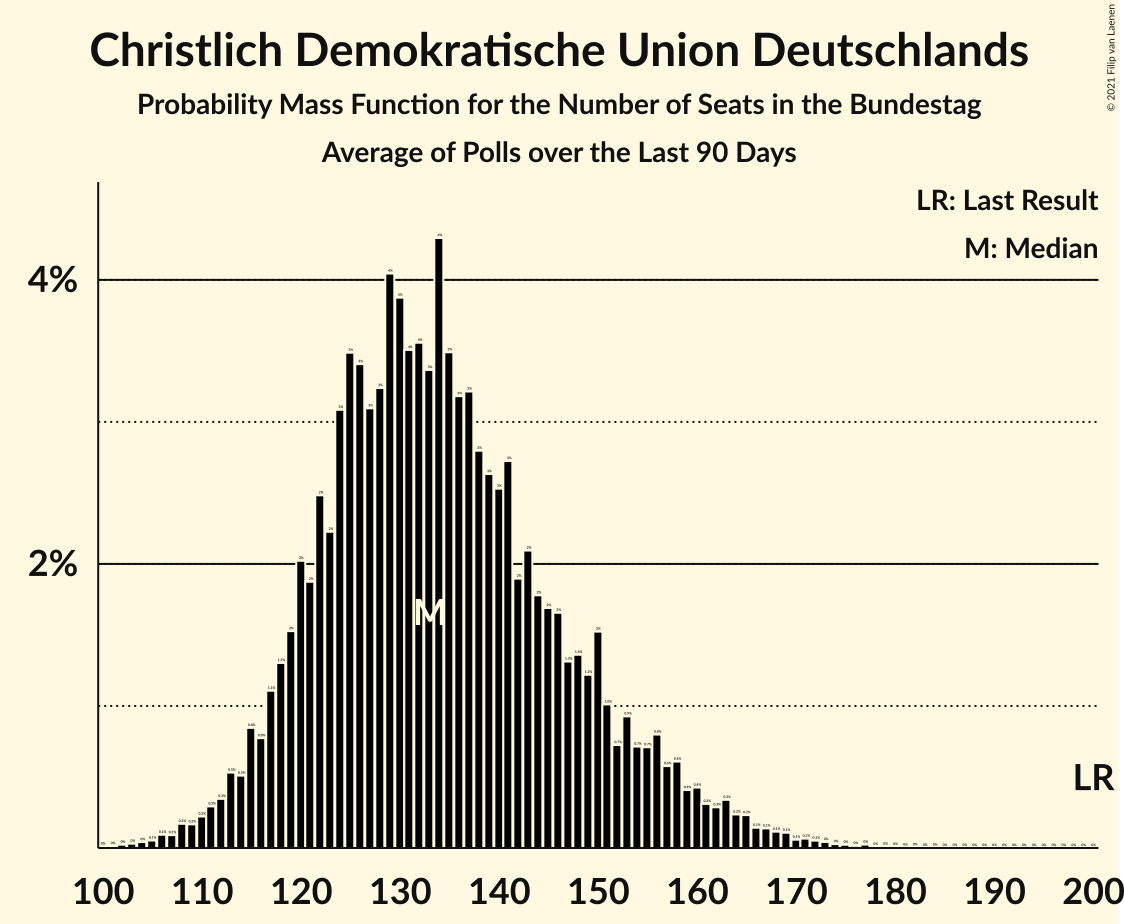
| Number of Seats | Probability | Accumulated | Special Marks |
|---|---|---|---|
| 102 | 0% | 100% | |
| 103 | 0% | 99.9% | |
| 104 | 0% | 99.9% | |
| 105 | 0.1% | 99.9% | |
| 106 | 0.1% | 99.8% | |
| 107 | 0.1% | 99.7% | |
| 108 | 0.2% | 99.6% | |
| 109 | 0.2% | 99.5% | |
| 110 | 0.2% | 99.3% | |
| 111 | 0.3% | 99.1% | |
| 112 | 0.3% | 98.8% | |
| 113 | 0.5% | 98% | |
| 114 | 0.5% | 98% | |
| 115 | 0.8% | 97% | |
| 116 | 0.8% | 97% | |
| 117 | 1.1% | 96% | |
| 118 | 1.3% | 95% | |
| 119 | 2% | 93% | |
| 120 | 2% | 92% | |
| 121 | 2% | 90% | |
| 122 | 2% | 88% | |
| 123 | 2% | 85% | |
| 124 | 3% | 83% | |
| 125 | 3% | 80% | |
| 126 | 3% | 77% | |
| 127 | 3% | 73% | |
| 128 | 3% | 70% | |
| 129 | 4% | 67% | |
| 130 | 4% | 63% | |
| 131 | 4% | 59% | |
| 132 | 4% | 55% | |
| 133 | 3% | 52% | Median |
| 134 | 4% | 49% | |
| 135 | 3% | 44% | |
| 136 | 3% | 41% | |
| 137 | 3% | 38% | |
| 138 | 3% | 34% | |
| 139 | 3% | 32% | |
| 140 | 3% | 29% | |
| 141 | 3% | 26% | |
| 142 | 2% | 24% | |
| 143 | 2% | 22% | |
| 144 | 2% | 20% | |
| 145 | 2% | 18% | |
| 146 | 2% | 16% | |
| 147 | 1.3% | 15% | |
| 148 | 1.4% | 13% | |
| 149 | 1.2% | 12% | |
| 150 | 2% | 11% | |
| 151 | 1.0% | 9% | |
| 152 | 0.7% | 8% | |
| 153 | 0.9% | 7% | |
| 154 | 0.7% | 7% | |
| 155 | 0.7% | 6% | |
| 156 | 0.8% | 5% | |
| 157 | 0.6% | 4% | |
| 158 | 0.6% | 4% | |
| 159 | 0.4% | 3% | |
| 160 | 0.4% | 3% | |
| 161 | 0.3% | 2% | |
| 162 | 0.3% | 2% | |
| 163 | 0.3% | 2% | |
| 164 | 0.2% | 1.3% | |
| 165 | 0.2% | 1.1% | |
| 166 | 0.1% | 0.9% | |
| 167 | 0.1% | 0.7% | |
| 168 | 0.1% | 0.6% | |
| 169 | 0.1% | 0.5% | |
| 170 | 0.1% | 0.4% | |
| 171 | 0.1% | 0.3% | |
| 172 | 0.1% | 0.2% | |
| 173 | 0% | 0.2% | |
| 174 | 0% | 0.1% | |
| 175 | 0% | 0.1% | |
| 176 | 0% | 0.1% | |
| 177 | 0% | 0.1% | |
| 178 | 0% | 0% | |
| 179 | 0% | 0% | |
| 180 | 0% | 0% | |
| 181 | 0% | 0% | |
| 182 | 0% | 0% | |
| 183 | 0% | 0% | |
| 184 | 0% | 0% | |
| 185 | 0% | 0% | |
| 186 | 0% | 0% | |
| 187 | 0% | 0% | |
| 188 | 0% | 0% | |
| 189 | 0% | 0% | |
| 190 | 0% | 0% | |
| 191 | 0% | 0% | |
| 192 | 0% | 0% | |
| 193 | 0% | 0% | |
| 194 | 0% | 0% | |
| 195 | 0% | 0% | |
| 196 | 0% | 0% | |
| 197 | 0% | 0% | |
| 198 | 0% | 0% | |
| 199 | 0% | 0% | |
| 200 | 0% | 0% | Last Result |
Sozialdemokratische Partei Deutschlands
For a full overview of the results for this party, see the Sozialdemokratische Partei Deutschlands page.
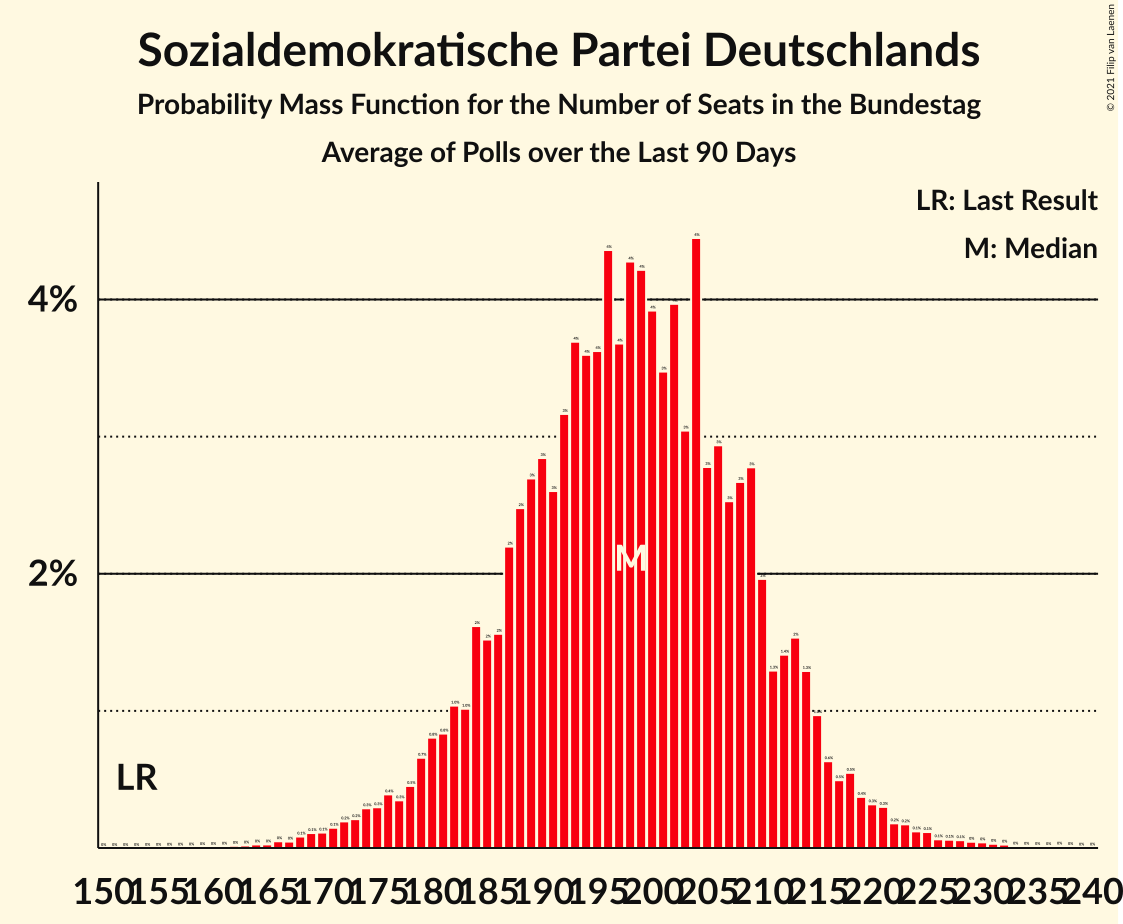
| Number of Seats | Probability | Accumulated | Special Marks |
|---|---|---|---|
| 153 | 0% | 100% | Last Result |
| 154 | 0% | 100% | |
| 155 | 0% | 100% | |
| 156 | 0% | 100% | |
| 157 | 0% | 100% | |
| 158 | 0% | 100% | |
| 159 | 0% | 100% | |
| 160 | 0% | 100% | |
| 161 | 0% | 100% | |
| 162 | 0% | 100% | |
| 163 | 0% | 99.9% | |
| 164 | 0% | 99.9% | |
| 165 | 0% | 99.9% | |
| 166 | 0% | 99.9% | |
| 167 | 0% | 99.8% | |
| 168 | 0.1% | 99.8% | |
| 169 | 0.1% | 99.7% | |
| 170 | 0.1% | 99.6% | |
| 171 | 0.1% | 99.5% | |
| 172 | 0.2% | 99.3% | |
| 173 | 0.2% | 99.1% | |
| 174 | 0.3% | 98.9% | |
| 175 | 0.3% | 98.6% | |
| 176 | 0.4% | 98% | |
| 177 | 0.3% | 98% | |
| 178 | 0.5% | 98% | |
| 179 | 0.7% | 97% | |
| 180 | 0.8% | 96% | |
| 181 | 0.8% | 96% | |
| 182 | 1.0% | 95% | |
| 183 | 1.0% | 94% | |
| 184 | 2% | 93% | |
| 185 | 2% | 91% | |
| 186 | 2% | 90% | |
| 187 | 2% | 88% | |
| 188 | 2% | 86% | |
| 189 | 3% | 83% | |
| 190 | 3% | 81% | |
| 191 | 3% | 78% | |
| 192 | 3% | 75% | |
| 193 | 4% | 72% | |
| 194 | 4% | 68% | |
| 195 | 4% | 65% | |
| 196 | 4% | 61% | |
| 197 | 4% | 57% | |
| 198 | 4% | 53% | Median |
| 199 | 4% | 49% | |
| 200 | 4% | 45% | |
| 201 | 3% | 41% | |
| 202 | 4% | 37% | |
| 203 | 3% | 33% | |
| 204 | 4% | 30% | |
| 205 | 3% | 26% | |
| 206 | 3% | 23% | |
| 207 | 3% | 20% | |
| 208 | 3% | 18% | |
| 209 | 3% | 15% | |
| 210 | 2% | 12% | |
| 211 | 1.3% | 10% | |
| 212 | 1.4% | 9% | |
| 213 | 2% | 7% | |
| 214 | 1.3% | 6% | |
| 215 | 1.0% | 5% | |
| 216 | 0.6% | 4% | |
| 217 | 0.5% | 3% | |
| 218 | 0.5% | 3% | |
| 219 | 0.4% | 2% | |
| 220 | 0.3% | 2% | |
| 221 | 0.3% | 1.3% | |
| 222 | 0.2% | 1.0% | |
| 223 | 0.2% | 0.8% | |
| 224 | 0.1% | 0.6% | |
| 225 | 0.1% | 0.5% | |
| 226 | 0.1% | 0.4% | |
| 227 | 0.1% | 0.3% | |
| 228 | 0.1% | 0.3% | |
| 229 | 0% | 0.2% | |
| 230 | 0% | 0.2% | |
| 231 | 0% | 0.1% | |
| 232 | 0% | 0.1% | |
| 233 | 0% | 0.1% | |
| 234 | 0% | 0.1% | |
| 235 | 0% | 0.1% | |
| 236 | 0% | 0% |
Alternative für Deutschland
For a full overview of the results for this party, see the Alternative für Deutschland page.
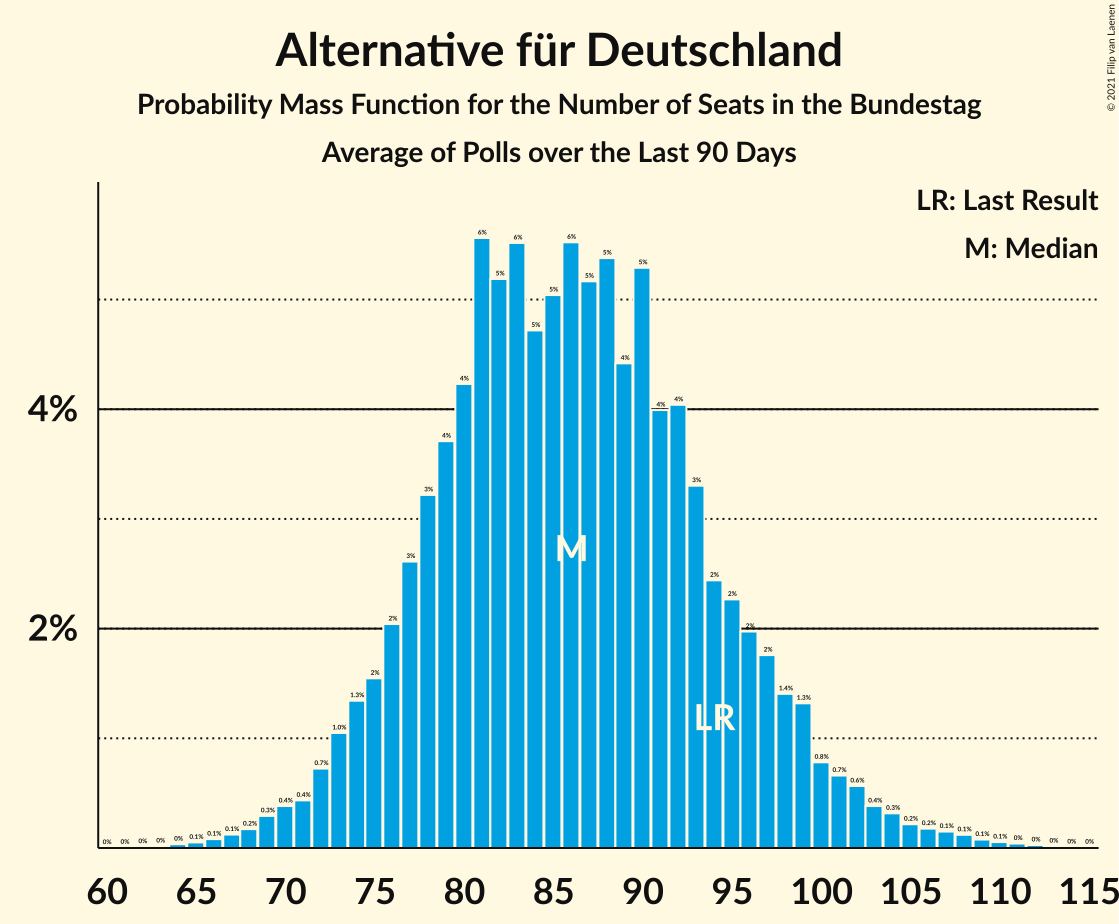
| Number of Seats | Probability | Accumulated | Special Marks |
|---|---|---|---|
| 64 | 0% | 100% | |
| 65 | 0.1% | 99.9% | |
| 66 | 0.1% | 99.9% | |
| 67 | 0.1% | 99.8% | |
| 68 | 0.2% | 99.7% | |
| 69 | 0.3% | 99.5% | |
| 70 | 0.4% | 99.2% | |
| 71 | 0.4% | 98.8% | |
| 72 | 0.7% | 98% | |
| 73 | 1.0% | 98% | |
| 74 | 1.3% | 97% | |
| 75 | 2% | 95% | |
| 76 | 2% | 94% | |
| 77 | 3% | 92% | |
| 78 | 3% | 89% | |
| 79 | 4% | 86% | |
| 80 | 4% | 82% | |
| 81 | 6% | 78% | |
| 82 | 5% | 72% | |
| 83 | 6% | 67% | |
| 84 | 5% | 62% | |
| 85 | 5% | 57% | |
| 86 | 6% | 52% | Median |
| 87 | 5% | 46% | |
| 88 | 5% | 41% | |
| 89 | 4% | 36% | |
| 90 | 5% | 31% | |
| 91 | 4% | 26% | |
| 92 | 4% | 22% | |
| 93 | 3% | 18% | |
| 94 | 2% | 15% | Last Result |
| 95 | 2% | 12% | |
| 96 | 2% | 10% | |
| 97 | 2% | 8% | |
| 98 | 1.4% | 6% | |
| 99 | 1.3% | 5% | |
| 100 | 0.8% | 4% | |
| 101 | 0.7% | 3% | |
| 102 | 0.6% | 2% | |
| 103 | 0.4% | 2% | |
| 104 | 0.3% | 1.2% | |
| 105 | 0.2% | 0.9% | |
| 106 | 0.2% | 0.7% | |
| 107 | 0.1% | 0.5% | |
| 108 | 0.1% | 0.4% | |
| 109 | 0.1% | 0.3% | |
| 110 | 0.1% | 0.2% | |
| 111 | 0% | 0.1% | |
| 112 | 0% | 0.1% | |
| 113 | 0% | 0.1% | |
| 114 | 0% | 0% |
Freie Demokratische Partei
For a full overview of the results for this party, see the Freie Demokratische Partei page.
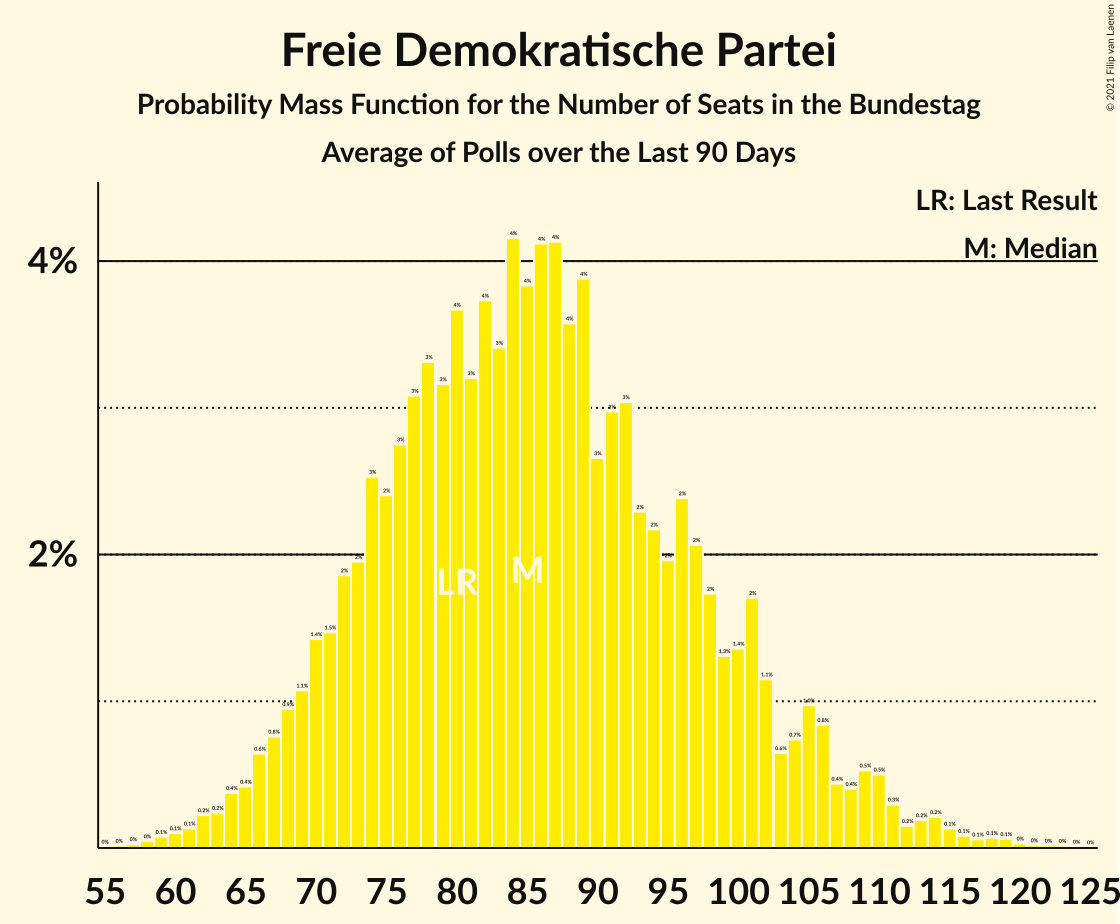
| Number of Seats | Probability | Accumulated | Special Marks |
|---|---|---|---|
| 57 | 0% | 100% | |
| 58 | 0% | 99.9% | |
| 59 | 0.1% | 99.9% | |
| 60 | 0.1% | 99.8% | |
| 61 | 0.1% | 99.7% | |
| 62 | 0.2% | 99.6% | |
| 63 | 0.2% | 99.4% | |
| 64 | 0.4% | 99.1% | |
| 65 | 0.4% | 98.7% | |
| 66 | 0.6% | 98% | |
| 67 | 0.8% | 98% | |
| 68 | 0.9% | 97% | |
| 69 | 1.1% | 96% | |
| 70 | 1.4% | 95% | |
| 71 | 1.5% | 93% | |
| 72 | 2% | 92% | |
| 73 | 2% | 90% | |
| 74 | 3% | 88% | |
| 75 | 2% | 86% | |
| 76 | 3% | 83% | |
| 77 | 3% | 81% | |
| 78 | 3% | 77% | |
| 79 | 3% | 74% | |
| 80 | 4% | 71% | Last Result |
| 81 | 3% | 67% | |
| 82 | 4% | 64% | |
| 83 | 3% | 60% | |
| 84 | 4% | 57% | |
| 85 | 4% | 53% | Median |
| 86 | 4% | 49% | |
| 87 | 4% | 45% | |
| 88 | 4% | 41% | |
| 89 | 4% | 37% | |
| 90 | 3% | 33% | |
| 91 | 3% | 31% | |
| 92 | 3% | 28% | |
| 93 | 2% | 25% | |
| 94 | 2% | 22% | |
| 95 | 2% | 20% | |
| 96 | 2% | 18% | |
| 97 | 2% | 16% | |
| 98 | 2% | 14% | |
| 99 | 1.3% | 12% | |
| 100 | 1.4% | 11% | |
| 101 | 2% | 9% | |
| 102 | 1.1% | 8% | |
| 103 | 0.6% | 6% | |
| 104 | 0.7% | 6% | |
| 105 | 1.0% | 5% | |
| 106 | 0.8% | 4% | |
| 107 | 0.4% | 3% | |
| 108 | 0.4% | 3% | |
| 109 | 0.5% | 2% | |
| 110 | 0.5% | 2% | |
| 111 | 0.3% | 1.4% | |
| 112 | 0.2% | 1.1% | |
| 113 | 0.2% | 0.9% | |
| 114 | 0.2% | 0.7% | |
| 115 | 0.1% | 0.5% | |
| 116 | 0.1% | 0.4% | |
| 117 | 0.1% | 0.3% | |
| 118 | 0.1% | 0.2% | |
| 119 | 0.1% | 0.2% | |
| 120 | 0% | 0.1% | |
| 121 | 0% | 0.1% | |
| 122 | 0% | 0.1% | |
| 123 | 0% | 0% |
Die Linke
For a full overview of the results for this party, see the Die Linke page.
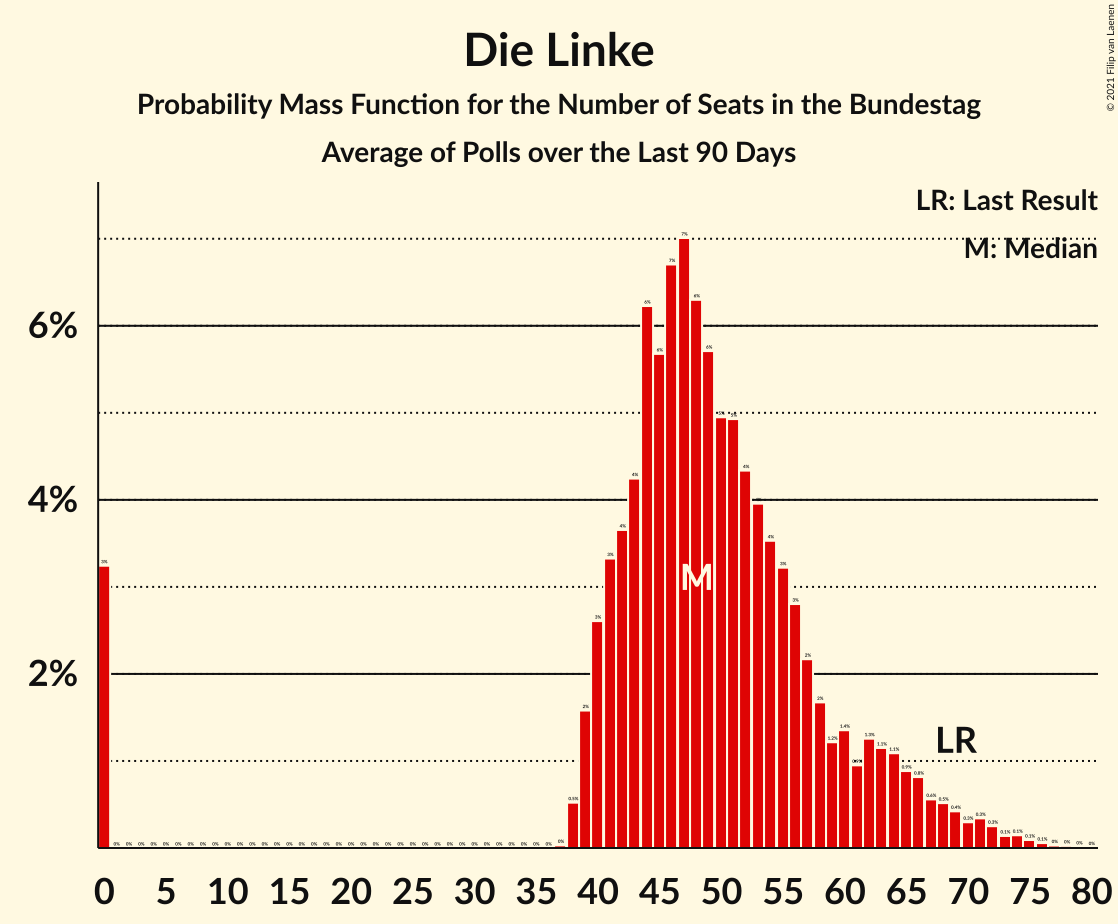
| Number of Seats | Probability | Accumulated | Special Marks |
|---|---|---|---|
| 0 | 3% | 100% | |
| 1 | 0% | 97% | |
| 2 | 0% | 97% | |
| 3 | 0% | 97% | |
| 4 | 0% | 97% | |
| 5 | 0% | 97% | |
| 6 | 0% | 97% | |
| 7 | 0% | 97% | |
| 8 | 0% | 97% | |
| 9 | 0% | 97% | |
| 10 | 0% | 97% | |
| 11 | 0% | 97% | |
| 12 | 0% | 97% | |
| 13 | 0% | 97% | |
| 14 | 0% | 97% | |
| 15 | 0% | 97% | |
| 16 | 0% | 97% | |
| 17 | 0% | 97% | |
| 18 | 0% | 97% | |
| 19 | 0% | 97% | |
| 20 | 0% | 97% | |
| 21 | 0% | 97% | |
| 22 | 0% | 97% | |
| 23 | 0% | 97% | |
| 24 | 0% | 97% | |
| 25 | 0% | 97% | |
| 26 | 0% | 97% | |
| 27 | 0% | 97% | |
| 28 | 0% | 97% | |
| 29 | 0% | 97% | |
| 30 | 0% | 97% | |
| 31 | 0% | 97% | |
| 32 | 0% | 97% | |
| 33 | 0% | 97% | |
| 34 | 0% | 97% | |
| 35 | 0% | 97% | |
| 36 | 0% | 97% | |
| 37 | 0% | 97% | |
| 38 | 0.5% | 97% | |
| 39 | 2% | 96% | |
| 40 | 3% | 95% | |
| 41 | 3% | 92% | |
| 42 | 4% | 89% | |
| 43 | 4% | 85% | |
| 44 | 6% | 81% | |
| 45 | 6% | 75% | |
| 46 | 7% | 69% | |
| 47 | 7% | 62% | |
| 48 | 6% | 55% | Median |
| 49 | 6% | 49% | |
| 50 | 5% | 43% | |
| 51 | 5% | 38% | |
| 52 | 4% | 33% | |
| 53 | 4% | 29% | |
| 54 | 4% | 25% | |
| 55 | 3% | 21% | |
| 56 | 3% | 18% | |
| 57 | 2% | 15% | |
| 58 | 2% | 13% | |
| 59 | 1.2% | 12% | |
| 60 | 1.4% | 10% | |
| 61 | 0.9% | 9% | |
| 62 | 1.3% | 8% | |
| 63 | 1.1% | 7% | |
| 64 | 1.1% | 6% | |
| 65 | 0.9% | 5% | |
| 66 | 0.8% | 4% | |
| 67 | 0.6% | 3% | |
| 68 | 0.5% | 2% | |
| 69 | 0.4% | 2% | Last Result |
| 70 | 0.3% | 1.4% | |
| 71 | 0.3% | 1.1% | |
| 72 | 0.3% | 0.8% | |
| 73 | 0.1% | 0.5% | |
| 74 | 0.1% | 0.4% | |
| 75 | 0.1% | 0.2% | |
| 76 | 0.1% | 0.1% | |
| 77 | 0% | 0.1% | |
| 78 | 0% | 0.1% | |
| 79 | 0% | 0% |
Bündnis 90/Die Grünen
For a full overview of the results for this party, see the Bündnis 90/Die Grünen page.
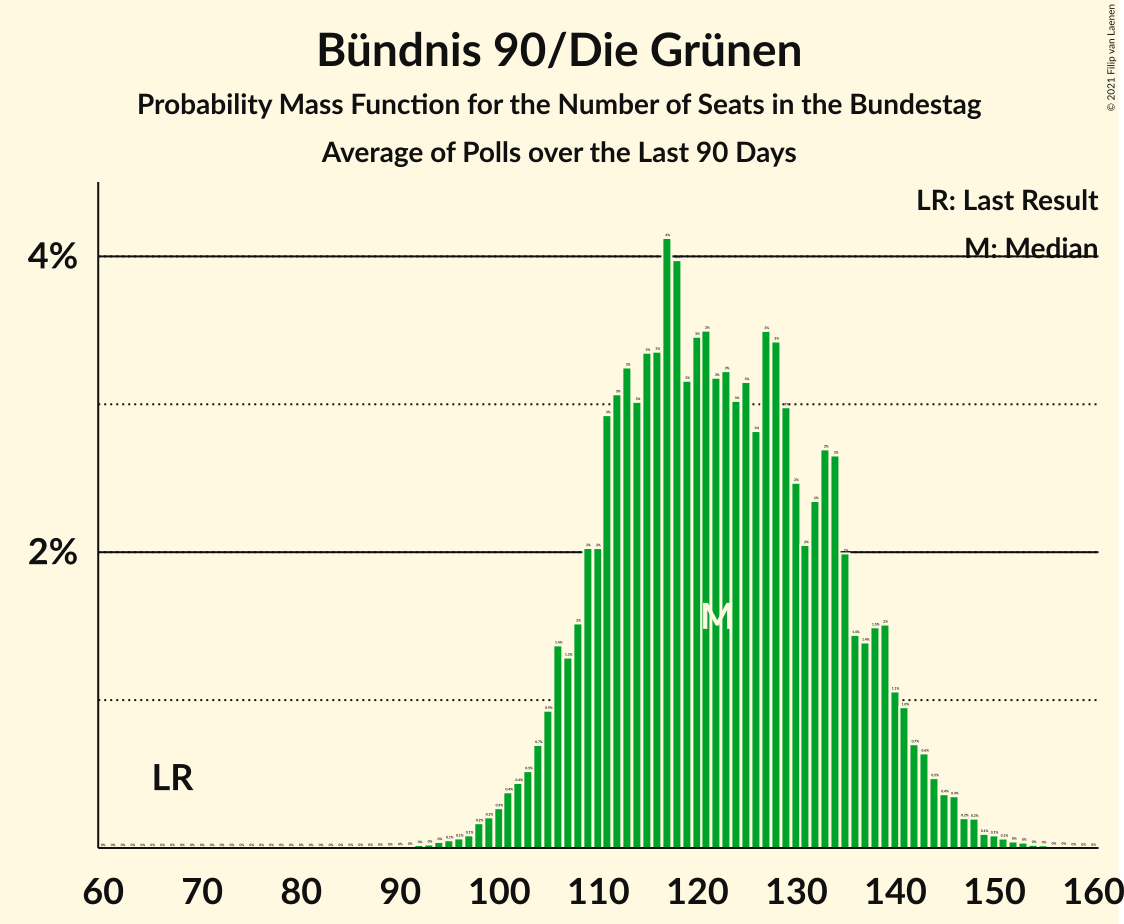
| Number of Seats | Probability | Accumulated | Special Marks |
|---|---|---|---|
| 67 | 0% | 100% | Last Result |
| 68 | 0% | 100% | |
| 69 | 0% | 100% | |
| 70 | 0% | 100% | |
| 71 | 0% | 100% | |
| 72 | 0% | 100% | |
| 73 | 0% | 100% | |
| 74 | 0% | 100% | |
| 75 | 0% | 100% | |
| 76 | 0% | 100% | |
| 77 | 0% | 100% | |
| 78 | 0% | 100% | |
| 79 | 0% | 100% | |
| 80 | 0% | 100% | |
| 81 | 0% | 100% | |
| 82 | 0% | 100% | |
| 83 | 0% | 100% | |
| 84 | 0% | 100% | |
| 85 | 0% | 100% | |
| 86 | 0% | 100% | |
| 87 | 0% | 100% | |
| 88 | 0% | 100% | |
| 89 | 0% | 100% | |
| 90 | 0% | 100% | |
| 91 | 0% | 100% | |
| 92 | 0% | 100% | |
| 93 | 0% | 100% | |
| 94 | 0% | 99.9% | |
| 95 | 0.1% | 99.9% | |
| 96 | 0.1% | 99.8% | |
| 97 | 0.1% | 99.8% | |
| 98 | 0.2% | 99.7% | |
| 99 | 0.2% | 99.5% | |
| 100 | 0.3% | 99.3% | |
| 101 | 0.4% | 99.0% | |
| 102 | 0.4% | 98.7% | |
| 103 | 0.5% | 98% | |
| 104 | 0.7% | 98% | |
| 105 | 0.9% | 97% | |
| 106 | 1.4% | 96% | |
| 107 | 1.3% | 95% | |
| 108 | 2% | 93% | |
| 109 | 2% | 92% | |
| 110 | 2% | 90% | |
| 111 | 3% | 88% | |
| 112 | 3% | 85% | |
| 113 | 3% | 82% | |
| 114 | 3% | 79% | |
| 115 | 3% | 76% | |
| 116 | 3% | 72% | |
| 117 | 4% | 69% | |
| 118 | 4% | 65% | |
| 119 | 3% | 61% | |
| 120 | 3% | 58% | |
| 121 | 3% | 54% | |
| 122 | 3% | 51% | Median |
| 123 | 3% | 47% | |
| 124 | 3% | 44% | |
| 125 | 3% | 41% | |
| 126 | 3% | 38% | |
| 127 | 3% | 35% | |
| 128 | 3% | 32% | |
| 129 | 3% | 28% | |
| 130 | 2% | 25% | |
| 131 | 2% | 23% | |
| 132 | 2% | 21% | |
| 133 | 3% | 19% | |
| 134 | 3% | 16% | |
| 135 | 2% | 13% | |
| 136 | 1.4% | 11% | |
| 137 | 1.4% | 10% | |
| 138 | 1.5% | 8% | |
| 139 | 2% | 7% | |
| 140 | 1.1% | 5% | |
| 141 | 1.0% | 4% | |
| 142 | 0.7% | 3% | |
| 143 | 0.6% | 3% | |
| 144 | 0.5% | 2% | |
| 145 | 0.4% | 2% | |
| 146 | 0.4% | 1.1% | |
| 147 | 0.2% | 0.8% | |
| 148 | 0.2% | 0.6% | |
| 149 | 0.1% | 0.4% | |
| 150 | 0.1% | 0.3% | |
| 151 | 0.1% | 0.2% | |
| 152 | 0% | 0.2% | |
| 153 | 0% | 0.1% | |
| 154 | 0% | 0.1% | |
| 155 | 0% | 0.1% | |
| 156 | 0% | 0% |
Christlich-Soziale Union in Bayern
For a full overview of the results for this party, see the Christlich-Soziale Union in Bayern page.
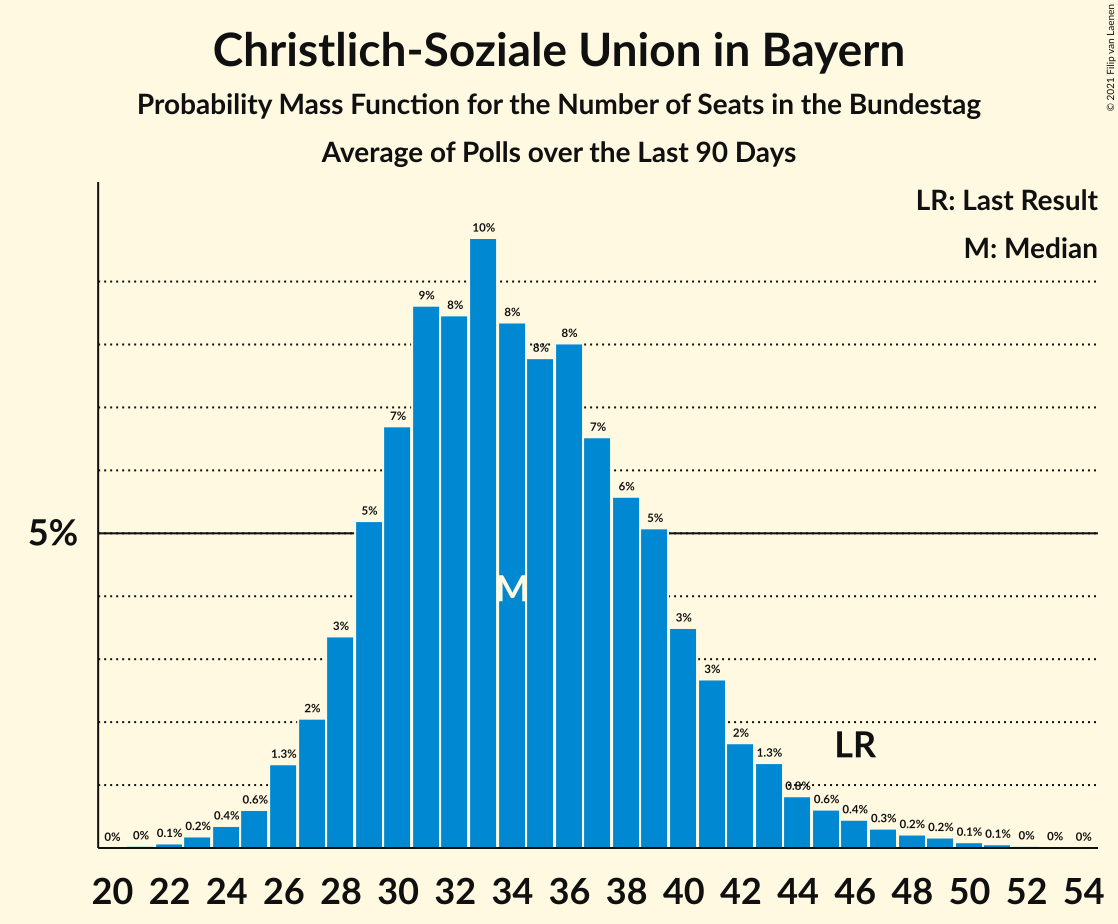
| Number of Seats | Probability | Accumulated | Special Marks |
|---|---|---|---|
| 21 | 0% | 100% | |
| 22 | 0.1% | 99.9% | |
| 23 | 0.2% | 99.9% | |
| 24 | 0.4% | 99.7% | |
| 25 | 0.6% | 99.3% | |
| 26 | 1.3% | 98.7% | |
| 27 | 2% | 97% | |
| 28 | 3% | 95% | |
| 29 | 5% | 92% | |
| 30 | 7% | 87% | |
| 31 | 9% | 80% | |
| 32 | 8% | 71% | |
| 33 | 10% | 63% | |
| 34 | 8% | 53% | Median |
| 35 | 8% | 45% | |
| 36 | 8% | 37% | |
| 37 | 7% | 29% | |
| 38 | 6% | 23% | |
| 39 | 5% | 17% | |
| 40 | 3% | 12% | |
| 41 | 3% | 8% | |
| 42 | 2% | 6% | |
| 43 | 1.3% | 4% | |
| 44 | 0.8% | 3% | |
| 45 | 0.6% | 2% | |
| 46 | 0.4% | 1.4% | Last Result |
| 47 | 0.3% | 0.9% | |
| 48 | 0.2% | 0.6% | |
| 49 | 0.2% | 0.4% | |
| 50 | 0.1% | 0.2% | |
| 51 | 0.1% | 0.1% | |
| 52 | 0% | 0.1% | |
| 53 | 0% | 0% |
Freie Wähler
For a full overview of the results for this party, see the Freie Wähler page.
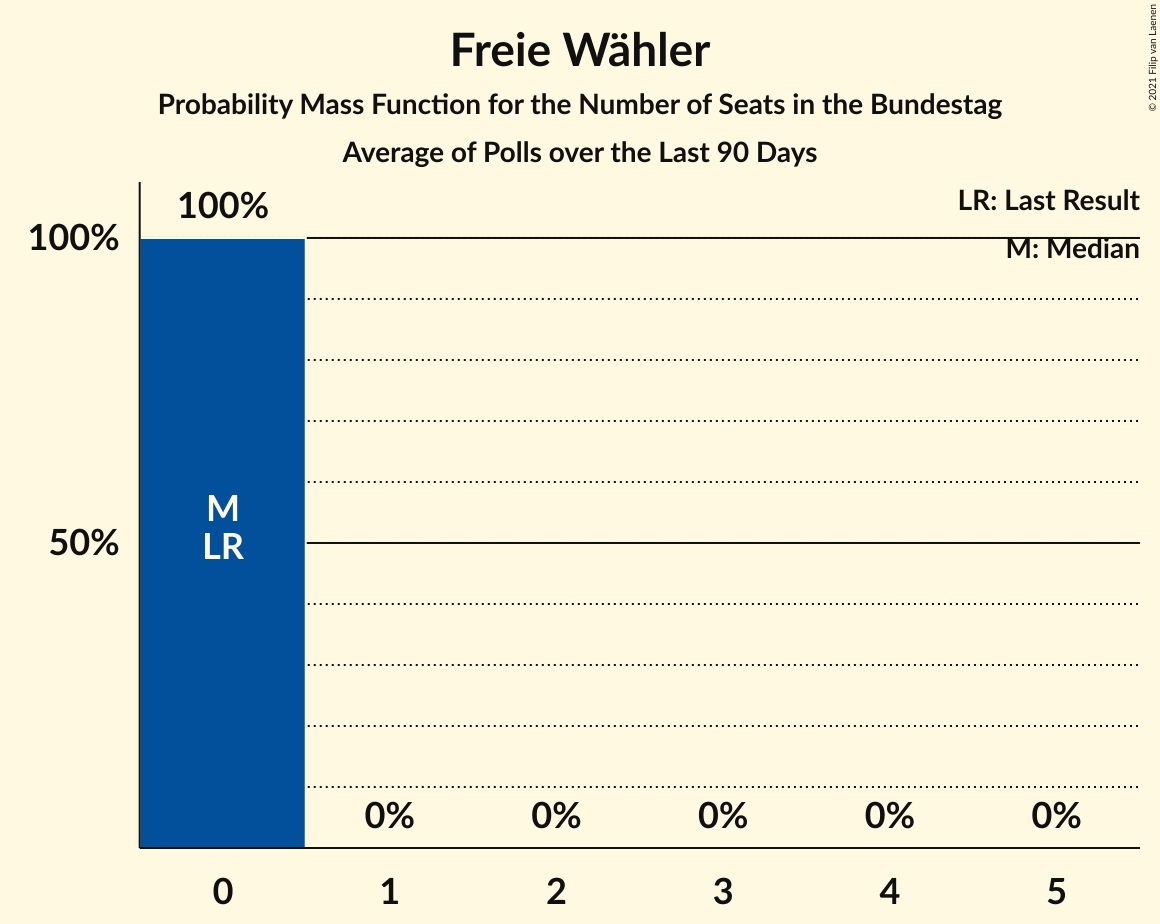
| Number of Seats | Probability | Accumulated | Special Marks |
|---|---|---|---|
| 0 | 100% | 100% | Last Result, Median |
Coalitions
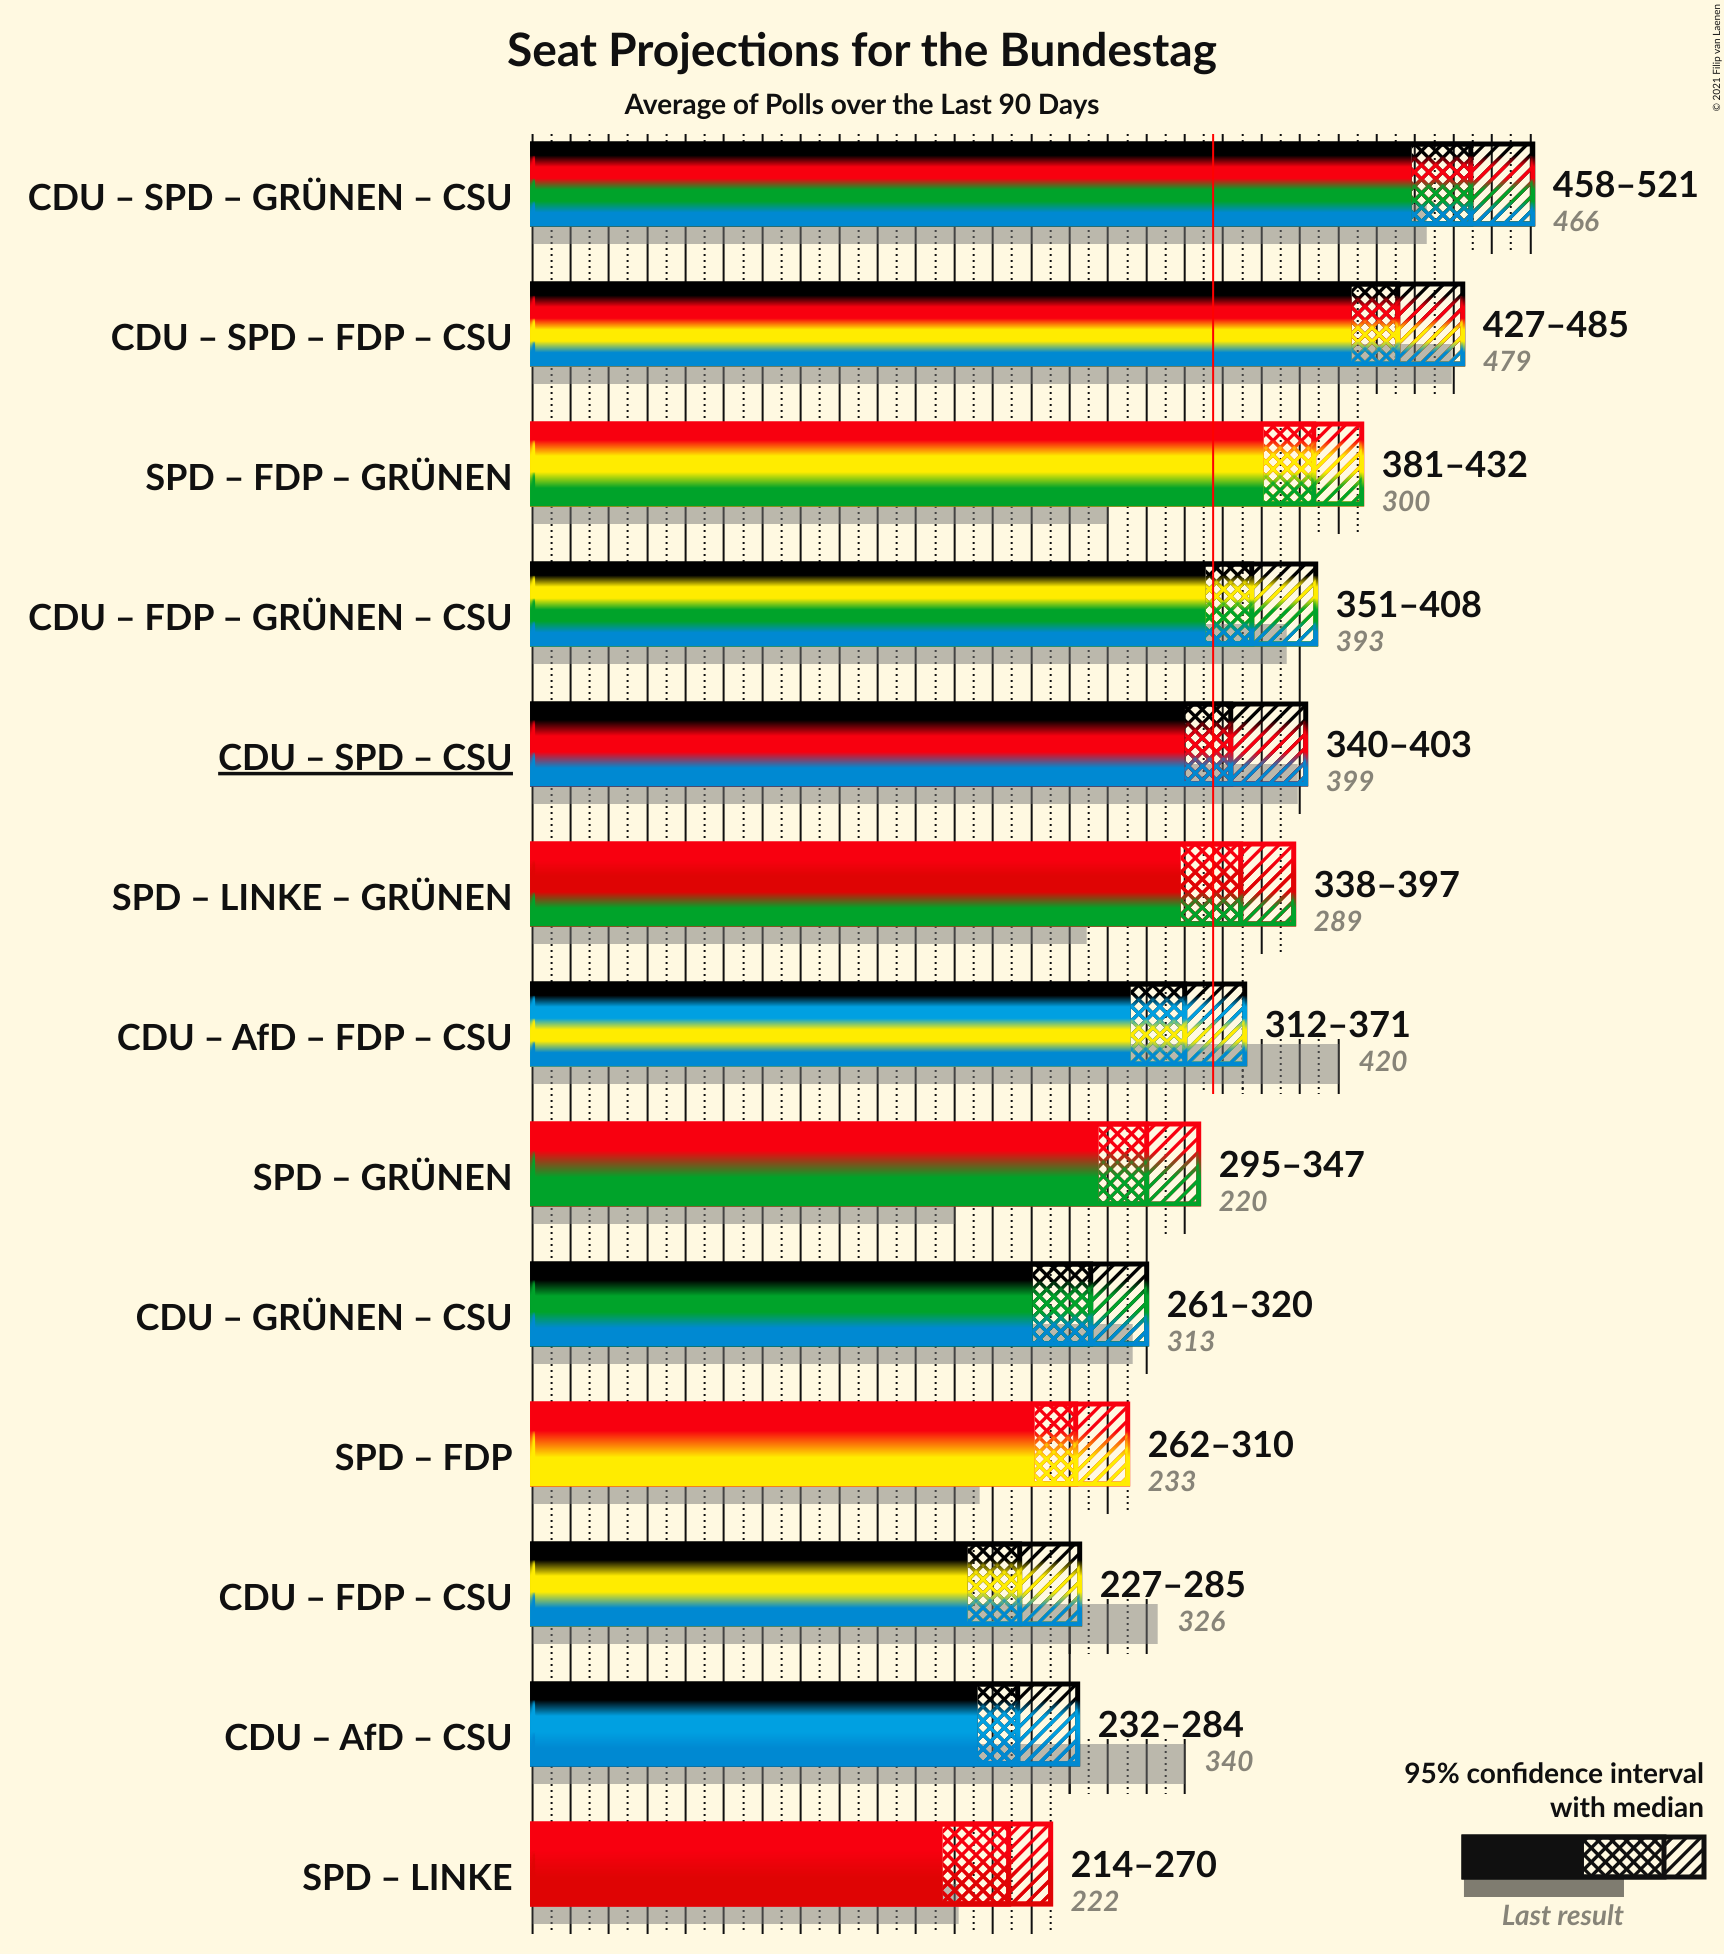
Confidence Intervals
| Coalition | Last Result | Median | Majority? | 80% Confidence Interval | 90% Confidence Interval | 95% Confidence Interval | 99% Confidence Interval |
|---|---|---|---|---|---|---|---|
| Christlich Demokratische Union Deutschlands – Sozialdemokratische Partei Deutschlands – Bündnis 90/Die Grünen – Christlich-Soziale Union in Bayern | 466 | 489 | 100% | 470–508 | 464–515 | 458–521 | 448–539 |
| Christlich Demokratische Union Deutschlands – Sozialdemokratische Partei Deutschlands – Freie Demokratische Partei – Christlich-Soziale Union in Bayern | 479 | 451 | 100% | 434–471 | 430–477 | 427–485 | 421–501 |
| Sozialdemokratische Partei Deutschlands – Freie Demokratische Partei – Bündnis 90/Die Grünen | 300 | 407 | 100% | 390–421 | 385–426 | 381–432 | 373–445 |
| Christlich Demokratische Union Deutschlands – Freie Demokratische Partei – Bündnis 90/Die Grünen – Christlich-Soziale Union in Bayern | 393 | 375 | 95% | 359–394 | 354–402 | 351–408 | 343–422 |
| Christlich Demokratische Union Deutschlands – Sozialdemokratische Partei Deutschlands – Christlich-Soziale Union in Bayern | 399 | 364 | 79% | 349–388 | 344–397 | 340–403 | 332–416 |
| Sozialdemokratische Partei Deutschlands – Die Linke – Bündnis 90/Die Grünen | 289 | 369 | 85% | 350–388 | 344–393 | 338–397 | 324–404 |
| Christlich Demokratische Union Deutschlands – Alternative für Deutschland – Freie Demokratische Partei – Christlich-Soziale Union in Bayern | 420 | 340 | 15% | 321–359 | 316–365 | 312–371 | 305–385 |
| Sozialdemokratische Partei Deutschlands – Bündnis 90/Die Grünen | 220 | 320 | 0.5% | 304–337 | 299–343 | 295–347 | 287–355 |
| Christlich Demokratische Union Deutschlands – Bündnis 90/Die Grünen – Christlich-Soziale Union in Bayern | 313 | 291 | 0% | 272–309 | 266–314 | 261–320 | 251–331 |
| Sozialdemokratische Partei Deutschlands – Freie Demokratische Partei | 233 | 283 | 0% | 269–300 | 265–305 | 262–310 | 255–319 |
| Christlich Demokratische Union Deutschlands – Freie Demokratische Partei – Christlich-Soziale Union in Bayern | 326 | 254 | 0% | 235–273 | 231–280 | 227–285 | 221–297 |
| Christlich Demokratische Union Deutschlands – Alternative für Deutschland – Christlich-Soziale Union in Bayern | 340 | 253 | 0% | 239–272 | 236–278 | 232–284 | 226–293 |
| Sozialdemokratische Partei Deutschlands – Die Linke | 222 | 248 | 0% | 230–263 | 223–267 | 214–270 | 198–277 |
Christlich Demokratische Union Deutschlands – Sozialdemokratische Partei Deutschlands – Bündnis 90/Die Grünen – Christlich-Soziale Union in Bayern
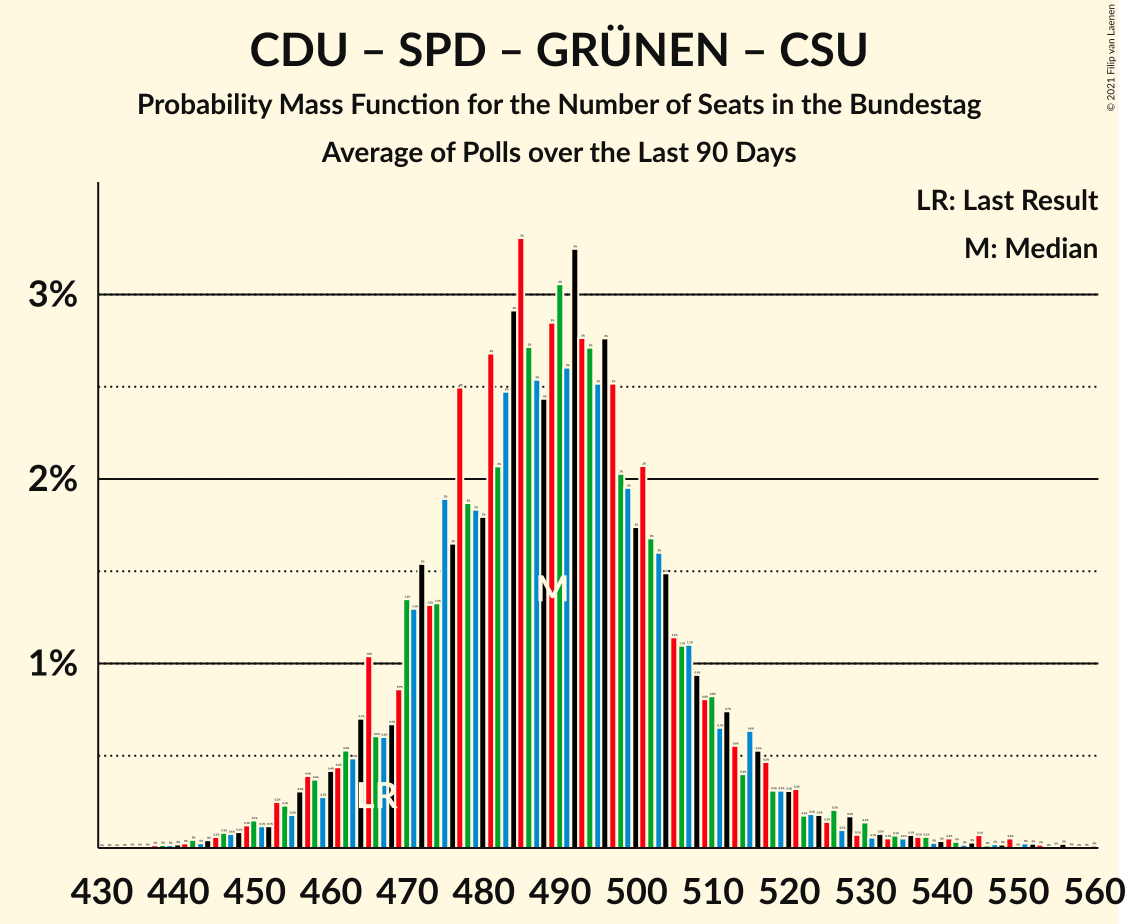
| Number of Seats | Probability | Accumulated | Special Marks |
|---|---|---|---|
| 438 | 0% | 100% | |
| 439 | 0% | 99.9% | |
| 440 | 0% | 99.9% | |
| 441 | 0% | 99.9% | |
| 442 | 0% | 99.9% | |
| 443 | 0% | 99.8% | |
| 444 | 0% | 99.8% | |
| 445 | 0.1% | 99.8% | |
| 446 | 0.1% | 99.7% | |
| 447 | 0.1% | 99.6% | |
| 448 | 0.1% | 99.5% | |
| 449 | 0.1% | 99.5% | |
| 450 | 0.1% | 99.3% | |
| 451 | 0.1% | 99.2% | |
| 452 | 0.1% | 99.1% | |
| 453 | 0.2% | 99.0% | |
| 454 | 0.2% | 98.7% | |
| 455 | 0.2% | 98% | |
| 456 | 0.3% | 98% | |
| 457 | 0.4% | 98% | |
| 458 | 0.4% | 98% | |
| 459 | 0.3% | 97% | |
| 460 | 0.4% | 97% | |
| 461 | 0.4% | 97% | |
| 462 | 0.5% | 96% | |
| 463 | 0.5% | 96% | |
| 464 | 0.7% | 95% | |
| 465 | 1.0% | 94% | |
| 466 | 0.6% | 93% | Last Result |
| 467 | 0.6% | 93% | |
| 468 | 0.7% | 92% | |
| 469 | 0.9% | 91% | |
| 470 | 1.3% | 91% | |
| 471 | 1.3% | 89% | |
| 472 | 2% | 88% | |
| 473 | 1.3% | 86% | |
| 474 | 1.3% | 85% | |
| 475 | 2% | 84% | |
| 476 | 2% | 82% | |
| 477 | 2% | 80% | |
| 478 | 2% | 78% | |
| 479 | 2% | 76% | |
| 480 | 2% | 74% | |
| 481 | 3% | 72% | |
| 482 | 2% | 70% | |
| 483 | 2% | 67% | |
| 484 | 3% | 65% | |
| 485 | 3% | 62% | |
| 486 | 3% | 59% | |
| 487 | 3% | 56% | Median |
| 488 | 2% | 54% | |
| 489 | 3% | 51% | |
| 490 | 3% | 48% | |
| 491 | 3% | 45% | |
| 492 | 3% | 43% | |
| 493 | 3% | 39% | |
| 494 | 3% | 37% | |
| 495 | 3% | 34% | |
| 496 | 3% | 31% | |
| 497 | 3% | 29% | |
| 498 | 2% | 26% | |
| 499 | 2% | 24% | |
| 500 | 2% | 22% | |
| 501 | 2% | 20% | |
| 502 | 2% | 18% | |
| 503 | 2% | 17% | |
| 504 | 1.5% | 15% | |
| 505 | 1.1% | 14% | |
| 506 | 1.1% | 12% | |
| 507 | 1.1% | 11% | |
| 508 | 0.9% | 10% | |
| 509 | 0.8% | 9% | |
| 510 | 0.8% | 8% | |
| 511 | 0.7% | 8% | |
| 512 | 0.7% | 7% | |
| 513 | 0.6% | 6% | |
| 514 | 0.4% | 6% | |
| 515 | 0.6% | 5% | |
| 516 | 0.5% | 5% | |
| 517 | 0.5% | 4% | |
| 518 | 0.3% | 4% | |
| 519 | 0.3% | 3% | |
| 520 | 0.3% | 3% | |
| 521 | 0.3% | 3% | |
| 522 | 0.2% | 2% | |
| 523 | 0.2% | 2% | |
| 524 | 0.2% | 2% | |
| 525 | 0.1% | 2% | |
| 526 | 0.2% | 2% | |
| 527 | 0.1% | 1.5% | |
| 528 | 0.2% | 1.4% | |
| 529 | 0.1% | 1.2% | |
| 530 | 0.1% | 1.2% | |
| 531 | 0.1% | 1.0% | |
| 532 | 0.1% | 1.0% | |
| 533 | 0.1% | 0.9% | |
| 534 | 0.1% | 0.8% | |
| 535 | 0.1% | 0.8% | |
| 536 | 0.1% | 0.7% | |
| 537 | 0.1% | 0.6% | |
| 538 | 0.1% | 0.6% | |
| 539 | 0% | 0.5% | |
| 540 | 0% | 0.5% | |
| 541 | 0.1% | 0.5% | |
| 542 | 0% | 0.4% | |
| 543 | 0% | 0.4% | |
| 544 | 0% | 0.4% | |
| 545 | 0.1% | 0.3% | |
| 546 | 0% | 0.3% | |
| 547 | 0% | 0.2% | |
| 548 | 0% | 0.2% | |
| 549 | 0.1% | 0.2% | |
| 550 | 0% | 0.1% | |
| 551 | 0% | 0.1% | |
| 552 | 0% | 0.1% | |
| 553 | 0% | 0.1% | |
| 554 | 0% | 0.1% | |
| 555 | 0% | 0.1% | |
| 556 | 0% | 0.1% | |
| 557 | 0% | 0% |
Christlich Demokratische Union Deutschlands – Sozialdemokratische Partei Deutschlands – Freie Demokratische Partei – Christlich-Soziale Union in Bayern
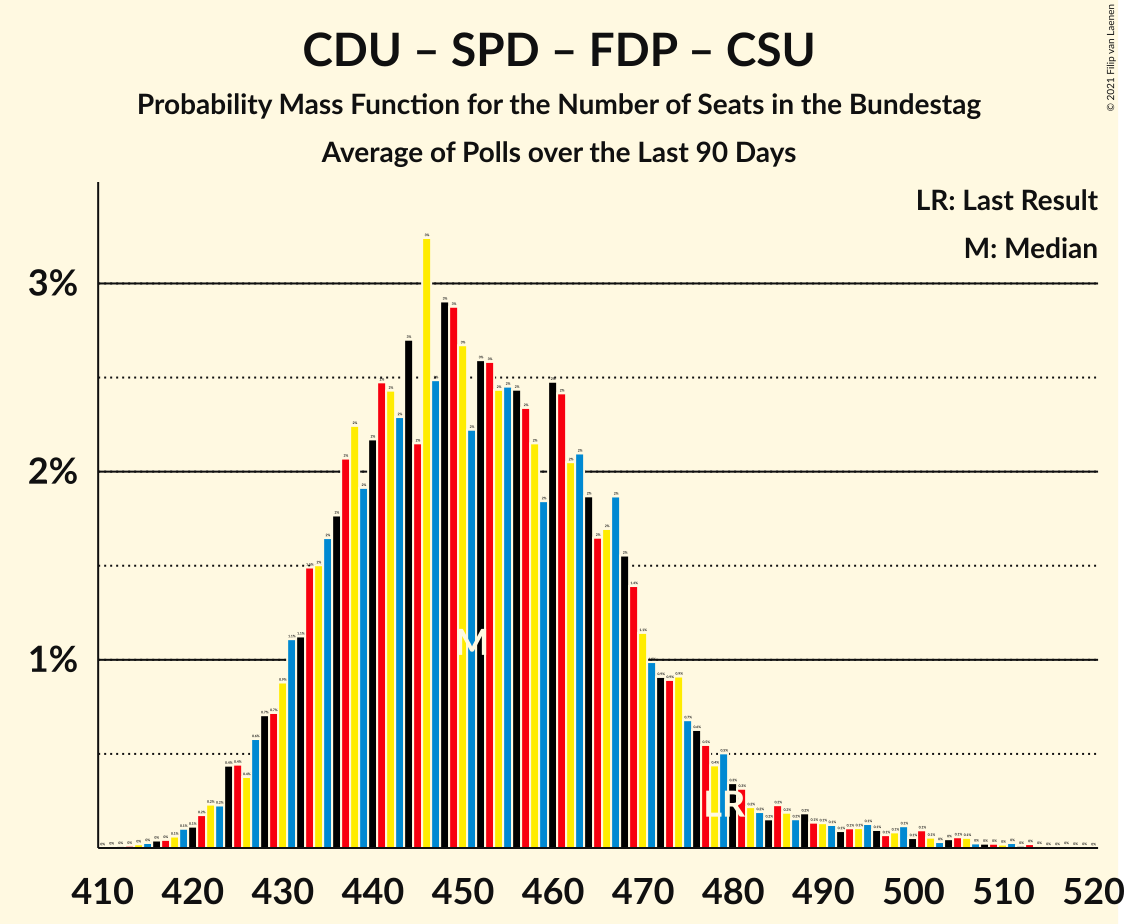
| Number of Seats | Probability | Accumulated | Special Marks |
|---|---|---|---|
| 414 | 0% | 100% | |
| 415 | 0% | 99.9% | |
| 416 | 0% | 99.9% | |
| 417 | 0% | 99.9% | |
| 418 | 0.1% | 99.8% | |
| 419 | 0.1% | 99.8% | |
| 420 | 0.1% | 99.7% | |
| 421 | 0.2% | 99.5% | |
| 422 | 0.2% | 99.4% | |
| 423 | 0.2% | 99.1% | |
| 424 | 0.4% | 98.9% | |
| 425 | 0.4% | 98% | |
| 426 | 0.4% | 98% | |
| 427 | 0.6% | 98% | |
| 428 | 0.7% | 97% | |
| 429 | 0.7% | 96% | |
| 430 | 0.9% | 96% | |
| 431 | 1.1% | 95% | |
| 432 | 1.1% | 94% | |
| 433 | 1.5% | 93% | |
| 434 | 2% | 91% | |
| 435 | 2% | 90% | |
| 436 | 2% | 88% | |
| 437 | 2% | 86% | |
| 438 | 2% | 84% | |
| 439 | 2% | 82% | |
| 440 | 2% | 80% | |
| 441 | 2% | 78% | |
| 442 | 2% | 75% | |
| 443 | 2% | 73% | |
| 444 | 3% | 71% | |
| 445 | 2% | 68% | |
| 446 | 3% | 66% | |
| 447 | 2% | 62% | |
| 448 | 3% | 60% | |
| 449 | 3% | 57% | |
| 450 | 3% | 54% | Median |
| 451 | 2% | 52% | |
| 452 | 3% | 49% | |
| 453 | 3% | 47% | |
| 454 | 2% | 44% | |
| 455 | 2% | 42% | |
| 456 | 2% | 39% | |
| 457 | 2% | 37% | |
| 458 | 2% | 34% | |
| 459 | 2% | 32% | |
| 460 | 2% | 30% | |
| 461 | 2% | 28% | |
| 462 | 2% | 26% | |
| 463 | 2% | 24% | |
| 464 | 2% | 21% | |
| 465 | 2% | 20% | |
| 466 | 2% | 18% | |
| 467 | 2% | 16% | |
| 468 | 2% | 14% | |
| 469 | 1.4% | 13% | |
| 470 | 1.1% | 11% | |
| 471 | 1.0% | 10% | |
| 472 | 0.9% | 9% | |
| 473 | 0.9% | 8% | |
| 474 | 0.9% | 7% | |
| 475 | 0.7% | 7% | |
| 476 | 0.6% | 6% | |
| 477 | 0.5% | 5% | |
| 478 | 0.4% | 5% | |
| 479 | 0.5% | 4% | Last Result |
| 480 | 0.3% | 4% | |
| 481 | 0.3% | 3% | |
| 482 | 0.2% | 3% | |
| 483 | 0.2% | 3% | |
| 484 | 0.2% | 3% | |
| 485 | 0.2% | 3% | |
| 486 | 0.2% | 2% | |
| 487 | 0.2% | 2% | |
| 488 | 0.2% | 2% | |
| 489 | 0.1% | 2% | |
| 490 | 0.1% | 2% | |
| 491 | 0.1% | 2% | |
| 492 | 0.1% | 1.4% | |
| 493 | 0.1% | 1.3% | |
| 494 | 0.1% | 1.2% | |
| 495 | 0.1% | 1.1% | |
| 496 | 0.1% | 1.0% | |
| 497 | 0.1% | 0.9% | |
| 498 | 0.1% | 0.8% | |
| 499 | 0.1% | 0.7% | |
| 500 | 0.1% | 0.6% | |
| 501 | 0.1% | 0.5% | |
| 502 | 0.1% | 0.4% | |
| 503 | 0% | 0.4% | |
| 504 | 0% | 0.4% | |
| 505 | 0.1% | 0.3% | |
| 506 | 0.1% | 0.3% | |
| 507 | 0% | 0.2% | |
| 508 | 0% | 0.2% | |
| 509 | 0% | 0.2% | |
| 510 | 0% | 0.1% | |
| 511 | 0% | 0.1% | |
| 512 | 0% | 0.1% | |
| 513 | 0% | 0.1% | |
| 514 | 0% | 0.1% | |
| 515 | 0% | 0% |
Sozialdemokratische Partei Deutschlands – Freie Demokratische Partei – Bündnis 90/Die Grünen
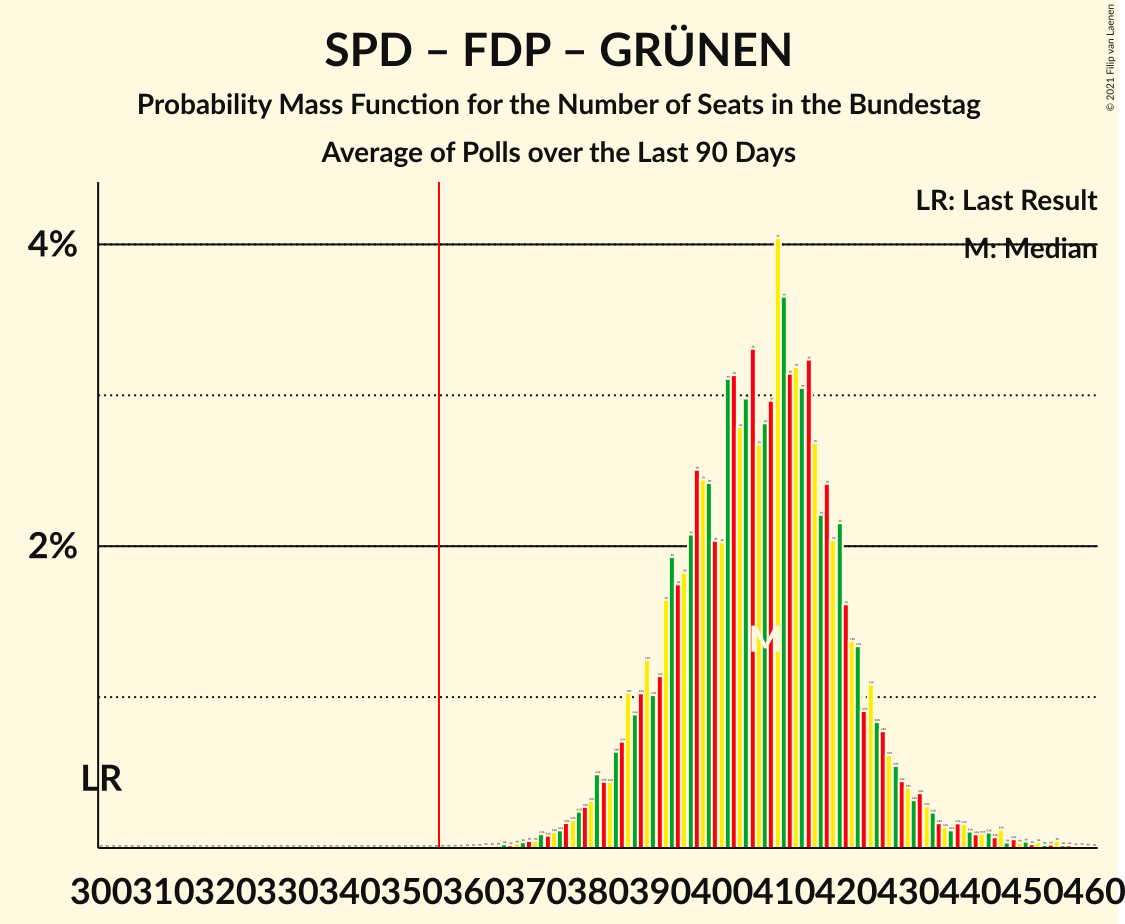
| Number of Seats | Probability | Accumulated | Special Marks |
|---|---|---|---|
| 300 | 0% | 100% | Last Result |
| 301 | 0% | 100% | |
| 302 | 0% | 100% | |
| 303 | 0% | 100% | |
| 304 | 0% | 100% | |
| 305 | 0% | 100% | |
| 306 | 0% | 100% | |
| 307 | 0% | 100% | |
| 308 | 0% | 100% | |
| 309 | 0% | 100% | |
| 310 | 0% | 100% | |
| 311 | 0% | 100% | |
| 312 | 0% | 100% | |
| 313 | 0% | 100% | |
| 314 | 0% | 100% | |
| 315 | 0% | 100% | |
| 316 | 0% | 100% | |
| 317 | 0% | 100% | |
| 318 | 0% | 100% | |
| 319 | 0% | 100% | |
| 320 | 0% | 100% | |
| 321 | 0% | 100% | |
| 322 | 0% | 100% | |
| 323 | 0% | 100% | |
| 324 | 0% | 100% | |
| 325 | 0% | 100% | |
| 326 | 0% | 100% | |
| 327 | 0% | 100% | |
| 328 | 0% | 100% | |
| 329 | 0% | 100% | |
| 330 | 0% | 100% | |
| 331 | 0% | 100% | |
| 332 | 0% | 100% | |
| 333 | 0% | 100% | |
| 334 | 0% | 100% | |
| 335 | 0% | 100% | |
| 336 | 0% | 100% | |
| 337 | 0% | 100% | |
| 338 | 0% | 100% | |
| 339 | 0% | 100% | |
| 340 | 0% | 100% | |
| 341 | 0% | 100% | |
| 342 | 0% | 100% | |
| 343 | 0% | 100% | |
| 344 | 0% | 100% | |
| 345 | 0% | 100% | |
| 346 | 0% | 100% | |
| 347 | 0% | 100% | |
| 348 | 0% | 100% | |
| 349 | 0% | 100% | |
| 350 | 0% | 100% | |
| 351 | 0% | 100% | |
| 352 | 0% | 100% | |
| 353 | 0% | 100% | |
| 354 | 0% | 100% | |
| 355 | 0% | 100% | Majority |
| 356 | 0% | 100% | |
| 357 | 0% | 100% | |
| 358 | 0% | 100% | |
| 359 | 0% | 100% | |
| 360 | 0% | 100% | |
| 361 | 0% | 100% | |
| 362 | 0% | 100% | |
| 363 | 0% | 100% | |
| 364 | 0% | 99.9% | |
| 365 | 0% | 99.9% | |
| 366 | 0% | 99.9% | |
| 367 | 0% | 99.9% | |
| 368 | 0% | 99.9% | |
| 369 | 0% | 99.8% | |
| 370 | 0% | 99.8% | |
| 371 | 0.1% | 99.7% | |
| 372 | 0.1% | 99.6% | |
| 373 | 0.1% | 99.6% | |
| 374 | 0.1% | 99.5% | |
| 375 | 0.2% | 99.3% | |
| 376 | 0.2% | 99.2% | |
| 377 | 0.2% | 99.0% | |
| 378 | 0.3% | 98.7% | |
| 379 | 0.3% | 98% | |
| 380 | 0.5% | 98% | |
| 381 | 0.4% | 98% | |
| 382 | 0.4% | 97% | |
| 383 | 0.6% | 97% | |
| 384 | 0.7% | 96% | |
| 385 | 1.0% | 95% | |
| 386 | 0.9% | 94% | |
| 387 | 1.0% | 94% | |
| 388 | 1.2% | 93% | |
| 389 | 1.0% | 91% | |
| 390 | 1.1% | 90% | |
| 391 | 2% | 89% | |
| 392 | 2% | 87% | |
| 393 | 2% | 86% | |
| 394 | 2% | 84% | |
| 395 | 2% | 82% | |
| 396 | 3% | 80% | |
| 397 | 2% | 77% | |
| 398 | 2% | 75% | |
| 399 | 2% | 73% | |
| 400 | 2% | 70% | |
| 401 | 3% | 68% | |
| 402 | 3% | 65% | |
| 403 | 3% | 62% | |
| 404 | 3% | 59% | |
| 405 | 3% | 56% | Median |
| 406 | 3% | 53% | |
| 407 | 3% | 50% | |
| 408 | 3% | 48% | |
| 409 | 4% | 45% | |
| 410 | 4% | 41% | |
| 411 | 3% | 37% | |
| 412 | 3% | 34% | |
| 413 | 3% | 31% | |
| 414 | 3% | 28% | |
| 415 | 3% | 24% | |
| 416 | 2% | 22% | |
| 417 | 2% | 19% | |
| 418 | 2% | 17% | |
| 419 | 2% | 15% | |
| 420 | 2% | 13% | |
| 421 | 1.4% | 11% | |
| 422 | 1.3% | 10% | |
| 423 | 0.9% | 9% | |
| 424 | 1.1% | 8% | |
| 425 | 0.8% | 7% | |
| 426 | 0.8% | 6% | |
| 427 | 0.6% | 5% | |
| 428 | 0.5% | 4% | |
| 429 | 0.4% | 4% | |
| 430 | 0.4% | 3% | |
| 431 | 0.3% | 3% | |
| 432 | 0.4% | 3% | |
| 433 | 0.3% | 2% | |
| 434 | 0.2% | 2% | |
| 435 | 0.2% | 2% | |
| 436 | 0.1% | 2% | |
| 437 | 0.1% | 1.5% | |
| 438 | 0.2% | 1.3% | |
| 439 | 0.2% | 1.2% | |
| 440 | 0.1% | 1.0% | |
| 441 | 0.1% | 0.9% | |
| 442 | 0.1% | 0.8% | |
| 443 | 0.1% | 0.7% | |
| 444 | 0.1% | 0.6% | |
| 445 | 0.1% | 0.6% | |
| 446 | 0% | 0.4% | |
| 447 | 0.1% | 0.4% | |
| 448 | 0% | 0.3% | |
| 449 | 0% | 0.3% | |
| 450 | 0% | 0.3% | |
| 451 | 0% | 0.2% | |
| 452 | 0% | 0.2% | |
| 453 | 0% | 0.2% | |
| 454 | 0% | 0.2% | |
| 455 | 0% | 0.1% | |
| 456 | 0% | 0.1% | |
| 457 | 0% | 0.1% | |
| 458 | 0% | 0.1% | |
| 459 | 0% | 0% |
Christlich Demokratische Union Deutschlands – Freie Demokratische Partei – Bündnis 90/Die Grünen – Christlich-Soziale Union in Bayern
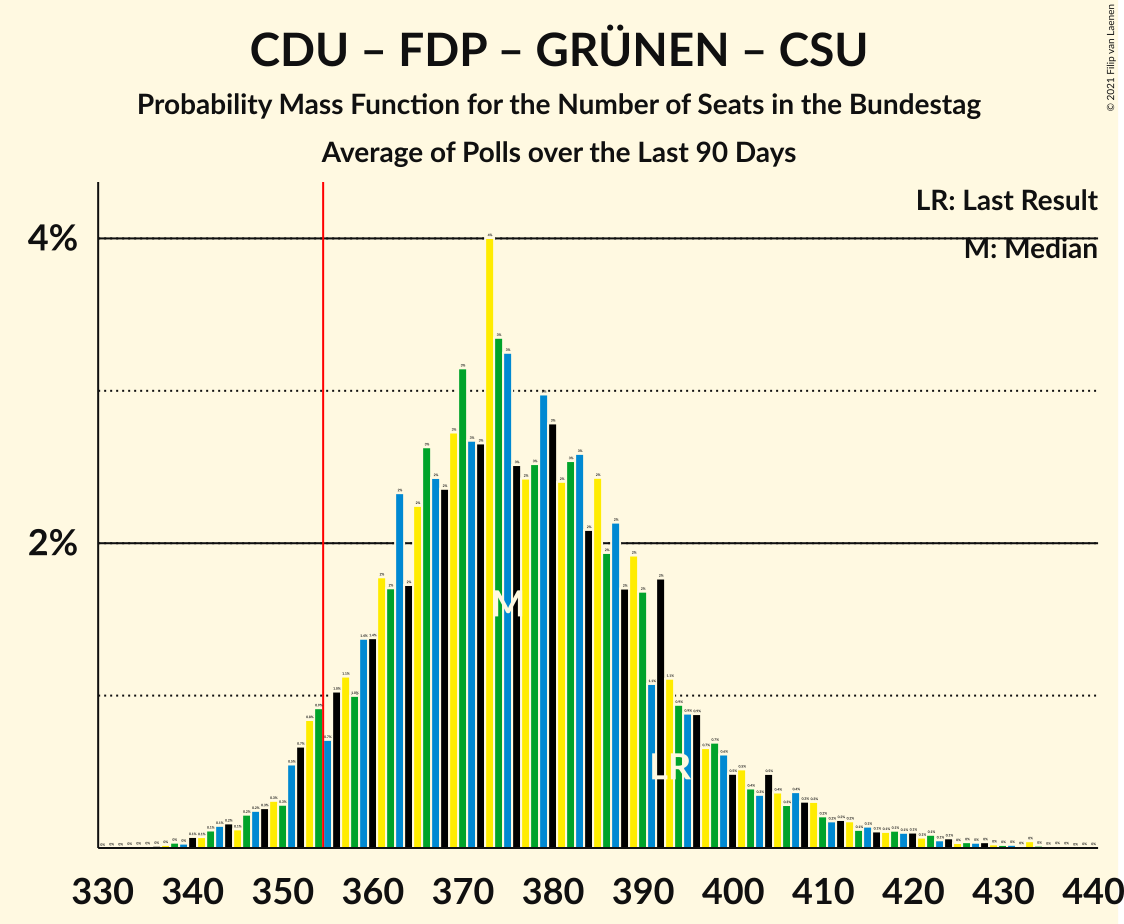
| Number of Seats | Probability | Accumulated | Special Marks |
|---|---|---|---|
| 336 | 0% | 100% | |
| 337 | 0% | 99.9% | |
| 338 | 0% | 99.9% | |
| 339 | 0% | 99.9% | |
| 340 | 0.1% | 99.9% | |
| 341 | 0.1% | 99.8% | |
| 342 | 0.1% | 99.7% | |
| 343 | 0.1% | 99.6% | |
| 344 | 0.2% | 99.4% | |
| 345 | 0.1% | 99.3% | |
| 346 | 0.2% | 99.2% | |
| 347 | 0.2% | 98.9% | |
| 348 | 0.3% | 98.7% | |
| 349 | 0.3% | 98% | |
| 350 | 0.3% | 98% | |
| 351 | 0.5% | 98% | |
| 352 | 0.7% | 97% | |
| 353 | 0.8% | 97% | |
| 354 | 0.9% | 96% | |
| 355 | 0.7% | 95% | Majority |
| 356 | 1.0% | 94% | |
| 357 | 1.1% | 93% | |
| 358 | 1.0% | 92% | |
| 359 | 1.4% | 91% | |
| 360 | 1.4% | 90% | |
| 361 | 2% | 88% | |
| 362 | 2% | 86% | |
| 363 | 2% | 85% | |
| 364 | 2% | 82% | |
| 365 | 2% | 81% | |
| 366 | 3% | 78% | |
| 367 | 2% | 76% | |
| 368 | 2% | 73% | |
| 369 | 3% | 71% | |
| 370 | 3% | 68% | |
| 371 | 3% | 65% | |
| 372 | 3% | 63% | |
| 373 | 4% | 60% | |
| 374 | 3% | 56% | Median |
| 375 | 3% | 53% | |
| 376 | 3% | 49% | |
| 377 | 2% | 47% | |
| 378 | 3% | 44% | |
| 379 | 3% | 42% | |
| 380 | 3% | 39% | |
| 381 | 2% | 36% | |
| 382 | 3% | 34% | |
| 383 | 3% | 31% | |
| 384 | 2% | 29% | |
| 385 | 2% | 26% | |
| 386 | 2% | 24% | |
| 387 | 2% | 22% | |
| 388 | 2% | 20% | |
| 389 | 2% | 18% | |
| 390 | 2% | 16% | |
| 391 | 1.1% | 15% | |
| 392 | 2% | 14% | |
| 393 | 1.1% | 12% | Last Result |
| 394 | 0.9% | 11% | |
| 395 | 0.9% | 10% | |
| 396 | 0.9% | 9% | |
| 397 | 0.7% | 8% | |
| 398 | 0.7% | 7% | |
| 399 | 0.6% | 7% | |
| 400 | 0.5% | 6% | |
| 401 | 0.5% | 6% | |
| 402 | 0.4% | 5% | |
| 403 | 0.3% | 5% | |
| 404 | 0.5% | 4% | |
| 405 | 0.4% | 4% | |
| 406 | 0.3% | 3% | |
| 407 | 0.4% | 3% | |
| 408 | 0.3% | 3% | |
| 409 | 0.3% | 2% | |
| 410 | 0.2% | 2% | |
| 411 | 0.2% | 2% | |
| 412 | 0.2% | 2% | |
| 413 | 0.2% | 2% | |
| 414 | 0.1% | 1.4% | |
| 415 | 0.1% | 1.3% | |
| 416 | 0.1% | 1.2% | |
| 417 | 0.1% | 1.1% | |
| 418 | 0.1% | 1.0% | |
| 419 | 0.1% | 0.8% | |
| 420 | 0.1% | 0.7% | |
| 421 | 0.1% | 0.6% | |
| 422 | 0.1% | 0.6% | |
| 423 | 0.1% | 0.5% | |
| 424 | 0.1% | 0.4% | |
| 425 | 0% | 0.4% | |
| 426 | 0% | 0.3% | |
| 427 | 0% | 0.3% | |
| 428 | 0% | 0.3% | |
| 429 | 0% | 0.2% | |
| 430 | 0% | 0.2% | |
| 431 | 0% | 0.2% | |
| 432 | 0% | 0.2% | |
| 433 | 0% | 0.1% | |
| 434 | 0% | 0.1% | |
| 435 | 0% | 0.1% | |
| 436 | 0% | 0.1% | |
| 437 | 0% | 0.1% | |
| 438 | 0% | 0.1% | |
| 439 | 0% | 0% |
Christlich Demokratische Union Deutschlands – Sozialdemokratische Partei Deutschlands – Christlich-Soziale Union in Bayern
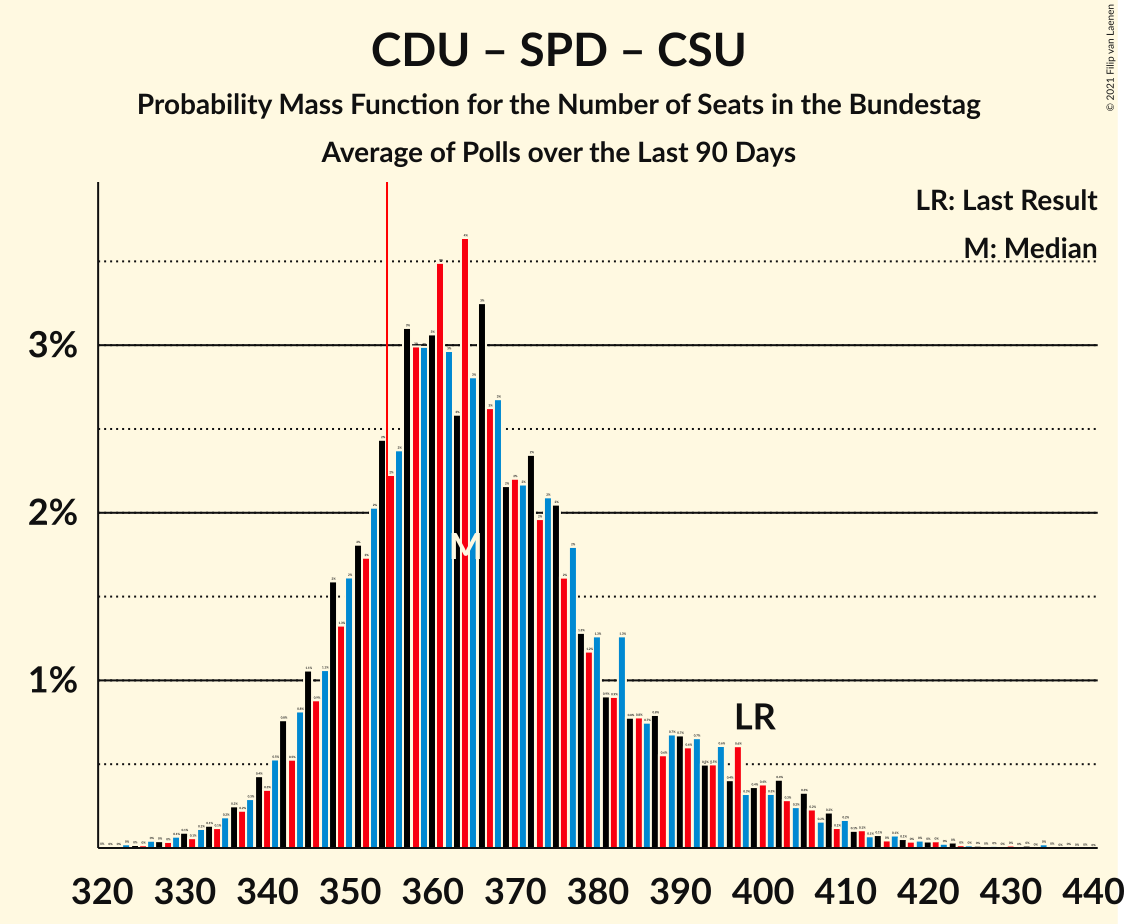
| Number of Seats | Probability | Accumulated | Special Marks |
|---|---|---|---|
| 323 | 0% | 100% | |
| 324 | 0% | 99.9% | |
| 325 | 0% | 99.9% | |
| 326 | 0% | 99.9% | |
| 327 | 0% | 99.9% | |
| 328 | 0% | 99.8% | |
| 329 | 0.1% | 99.8% | |
| 330 | 0.1% | 99.7% | |
| 331 | 0.1% | 99.6% | |
| 332 | 0.1% | 99.6% | |
| 333 | 0.1% | 99.5% | |
| 334 | 0.1% | 99.3% | |
| 335 | 0.2% | 99.2% | |
| 336 | 0.2% | 99.0% | |
| 337 | 0.2% | 98.8% | |
| 338 | 0.3% | 98.5% | |
| 339 | 0.4% | 98% | |
| 340 | 0.3% | 98% | |
| 341 | 0.5% | 97% | |
| 342 | 0.8% | 97% | |
| 343 | 0.5% | 96% | |
| 344 | 0.8% | 96% | |
| 345 | 1.1% | 95% | |
| 346 | 0.9% | 94% | |
| 347 | 1.1% | 93% | |
| 348 | 2% | 92% | |
| 349 | 1.3% | 90% | |
| 350 | 2% | 89% | |
| 351 | 2% | 87% | |
| 352 | 2% | 86% | |
| 353 | 2% | 84% | |
| 354 | 2% | 82% | |
| 355 | 2% | 79% | Majority |
| 356 | 2% | 77% | |
| 357 | 3% | 75% | |
| 358 | 3% | 72% | |
| 359 | 3% | 69% | |
| 360 | 3% | 66% | |
| 361 | 3% | 63% | |
| 362 | 3% | 59% | |
| 363 | 3% | 56% | |
| 364 | 4% | 54% | |
| 365 | 3% | 50% | Median |
| 366 | 3% | 47% | |
| 367 | 3% | 44% | |
| 368 | 3% | 41% | |
| 369 | 2% | 39% | |
| 370 | 2% | 36% | |
| 371 | 2% | 34% | |
| 372 | 2% | 32% | |
| 373 | 2% | 30% | |
| 374 | 2% | 28% | |
| 375 | 2% | 26% | |
| 376 | 2% | 24% | |
| 377 | 2% | 22% | |
| 378 | 1.3% | 20% | |
| 379 | 1.2% | 19% | |
| 380 | 1.3% | 18% | |
| 381 | 0.9% | 16% | |
| 382 | 0.9% | 16% | |
| 383 | 1.3% | 15% | |
| 384 | 0.8% | 13% | |
| 385 | 0.8% | 13% | |
| 386 | 0.7% | 12% | |
| 387 | 0.8% | 11% | |
| 388 | 0.6% | 10% | |
| 389 | 0.7% | 10% | |
| 390 | 0.7% | 9% | |
| 391 | 0.6% | 8% | |
| 392 | 0.7% | 8% | |
| 393 | 0.5% | 7% | |
| 394 | 0.5% | 7% | |
| 395 | 0.6% | 6% | |
| 396 | 0.4% | 5% | |
| 397 | 0.6% | 5% | |
| 398 | 0.3% | 4% | |
| 399 | 0.4% | 4% | Last Result |
| 400 | 0.4% | 4% | |
| 401 | 0.3% | 3% | |
| 402 | 0.4% | 3% | |
| 403 | 0.3% | 3% | |
| 404 | 0.2% | 2% | |
| 405 | 0.3% | 2% | |
| 406 | 0.2% | 2% | |
| 407 | 0.2% | 2% | |
| 408 | 0.2% | 1.4% | |
| 409 | 0.1% | 1.2% | |
| 410 | 0.2% | 1.1% | |
| 411 | 0.1% | 0.9% | |
| 412 | 0.1% | 0.8% | |
| 413 | 0.1% | 0.7% | |
| 414 | 0.1% | 0.7% | |
| 415 | 0% | 0.6% | |
| 416 | 0.1% | 0.5% | |
| 417 | 0.1% | 0.5% | |
| 418 | 0% | 0.4% | |
| 419 | 0% | 0.4% | |
| 420 | 0% | 0.3% | |
| 421 | 0% | 0.3% | |
| 422 | 0% | 0.2% | |
| 423 | 0% | 0.2% | |
| 424 | 0% | 0.2% | |
| 425 | 0% | 0.2% | |
| 426 | 0% | 0.2% | |
| 427 | 0% | 0.1% | |
| 428 | 0% | 0.1% | |
| 429 | 0% | 0.1% | |
| 430 | 0% | 0.1% | |
| 431 | 0% | 0.1% | |
| 432 | 0% | 0.1% | |
| 433 | 0% | 0.1% | |
| 434 | 0% | 0.1% | |
| 435 | 0% | 0% |
Sozialdemokratische Partei Deutschlands – Die Linke – Bündnis 90/Die Grünen
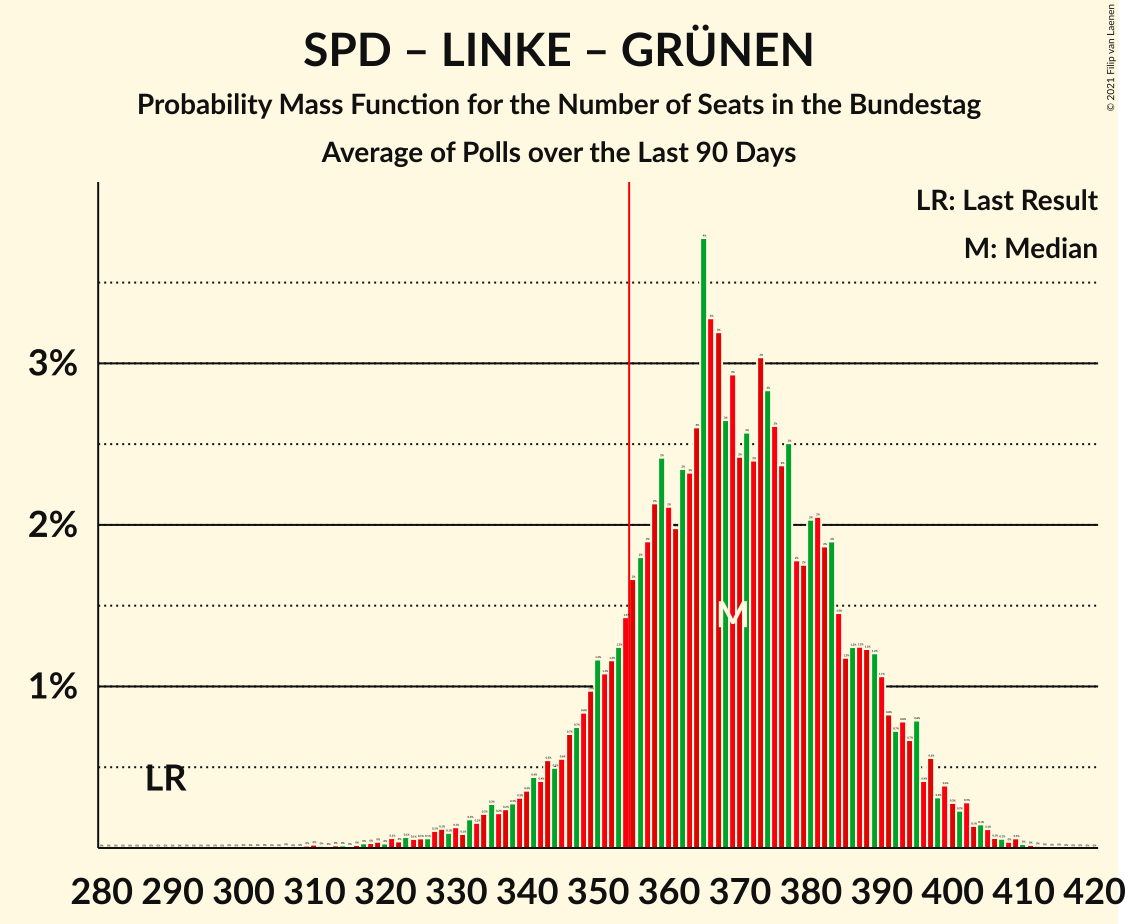
| Number of Seats | Probability | Accumulated | Special Marks |
|---|---|---|---|
| 289 | 0% | 100% | Last Result |
| 290 | 0% | 100% | |
| 291 | 0% | 100% | |
| 292 | 0% | 100% | |
| 293 | 0% | 100% | |
| 294 | 0% | 100% | |
| 295 | 0% | 100% | |
| 296 | 0% | 100% | |
| 297 | 0% | 100% | |
| 298 | 0% | 100% | |
| 299 | 0% | 100% | |
| 300 | 0% | 100% | |
| 301 | 0% | 100% | |
| 302 | 0% | 100% | |
| 303 | 0% | 100% | |
| 304 | 0% | 100% | |
| 305 | 0% | 100% | |
| 306 | 0% | 100% | |
| 307 | 0% | 100% | |
| 308 | 0% | 100% | |
| 309 | 0% | 100% | |
| 310 | 0% | 99.9% | |
| 311 | 0% | 99.9% | |
| 312 | 0% | 99.9% | |
| 313 | 0% | 99.9% | |
| 314 | 0% | 99.9% | |
| 315 | 0% | 99.9% | |
| 316 | 0% | 99.9% | |
| 317 | 0% | 99.8% | |
| 318 | 0% | 99.8% | |
| 319 | 0% | 99.8% | |
| 320 | 0% | 99.7% | |
| 321 | 0.1% | 99.7% | |
| 322 | 0% | 99.7% | |
| 323 | 0.1% | 99.6% | |
| 324 | 0.1% | 99.5% | |
| 325 | 0.1% | 99.5% | |
| 326 | 0.1% | 99.4% | |
| 327 | 0.1% | 99.4% | |
| 328 | 0.1% | 99.3% | |
| 329 | 0.1% | 99.1% | |
| 330 | 0.1% | 99.1% | |
| 331 | 0.1% | 98.9% | |
| 332 | 0.2% | 98.8% | |
| 333 | 0.2% | 98.7% | |
| 334 | 0.2% | 98.5% | |
| 335 | 0.3% | 98% | |
| 336 | 0.2% | 98% | |
| 337 | 0.2% | 98% | |
| 338 | 0.3% | 98% | |
| 339 | 0.3% | 97% | |
| 340 | 0.4% | 97% | |
| 341 | 0.4% | 97% | |
| 342 | 0.4% | 96% | |
| 343 | 0.5% | 96% | |
| 344 | 0.5% | 95% | |
| 345 | 0.6% | 95% | |
| 346 | 0.7% | 94% | |
| 347 | 0.7% | 93% | |
| 348 | 0.8% | 93% | |
| 349 | 1.0% | 92% | |
| 350 | 1.2% | 91% | |
| 351 | 1.1% | 90% | |
| 352 | 1.2% | 89% | |
| 353 | 1.2% | 87% | |
| 354 | 1.4% | 86% | |
| 355 | 2% | 85% | Majority |
| 356 | 2% | 83% | |
| 357 | 2% | 81% | |
| 358 | 2% | 79% | |
| 359 | 2% | 77% | |
| 360 | 2% | 75% | |
| 361 | 2% | 73% | |
| 362 | 2% | 71% | |
| 363 | 2% | 68% | |
| 364 | 3% | 66% | |
| 365 | 4% | 64% | |
| 366 | 3% | 60% | |
| 367 | 3% | 56% | |
| 368 | 3% | 53% | Median |
| 369 | 3% | 51% | |
| 370 | 2% | 48% | |
| 371 | 3% | 45% | |
| 372 | 2% | 43% | |
| 373 | 3% | 40% | |
| 374 | 3% | 37% | |
| 375 | 3% | 34% | |
| 376 | 2% | 32% | |
| 377 | 3% | 29% | |
| 378 | 2% | 27% | |
| 379 | 2% | 25% | |
| 380 | 2% | 23% | |
| 381 | 2% | 21% | |
| 382 | 2% | 19% | |
| 383 | 2% | 17% | |
| 384 | 1.5% | 16% | |
| 385 | 1.2% | 14% | |
| 386 | 1.2% | 13% | |
| 387 | 1.2% | 12% | |
| 388 | 1.2% | 10% | |
| 389 | 1.2% | 9% | |
| 390 | 1.1% | 8% | |
| 391 | 0.8% | 7% | |
| 392 | 0.7% | 6% | |
| 393 | 0.8% | 5% | |
| 394 | 0.7% | 5% | |
| 395 | 0.8% | 4% | |
| 396 | 0.4% | 3% | |
| 397 | 0.6% | 3% | |
| 398 | 0.3% | 2% | |
| 399 | 0.4% | 2% | |
| 400 | 0.3% | 1.5% | |
| 401 | 0.2% | 1.2% | |
| 402 | 0.3% | 1.0% | |
| 403 | 0.1% | 0.7% | |
| 404 | 0.1% | 0.6% | |
| 405 | 0.1% | 0.4% | |
| 406 | 0.1% | 0.3% | |
| 407 | 0.1% | 0.2% | |
| 408 | 0% | 0.2% | |
| 409 | 0.1% | 0.1% | |
| 410 | 0% | 0.1% | |
| 411 | 0% | 0.1% | |
| 412 | 0% | 0% |
Christlich Demokratische Union Deutschlands – Alternative für Deutschland – Freie Demokratische Partei – Christlich-Soziale Union in Bayern
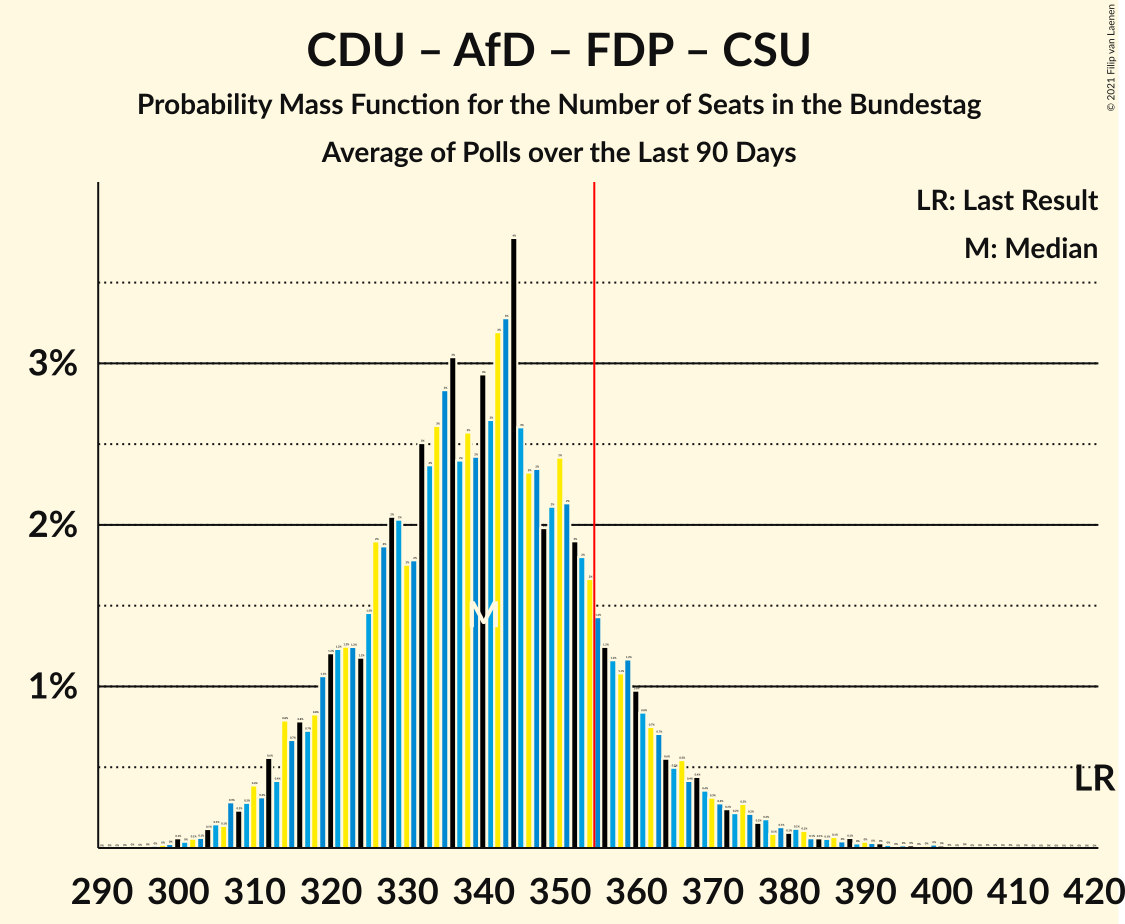
| Number of Seats | Probability | Accumulated | Special Marks |
|---|---|---|---|
| 298 | 0% | 100% | |
| 299 | 0% | 99.9% | |
| 300 | 0.1% | 99.9% | |
| 301 | 0% | 99.9% | |
| 302 | 0.1% | 99.8% | |
| 303 | 0.1% | 99.8% | |
| 304 | 0.1% | 99.7% | |
| 305 | 0.1% | 99.6% | |
| 306 | 0.1% | 99.4% | |
| 307 | 0.3% | 99.3% | |
| 308 | 0.2% | 99.0% | |
| 309 | 0.3% | 98.8% | |
| 310 | 0.4% | 98.5% | |
| 311 | 0.3% | 98% | |
| 312 | 0.6% | 98% | |
| 313 | 0.4% | 97% | |
| 314 | 0.8% | 97% | |
| 315 | 0.7% | 96% | |
| 316 | 0.8% | 95% | |
| 317 | 0.7% | 95% | |
| 318 | 0.8% | 94% | |
| 319 | 1.1% | 93% | |
| 320 | 1.2% | 92% | |
| 321 | 1.2% | 91% | |
| 322 | 1.2% | 90% | |
| 323 | 1.2% | 88% | |
| 324 | 1.2% | 87% | |
| 325 | 1.5% | 86% | |
| 326 | 2% | 84% | |
| 327 | 2% | 83% | |
| 328 | 2% | 81% | |
| 329 | 2% | 79% | |
| 330 | 2% | 77% | |
| 331 | 2% | 75% | |
| 332 | 3% | 73% | |
| 333 | 2% | 71% | |
| 334 | 3% | 68% | |
| 335 | 3% | 66% | |
| 336 | 3% | 63% | |
| 337 | 2% | 60% | |
| 338 | 3% | 57% | Median |
| 339 | 2% | 55% | |
| 340 | 3% | 52% | |
| 341 | 3% | 49% | |
| 342 | 3% | 47% | |
| 343 | 3% | 44% | |
| 344 | 4% | 40% | |
| 345 | 3% | 36% | |
| 346 | 2% | 34% | |
| 347 | 2% | 32% | |
| 348 | 2% | 29% | |
| 349 | 2% | 27% | |
| 350 | 2% | 25% | |
| 351 | 2% | 23% | |
| 352 | 2% | 21% | |
| 353 | 2% | 19% | |
| 354 | 2% | 17% | |
| 355 | 1.4% | 15% | Majority |
| 356 | 1.2% | 14% | |
| 357 | 1.2% | 13% | |
| 358 | 1.1% | 11% | |
| 359 | 1.2% | 10% | |
| 360 | 1.0% | 9% | |
| 361 | 0.8% | 8% | |
| 362 | 0.7% | 7% | |
| 363 | 0.7% | 7% | |
| 364 | 0.6% | 6% | |
| 365 | 0.5% | 5% | |
| 366 | 0.5% | 5% | |
| 367 | 0.4% | 4% | |
| 368 | 0.4% | 4% | |
| 369 | 0.4% | 3% | |
| 370 | 0.3% | 3% | |
| 371 | 0.3% | 3% | |
| 372 | 0.2% | 2% | |
| 373 | 0.2% | 2% | |
| 374 | 0.3% | 2% | |
| 375 | 0.2% | 2% | |
| 376 | 0.2% | 1.5% | |
| 377 | 0.2% | 1.3% | |
| 378 | 0.1% | 1.2% | |
| 379 | 0.1% | 1.1% | |
| 380 | 0.1% | 0.9% | |
| 381 | 0.1% | 0.9% | |
| 382 | 0.1% | 0.7% | |
| 383 | 0.1% | 0.6% | |
| 384 | 0.1% | 0.6% | |
| 385 | 0.1% | 0.5% | |
| 386 | 0.1% | 0.5% | |
| 387 | 0% | 0.4% | |
| 388 | 0.1% | 0.3% | |
| 389 | 0% | 0.3% | |
| 390 | 0% | 0.3% | |
| 391 | 0% | 0.2% | |
| 392 | 0% | 0.2% | |
| 393 | 0% | 0.2% | |
| 394 | 0% | 0.1% | |
| 395 | 0% | 0.1% | |
| 396 | 0% | 0.1% | |
| 397 | 0% | 0.1% | |
| 398 | 0% | 0.1% | |
| 399 | 0% | 0.1% | |
| 400 | 0% | 0.1% | |
| 401 | 0% | 0% | |
| 402 | 0% | 0% | |
| 403 | 0% | 0% | |
| 404 | 0% | 0% | |
| 405 | 0% | 0% | |
| 406 | 0% | 0% | |
| 407 | 0% | 0% | |
| 408 | 0% | 0% | |
| 409 | 0% | 0% | |
| 410 | 0% | 0% | |
| 411 | 0% | 0% | |
| 412 | 0% | 0% | |
| 413 | 0% | 0% | |
| 414 | 0% | 0% | |
| 415 | 0% | 0% | |
| 416 | 0% | 0% | |
| 417 | 0% | 0% | |
| 418 | 0% | 0% | |
| 419 | 0% | 0% | |
| 420 | 0% | 0% | Last Result |
Sozialdemokratische Partei Deutschlands – Bündnis 90/Die Grünen
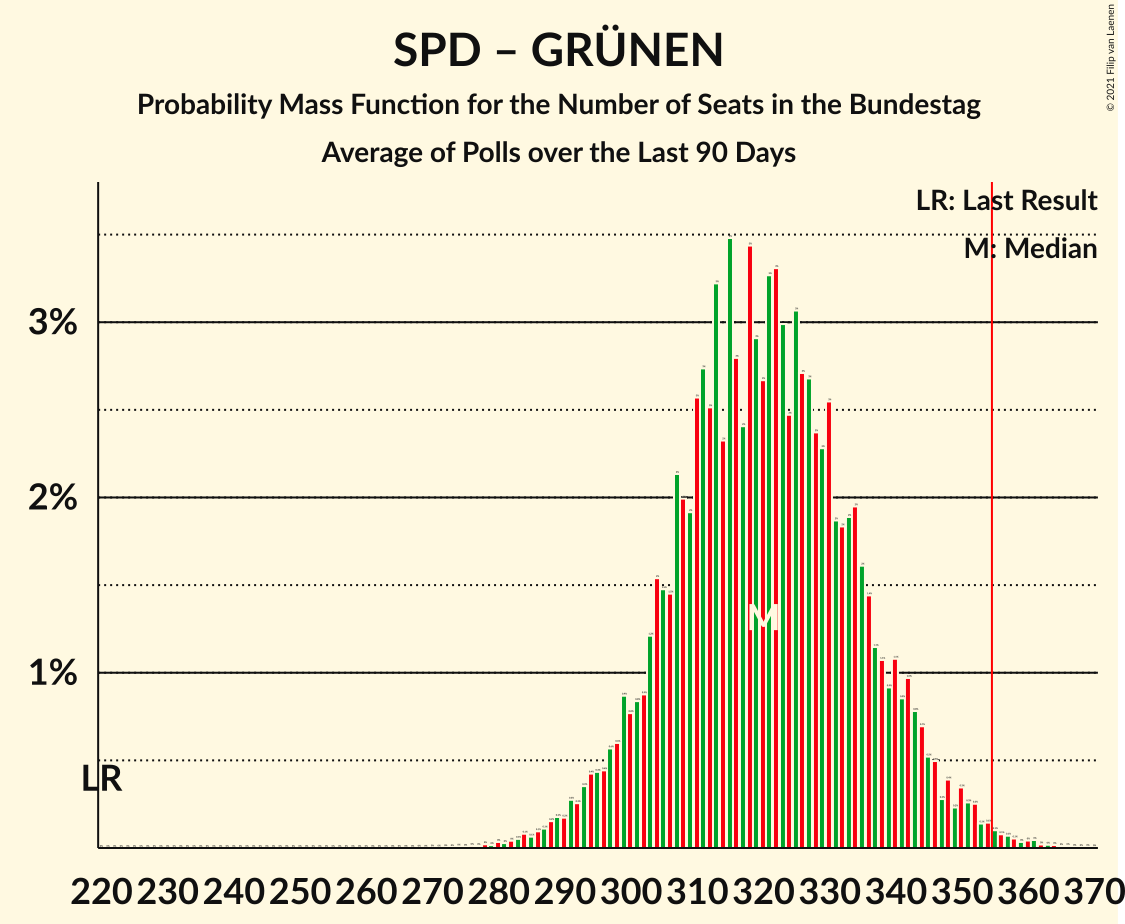
| Number of Seats | Probability | Accumulated | Special Marks |
|---|---|---|---|
| 220 | 0% | 100% | Last Result |
| 221 | 0% | 100% | |
| 222 | 0% | 100% | |
| 223 | 0% | 100% | |
| 224 | 0% | 100% | |
| 225 | 0% | 100% | |
| 226 | 0% | 100% | |
| 227 | 0% | 100% | |
| 228 | 0% | 100% | |
| 229 | 0% | 100% | |
| 230 | 0% | 100% | |
| 231 | 0% | 100% | |
| 232 | 0% | 100% | |
| 233 | 0% | 100% | |
| 234 | 0% | 100% | |
| 235 | 0% | 100% | |
| 236 | 0% | 100% | |
| 237 | 0% | 100% | |
| 238 | 0% | 100% | |
| 239 | 0% | 100% | |
| 240 | 0% | 100% | |
| 241 | 0% | 100% | |
| 242 | 0% | 100% | |
| 243 | 0% | 100% | |
| 244 | 0% | 100% | |
| 245 | 0% | 100% | |
| 246 | 0% | 100% | |
| 247 | 0% | 100% | |
| 248 | 0% | 100% | |
| 249 | 0% | 100% | |
| 250 | 0% | 100% | |
| 251 | 0% | 100% | |
| 252 | 0% | 100% | |
| 253 | 0% | 100% | |
| 254 | 0% | 100% | |
| 255 | 0% | 100% | |
| 256 | 0% | 100% | |
| 257 | 0% | 100% | |
| 258 | 0% | 100% | |
| 259 | 0% | 100% | |
| 260 | 0% | 100% | |
| 261 | 0% | 100% | |
| 262 | 0% | 100% | |
| 263 | 0% | 100% | |
| 264 | 0% | 100% | |
| 265 | 0% | 100% | |
| 266 | 0% | 100% | |
| 267 | 0% | 100% | |
| 268 | 0% | 100% | |
| 269 | 0% | 100% | |
| 270 | 0% | 100% | |
| 271 | 0% | 100% | |
| 272 | 0% | 100% | |
| 273 | 0% | 100% | |
| 274 | 0% | 100% | |
| 275 | 0% | 100% | |
| 276 | 0% | 100% | |
| 277 | 0% | 100% | |
| 278 | 0% | 99.9% | |
| 279 | 0% | 99.9% | |
| 280 | 0% | 99.9% | |
| 281 | 0% | 99.9% | |
| 282 | 0% | 99.8% | |
| 283 | 0.1% | 99.8% | |
| 284 | 0.1% | 99.8% | |
| 285 | 0.1% | 99.7% | |
| 286 | 0.1% | 99.6% | |
| 287 | 0.1% | 99.5% | |
| 288 | 0.2% | 99.4% | |
| 289 | 0.2% | 99.2% | |
| 290 | 0.2% | 99.1% | |
| 291 | 0.3% | 98.9% | |
| 292 | 0.3% | 98.6% | |
| 293 | 0.4% | 98% | |
| 294 | 0.4% | 98% | |
| 295 | 0.4% | 98% | |
| 296 | 0.4% | 97% | |
| 297 | 0.6% | 97% | |
| 298 | 0.6% | 96% | |
| 299 | 0.9% | 96% | |
| 300 | 0.8% | 95% | |
| 301 | 0.8% | 94% | |
| 302 | 0.9% | 93% | |
| 303 | 1.2% | 92% | |
| 304 | 2% | 91% | |
| 305 | 1.5% | 89% | |
| 306 | 1.5% | 88% | |
| 307 | 2% | 87% | |
| 308 | 2% | 84% | |
| 309 | 2% | 82% | |
| 310 | 3% | 80% | |
| 311 | 3% | 78% | |
| 312 | 3% | 75% | |
| 313 | 3% | 73% | |
| 314 | 2% | 69% | |
| 315 | 3% | 67% | |
| 316 | 3% | 64% | |
| 317 | 2% | 61% | |
| 318 | 3% | 58% | |
| 319 | 3% | 55% | |
| 320 | 3% | 52% | Median |
| 321 | 3% | 49% | |
| 322 | 3% | 46% | |
| 323 | 3% | 43% | |
| 324 | 2% | 40% | |
| 325 | 3% | 37% | |
| 326 | 3% | 34% | |
| 327 | 3% | 32% | |
| 328 | 2% | 29% | |
| 329 | 2% | 27% | |
| 330 | 3% | 24% | |
| 331 | 2% | 22% | |
| 332 | 2% | 20% | |
| 333 | 2% | 18% | |
| 334 | 2% | 16% | |
| 335 | 2% | 14% | |
| 336 | 1.4% | 13% | |
| 337 | 1.1% | 11% | |
| 338 | 1.1% | 10% | |
| 339 | 0.9% | 9% | |
| 340 | 1.1% | 8% | |
| 341 | 0.9% | 7% | |
| 342 | 1.0% | 6% | |
| 343 | 0.8% | 5% | |
| 344 | 0.7% | 4% | |
| 345 | 0.5% | 4% | |
| 346 | 0.5% | 3% | |
| 347 | 0.3% | 3% | |
| 348 | 0.4% | 2% | |
| 349 | 0.2% | 2% | |
| 350 | 0.3% | 2% | |
| 351 | 0.3% | 1.3% | |
| 352 | 0.3% | 1.1% | |
| 353 | 0.1% | 0.8% | |
| 354 | 0.1% | 0.7% | |
| 355 | 0.1% | 0.5% | Majority |
| 356 | 0.1% | 0.4% | |
| 357 | 0.1% | 0.4% | |
| 358 | 0.1% | 0.3% | |
| 359 | 0% | 0.2% | |
| 360 | 0% | 0.2% | |
| 361 | 0% | 0.2% | |
| 362 | 0% | 0.1% | |
| 363 | 0% | 0.1% | |
| 364 | 0% | 0.1% | |
| 365 | 0% | 0.1% | |
| 366 | 0% | 0% |
Christlich Demokratische Union Deutschlands – Bündnis 90/Die Grünen – Christlich-Soziale Union in Bayern
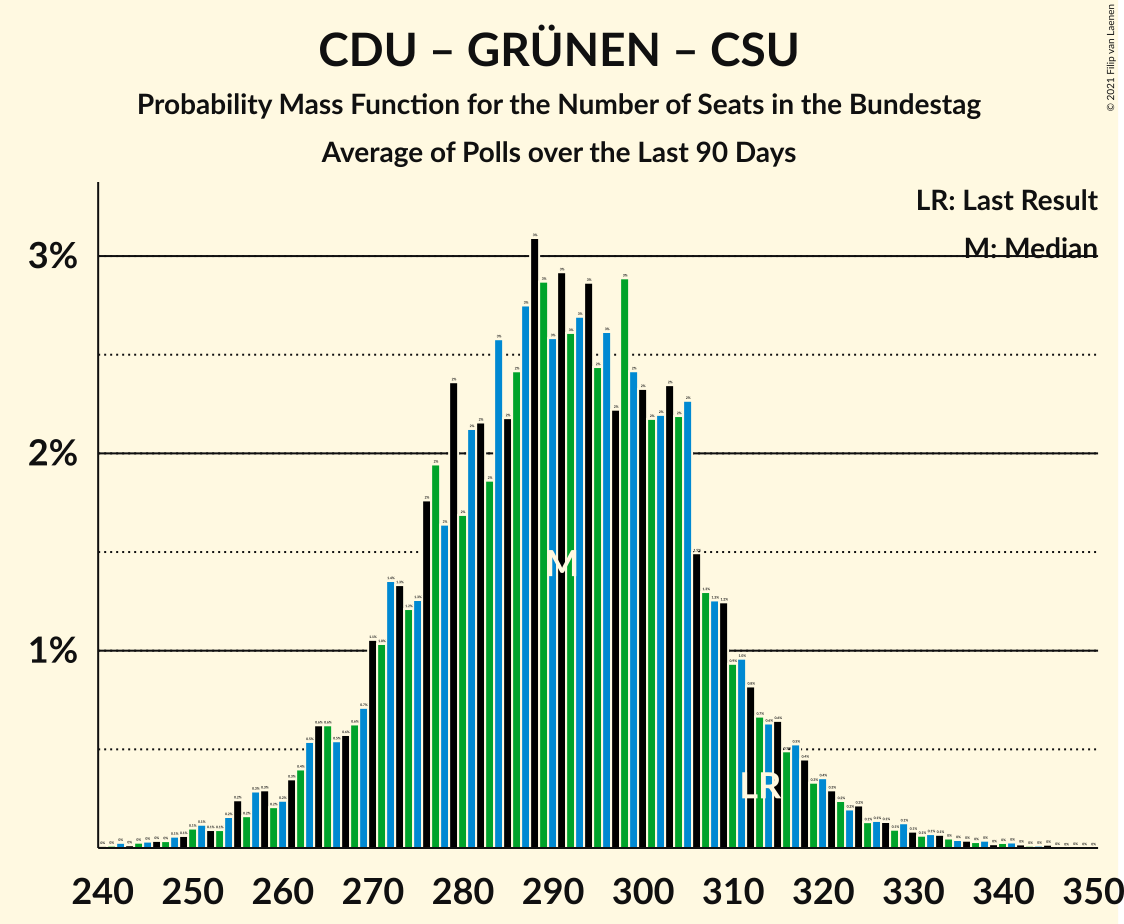
| Number of Seats | Probability | Accumulated | Special Marks |
|---|---|---|---|
| 242 | 0% | 100% | |
| 243 | 0% | 99.9% | |
| 244 | 0% | 99.9% | |
| 245 | 0% | 99.9% | |
| 246 | 0% | 99.9% | |
| 247 | 0% | 99.8% | |
| 248 | 0.1% | 99.8% | |
| 249 | 0.1% | 99.7% | |
| 250 | 0.1% | 99.7% | |
| 251 | 0.1% | 99.6% | |
| 252 | 0.1% | 99.4% | |
| 253 | 0.1% | 99.4% | |
| 254 | 0.2% | 99.3% | |
| 255 | 0.2% | 99.1% | |
| 256 | 0.2% | 98.9% | |
| 257 | 0.3% | 98.7% | |
| 258 | 0.3% | 98% | |
| 259 | 0.2% | 98% | |
| 260 | 0.2% | 98% | |
| 261 | 0.3% | 98% | |
| 262 | 0.4% | 97% | |
| 263 | 0.5% | 97% | |
| 264 | 0.6% | 96% | |
| 265 | 0.6% | 96% | |
| 266 | 0.5% | 95% | |
| 267 | 0.6% | 95% | |
| 268 | 0.6% | 94% | |
| 269 | 0.7% | 93% | |
| 270 | 1.1% | 93% | |
| 271 | 1.0% | 92% | |
| 272 | 1.4% | 91% | |
| 273 | 1.3% | 89% | |
| 274 | 1.2% | 88% | |
| 275 | 1.3% | 87% | |
| 276 | 2% | 85% | |
| 277 | 2% | 84% | |
| 278 | 2% | 82% | |
| 279 | 2% | 80% | |
| 280 | 2% | 78% | |
| 281 | 2% | 76% | |
| 282 | 2% | 74% | |
| 283 | 2% | 72% | |
| 284 | 3% | 70% | |
| 285 | 2% | 67% | |
| 286 | 2% | 65% | |
| 287 | 3% | 63% | |
| 288 | 3% | 60% | |
| 289 | 3% | 57% | Median |
| 290 | 3% | 54% | |
| 291 | 3% | 51% | |
| 292 | 3% | 49% | |
| 293 | 3% | 46% | |
| 294 | 3% | 43% | |
| 295 | 2% | 40% | |
| 296 | 3% | 38% | |
| 297 | 2% | 35% | |
| 298 | 3% | 33% | |
| 299 | 2% | 30% | |
| 300 | 2% | 28% | |
| 301 | 2% | 25% | |
| 302 | 2% | 23% | |
| 303 | 2% | 21% | |
| 304 | 2% | 19% | |
| 305 | 2% | 17% | |
| 306 | 1.5% | 14% | |
| 307 | 1.3% | 13% | |
| 308 | 1.3% | 12% | |
| 309 | 1.2% | 10% | |
| 310 | 0.9% | 9% | |
| 311 | 1.0% | 8% | |
| 312 | 0.8% | 7% | |
| 313 | 0.7% | 6% | Last Result |
| 314 | 0.6% | 6% | |
| 315 | 0.6% | 5% | |
| 316 | 0.5% | 4% | |
| 317 | 0.5% | 4% | |
| 318 | 0.4% | 3% | |
| 319 | 0.3% | 3% | |
| 320 | 0.4% | 3% | |
| 321 | 0.3% | 2% | |
| 322 | 0.2% | 2% | |
| 323 | 0.2% | 2% | |
| 324 | 0.2% | 1.5% | |
| 325 | 0.1% | 1.3% | |
| 326 | 0.1% | 1.1% | |
| 327 | 0.1% | 1.0% | |
| 328 | 0.1% | 0.9% | |
| 329 | 0.1% | 0.8% | |
| 330 | 0.1% | 0.6% | |
| 331 | 0.1% | 0.6% | |
| 332 | 0.1% | 0.5% | |
| 333 | 0.1% | 0.4% | |
| 334 | 0% | 0.4% | |
| 335 | 0% | 0.3% | |
| 336 | 0% | 0.3% | |
| 337 | 0% | 0.2% | |
| 338 | 0% | 0.2% | |
| 339 | 0% | 0.2% | |
| 340 | 0% | 0.1% | |
| 341 | 0% | 0.1% | |
| 342 | 0% | 0.1% | |
| 343 | 0% | 0.1% | |
| 344 | 0% | 0.1% | |
| 345 | 0% | 0.1% | |
| 346 | 0% | 0% |
Sozialdemokratische Partei Deutschlands – Freie Demokratische Partei
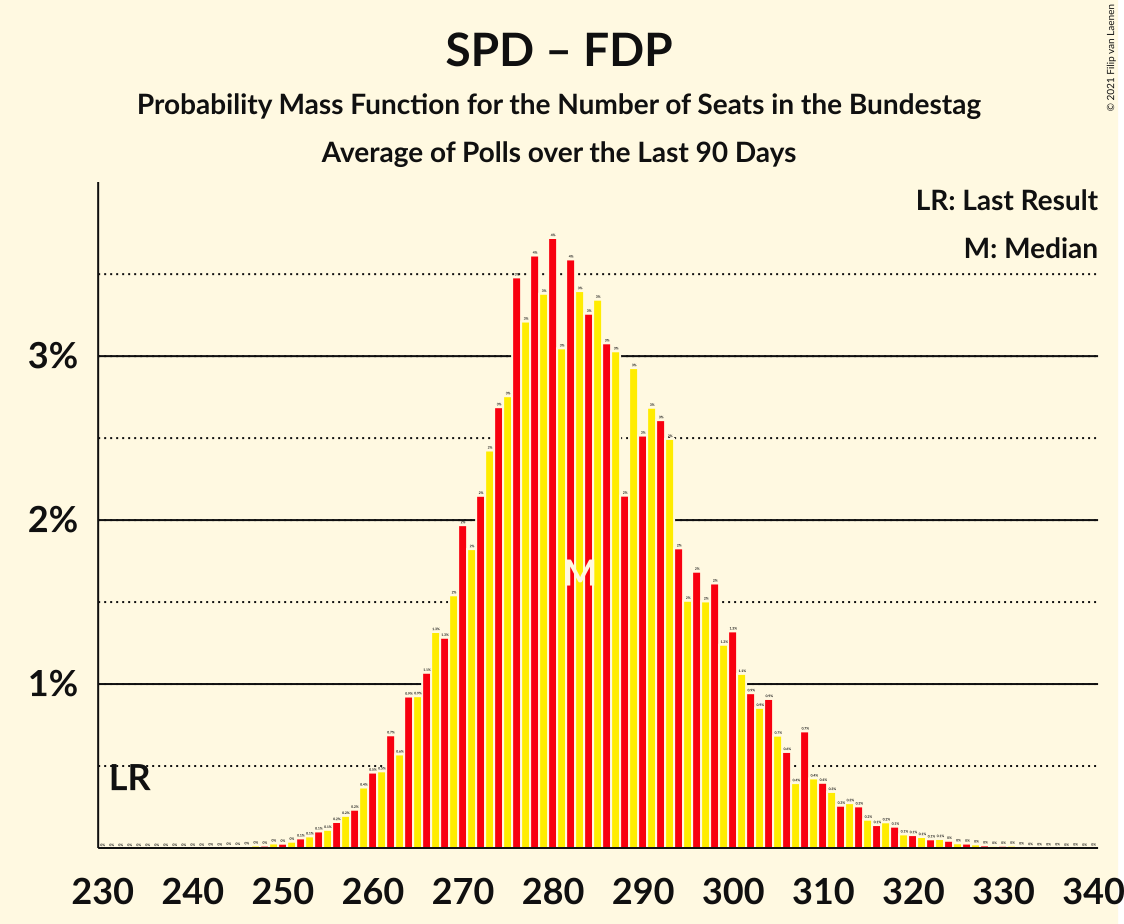
| Number of Seats | Probability | Accumulated | Special Marks |
|---|---|---|---|
| 233 | 0% | 100% | Last Result |
| 234 | 0% | 100% | |
| 235 | 0% | 100% | |
| 236 | 0% | 100% | |
| 237 | 0% | 100% | |
| 238 | 0% | 100% | |
| 239 | 0% | 100% | |
| 240 | 0% | 100% | |
| 241 | 0% | 100% | |
| 242 | 0% | 100% | |
| 243 | 0% | 100% | |
| 244 | 0% | 100% | |
| 245 | 0% | 100% | |
| 246 | 0% | 100% | |
| 247 | 0% | 100% | |
| 248 | 0% | 99.9% | |
| 249 | 0% | 99.9% | |
| 250 | 0% | 99.9% | |
| 251 | 0% | 99.9% | |
| 252 | 0.1% | 99.8% | |
| 253 | 0.1% | 99.8% | |
| 254 | 0.1% | 99.7% | |
| 255 | 0.1% | 99.6% | |
| 256 | 0.2% | 99.5% | |
| 257 | 0.2% | 99.3% | |
| 258 | 0.2% | 99.1% | |
| 259 | 0.4% | 98.9% | |
| 260 | 0.5% | 98.5% | |
| 261 | 0.5% | 98% | |
| 262 | 0.7% | 98% | |
| 263 | 0.6% | 97% | |
| 264 | 0.9% | 96% | |
| 265 | 0.9% | 95% | |
| 266 | 1.1% | 95% | |
| 267 | 1.3% | 93% | |
| 268 | 1.3% | 92% | |
| 269 | 2% | 91% | |
| 270 | 2% | 89% | |
| 271 | 2% | 87% | |
| 272 | 2% | 86% | |
| 273 | 2% | 83% | |
| 274 | 3% | 81% | |
| 275 | 3% | 78% | |
| 276 | 3% | 75% | |
| 277 | 3% | 72% | |
| 278 | 4% | 69% | |
| 279 | 3% | 65% | |
| 280 | 4% | 62% | |
| 281 | 3% | 58% | |
| 282 | 4% | 55% | |
| 283 | 3% | 51% | Median |
| 284 | 3% | 48% | |
| 285 | 3% | 45% | |
| 286 | 3% | 41% | |
| 287 | 3% | 38% | |
| 288 | 2% | 35% | |
| 289 | 3% | 33% | |
| 290 | 3% | 30% | |
| 291 | 3% | 28% | |
| 292 | 3% | 25% | |
| 293 | 2% | 22% | |
| 294 | 2% | 20% | |
| 295 | 2% | 18% | |
| 296 | 2% | 17% | |
| 297 | 2% | 15% | |
| 298 | 2% | 13% | |
| 299 | 1.2% | 12% | |
| 300 | 1.3% | 11% | |
| 301 | 1.1% | 9% | |
| 302 | 0.9% | 8% | |
| 303 | 0.9% | 7% | |
| 304 | 0.9% | 6% | |
| 305 | 0.7% | 5% | |
| 306 | 0.6% | 5% | |
| 307 | 0.4% | 4% | |
| 308 | 0.7% | 4% | |
| 309 | 0.4% | 3% | |
| 310 | 0.4% | 3% | |
| 311 | 0.3% | 2% | |
| 312 | 0.3% | 2% | |
| 313 | 0.3% | 2% | |
| 314 | 0.3% | 1.4% | |
| 315 | 0.2% | 1.2% | |
| 316 | 0.1% | 1.0% | |
| 317 | 0.2% | 0.8% | |
| 318 | 0.1% | 0.7% | |
| 319 | 0.1% | 0.6% | |
| 320 | 0.1% | 0.5% | |
| 321 | 0.1% | 0.4% | |
| 322 | 0.1% | 0.3% | |
| 323 | 0.1% | 0.3% | |
| 324 | 0% | 0.2% | |
| 325 | 0% | 0.2% | |
| 326 | 0% | 0.1% | |
| 327 | 0% | 0.1% | |
| 328 | 0% | 0.1% | |
| 329 | 0% | 0.1% | |
| 330 | 0% | 0.1% | |
| 331 | 0% | 0.1% | |
| 332 | 0% | 0% |
Christlich Demokratische Union Deutschlands – Freie Demokratische Partei – Christlich-Soziale Union in Bayern
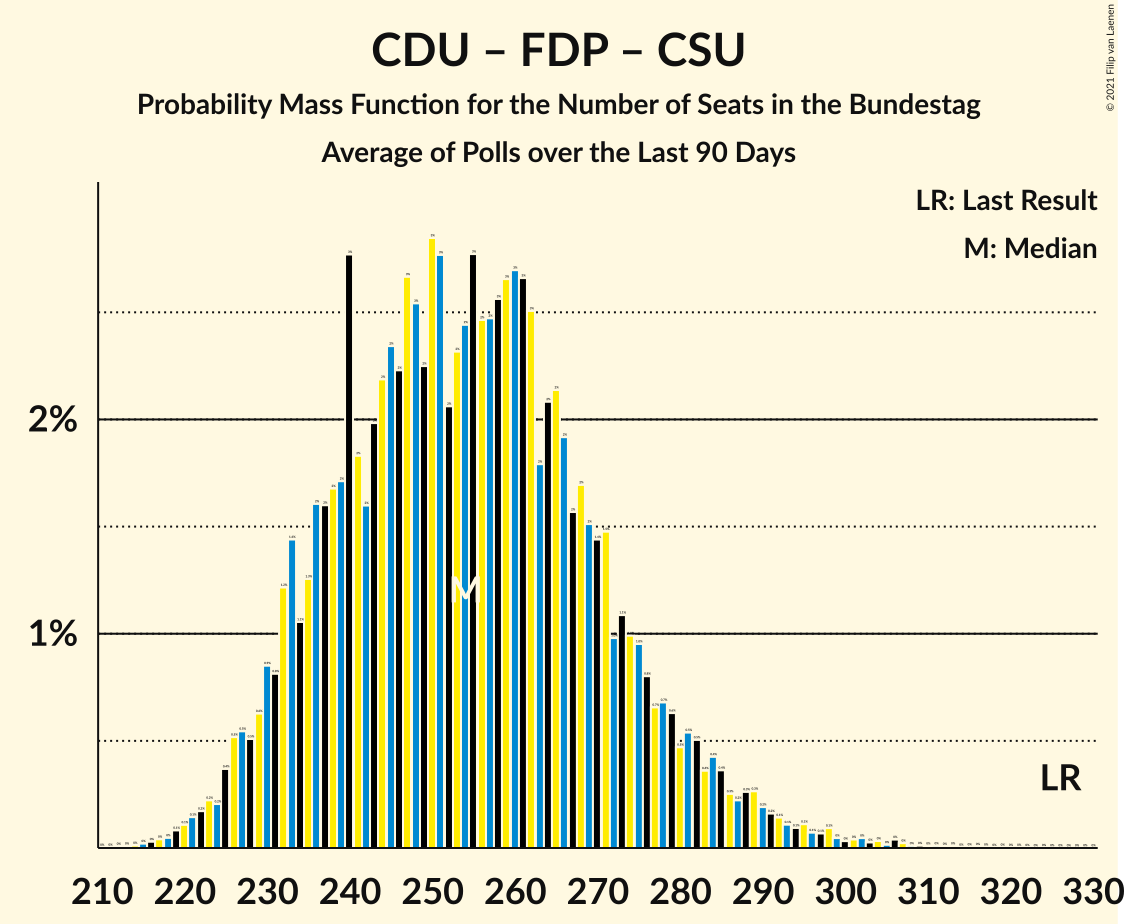
| Number of Seats | Probability | Accumulated | Special Marks |
|---|---|---|---|
| 215 | 0% | 100% | |
| 216 | 0% | 99.9% | |
| 217 | 0% | 99.9% | |
| 218 | 0% | 99.9% | |
| 219 | 0.1% | 99.8% | |
| 220 | 0.1% | 99.7% | |
| 221 | 0.1% | 99.6% | |
| 222 | 0.2% | 99.5% | |
| 223 | 0.2% | 99.3% | |
| 224 | 0.2% | 99.1% | |
| 225 | 0.4% | 98.9% | |
| 226 | 0.5% | 98.5% | |
| 227 | 0.5% | 98% | |
| 228 | 0.5% | 97% | |
| 229 | 0.6% | 97% | |
| 230 | 0.9% | 96% | |
| 231 | 0.8% | 95% | |
| 232 | 1.2% | 95% | |
| 233 | 1.4% | 93% | |
| 234 | 1.1% | 92% | |
| 235 | 1.3% | 91% | |
| 236 | 2% | 90% | |
| 237 | 2% | 88% | |
| 238 | 2% | 86% | |
| 239 | 2% | 85% | |
| 240 | 3% | 83% | |
| 241 | 2% | 80% | |
| 242 | 2% | 79% | |
| 243 | 2% | 77% | |
| 244 | 2% | 75% | |
| 245 | 2% | 73% | |
| 246 | 2% | 70% | |
| 247 | 3% | 68% | |
| 248 | 3% | 65% | |
| 249 | 2% | 63% | |
| 250 | 3% | 61% | |
| 251 | 3% | 58% | |
| 252 | 2% | 55% | Median |
| 253 | 2% | 53% | |
| 254 | 2% | 51% | |
| 255 | 3% | 48% | |
| 256 | 2% | 45% | |
| 257 | 2% | 43% | |
| 258 | 3% | 41% | |
| 259 | 3% | 38% | |
| 260 | 3% | 35% | |
| 261 | 3% | 33% | |
| 262 | 3% | 30% | |
| 263 | 2% | 27% | |
| 264 | 2% | 26% | |
| 265 | 2% | 24% | |
| 266 | 2% | 21% | |
| 267 | 2% | 20% | |
| 268 | 2% | 18% | |
| 269 | 2% | 16% | |
| 270 | 1.4% | 15% | |
| 271 | 1.5% | 13% | |
| 272 | 1.0% | 12% | |
| 273 | 1.1% | 11% | |
| 274 | 1.0% | 10% | |
| 275 | 1.0% | 9% | |
| 276 | 0.8% | 8% | |
| 277 | 0.7% | 7% | |
| 278 | 0.7% | 6% | |
| 279 | 0.6% | 6% | |
| 280 | 0.5% | 5% | |
| 281 | 0.5% | 5% | |
| 282 | 0.5% | 4% | |
| 283 | 0.4% | 4% | |
| 284 | 0.4% | 3% | |
| 285 | 0.4% | 3% | |
| 286 | 0.3% | 2% | |
| 287 | 0.2% | 2% | |
| 288 | 0.3% | 2% | |
| 289 | 0.3% | 2% | |
| 290 | 0.2% | 1.4% | |
| 291 | 0.2% | 1.2% | |
| 292 | 0.1% | 1.1% | |
| 293 | 0.1% | 0.9% | |
| 294 | 0.1% | 0.8% | |
| 295 | 0.1% | 0.7% | |
| 296 | 0.1% | 0.6% | |
| 297 | 0.1% | 0.5% | |
| 298 | 0.1% | 0.5% | |
| 299 | 0% | 0.4% | |
| 300 | 0% | 0.3% | |
| 301 | 0% | 0.3% | |
| 302 | 0% | 0.3% | |
| 303 | 0% | 0.2% | |
| 304 | 0% | 0.2% | |
| 305 | 0% | 0.2% | |
| 306 | 0% | 0.2% | |
| 307 | 0% | 0.1% | |
| 308 | 0% | 0.1% | |
| 309 | 0% | 0.1% | |
| 310 | 0% | 0.1% | |
| 311 | 0% | 0.1% | |
| 312 | 0% | 0% | |
| 313 | 0% | 0% | |
| 314 | 0% | 0% | |
| 315 | 0% | 0% | |
| 316 | 0% | 0% | |
| 317 | 0% | 0% | |
| 318 | 0% | 0% | |
| 319 | 0% | 0% | |
| 320 | 0% | 0% | |
| 321 | 0% | 0% | |
| 322 | 0% | 0% | |
| 323 | 0% | 0% | |
| 324 | 0% | 0% | |
| 325 | 0% | 0% | |
| 326 | 0% | 0% | Last Result |
Christlich Demokratische Union Deutschlands – Alternative für Deutschland – Christlich-Soziale Union in Bayern
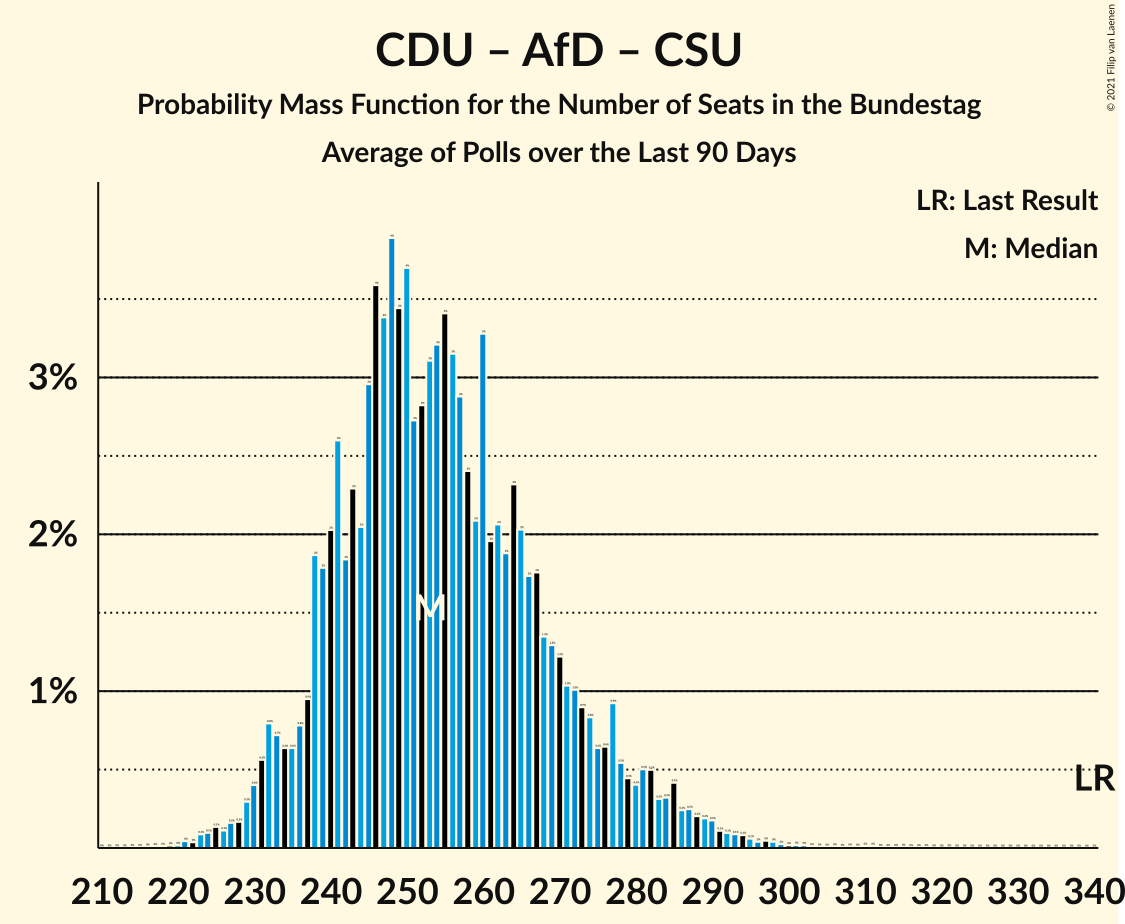
| Number of Seats | Probability | Accumulated | Special Marks |
|---|---|---|---|
| 219 | 0% | 100% | |
| 220 | 0% | 99.9% | |
| 221 | 0% | 99.9% | |
| 222 | 0% | 99.9% | |
| 223 | 0.1% | 99.8% | |
| 224 | 0.1% | 99.8% | |
| 225 | 0.1% | 99.7% | |
| 226 | 0.1% | 99.5% | |
| 227 | 0.2% | 99.4% | |
| 228 | 0.2% | 99.3% | |
| 229 | 0.3% | 99.1% | |
| 230 | 0.4% | 98.8% | |
| 231 | 0.6% | 98% | |
| 232 | 0.8% | 98% | |
| 233 | 0.7% | 97% | |
| 234 | 0.6% | 96% | |
| 235 | 0.6% | 96% | |
| 236 | 0.8% | 95% | |
| 237 | 0.9% | 94% | |
| 238 | 2% | 93% | |
| 239 | 2% | 91% | |
| 240 | 2% | 90% | |
| 241 | 3% | 88% | |
| 242 | 2% | 85% | |
| 243 | 2% | 83% | |
| 244 | 2% | 81% | |
| 245 | 3% | 79% | |
| 246 | 4% | 76% | |
| 247 | 3% | 72% | |
| 248 | 4% | 69% | |
| 249 | 3% | 65% | |
| 250 | 4% | 62% | |
| 251 | 3% | 58% | |
| 252 | 3% | 55% | |
| 253 | 3% | 52% | Median |
| 254 | 3% | 49% | |
| 255 | 3% | 46% | |
| 256 | 3% | 43% | |
| 257 | 3% | 39% | |
| 258 | 2% | 37% | |
| 259 | 2% | 34% | |
| 260 | 3% | 32% | |
| 261 | 2% | 29% | |
| 262 | 2% | 27% | |
| 263 | 2% | 25% | |
| 264 | 2% | 23% | |
| 265 | 2% | 21% | |
| 266 | 2% | 19% | |
| 267 | 2% | 17% | |
| 268 | 1.3% | 15% | |
| 269 | 1.3% | 14% | |
| 270 | 1.2% | 12% | |
| 271 | 1.0% | 11% | |
| 272 | 1.0% | 10% | |
| 273 | 0.9% | 9% | |
| 274 | 0.8% | 8% | |
| 275 | 0.6% | 7% | |
| 276 | 0.6% | 7% | |
| 277 | 0.9% | 6% | |
| 278 | 0.5% | 5% | |
| 279 | 0.4% | 5% | |
| 280 | 0.4% | 4% | |
| 281 | 0.5% | 4% | |
| 282 | 0.5% | 3% | |
| 283 | 0.3% | 3% | |
| 284 | 0.3% | 3% | |
| 285 | 0.4% | 2% | |
| 286 | 0.2% | 2% | |
| 287 | 0.2% | 2% | |
| 288 | 0.2% | 1.3% | |
| 289 | 0.2% | 1.1% | |
| 290 | 0.2% | 0.9% | |
| 291 | 0.1% | 0.7% | |
| 292 | 0.1% | 0.6% | |
| 293 | 0.1% | 0.5% | |
| 294 | 0.1% | 0.4% | |
| 295 | 0.1% | 0.4% | |
| 296 | 0% | 0.3% | |
| 297 | 0% | 0.3% | |
| 298 | 0% | 0.2% | |
| 299 | 0% | 0.2% | |
| 300 | 0% | 0.2% | |
| 301 | 0% | 0.1% | |
| 302 | 0% | 0.1% | |
| 303 | 0% | 0.1% | |
| 304 | 0% | 0.1% | |
| 305 | 0% | 0.1% | |
| 306 | 0% | 0.1% | |
| 307 | 0% | 0.1% | |
| 308 | 0% | 0.1% | |
| 309 | 0% | 0.1% | |
| 310 | 0% | 0.1% | |
| 311 | 0% | 0% | |
| 312 | 0% | 0% | |
| 313 | 0% | 0% | |
| 314 | 0% | 0% | |
| 315 | 0% | 0% | |
| 316 | 0% | 0% | |
| 317 | 0% | 0% | |
| 318 | 0% | 0% | |
| 319 | 0% | 0% | |
| 320 | 0% | 0% | |
| 321 | 0% | 0% | |
| 322 | 0% | 0% | |
| 323 | 0% | 0% | |
| 324 | 0% | 0% | |
| 325 | 0% | 0% | |
| 326 | 0% | 0% | |
| 327 | 0% | 0% | |
| 328 | 0% | 0% | |
| 329 | 0% | 0% | |
| 330 | 0% | 0% | |
| 331 | 0% | 0% | |
| 332 | 0% | 0% | |
| 333 | 0% | 0% | |
| 334 | 0% | 0% | |
| 335 | 0% | 0% | |
| 336 | 0% | 0% | |
| 337 | 0% | 0% | |
| 338 | 0% | 0% | |
| 339 | 0% | 0% | |
| 340 | 0% | 0% | Last Result |
Sozialdemokratische Partei Deutschlands – Die Linke
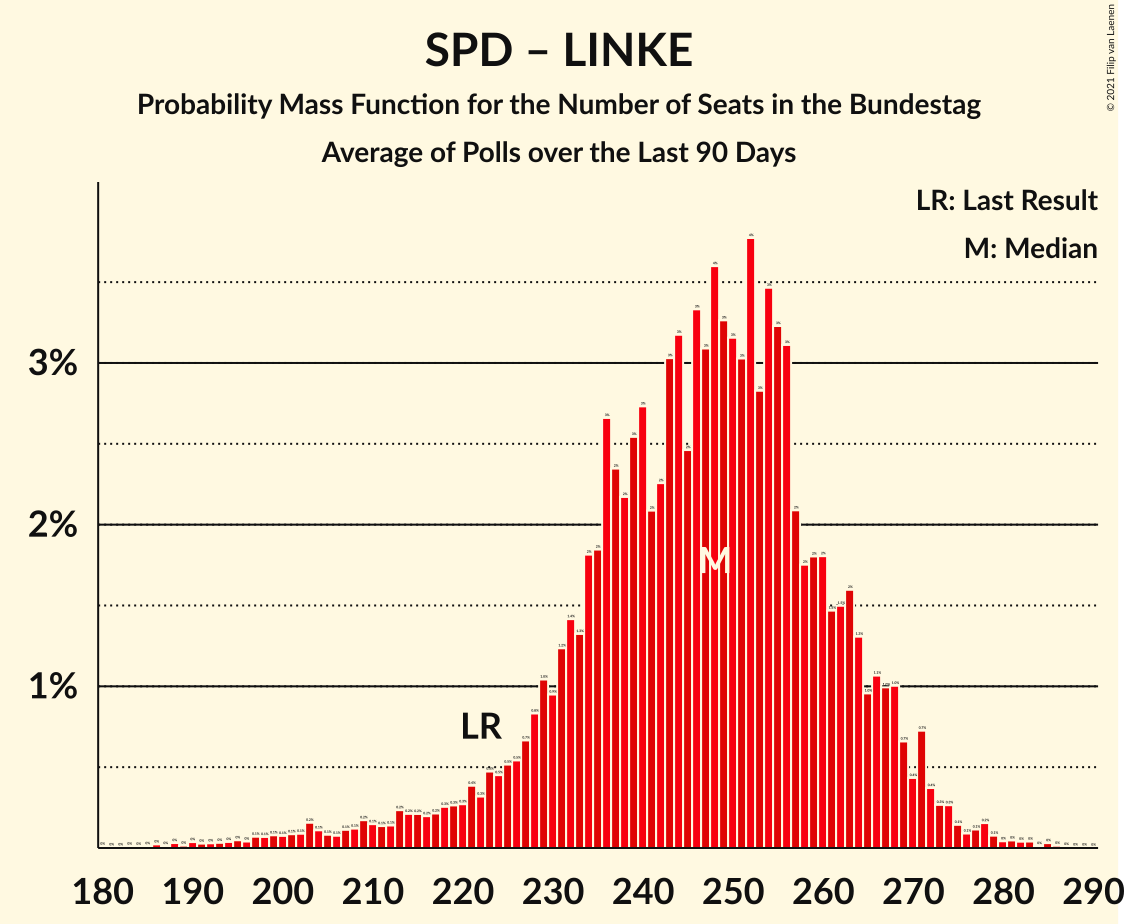
| Number of Seats | Probability | Accumulated | Special Marks |
|---|---|---|---|
| 184 | 0% | 100% | |
| 185 | 0% | 99.9% | |
| 186 | 0% | 99.9% | |
| 187 | 0% | 99.9% | |
| 188 | 0% | 99.9% | |
| 189 | 0% | 99.9% | |
| 190 | 0% | 99.9% | |
| 191 | 0% | 99.8% | |
| 192 | 0% | 99.8% | |
| 193 | 0% | 99.8% | |
| 194 | 0% | 99.7% | |
| 195 | 0% | 99.7% | |
| 196 | 0% | 99.6% | |
| 197 | 0.1% | 99.6% | |
| 198 | 0.1% | 99.5% | |
| 199 | 0.1% | 99.5% | |
| 200 | 0.1% | 99.4% | |
| 201 | 0.1% | 99.3% | |
| 202 | 0.1% | 99.2% | |
| 203 | 0.2% | 99.1% | |
| 204 | 0.1% | 99.0% | |
| 205 | 0.1% | 98.9% | |
| 206 | 0.1% | 98.8% | |
| 207 | 0.1% | 98.7% | |
| 208 | 0.1% | 98.6% | |
| 209 | 0.2% | 98% | |
| 210 | 0.1% | 98% | |
| 211 | 0.1% | 98% | |
| 212 | 0.1% | 98% | |
| 213 | 0.2% | 98% | |
| 214 | 0.2% | 98% | |
| 215 | 0.2% | 97% | |
| 216 | 0.2% | 97% | |
| 217 | 0.2% | 97% | |
| 218 | 0.3% | 97% | |
| 219 | 0.3% | 97% | |
| 220 | 0.3% | 96% | |
| 221 | 0.4% | 96% | |
| 222 | 0.3% | 96% | Last Result |
| 223 | 0.5% | 95% | |
| 224 | 0.5% | 95% | |
| 225 | 0.5% | 94% | |
| 226 | 0.5% | 94% | |
| 227 | 0.7% | 93% | |
| 228 | 0.8% | 93% | |
| 229 | 1.0% | 92% | |
| 230 | 0.9% | 91% | |
| 231 | 1.2% | 90% | |
| 232 | 1.4% | 89% | |
| 233 | 1.3% | 87% | |
| 234 | 2% | 86% | |
| 235 | 2% | 84% | |
| 236 | 3% | 82% | |
| 237 | 2% | 80% | |
| 238 | 2% | 77% | |
| 239 | 3% | 75% | |
| 240 | 3% | 72% | |
| 241 | 2% | 70% | |
| 242 | 2% | 68% | |
| 243 | 3% | 65% | |
| 244 | 3% | 62% | |
| 245 | 2% | 59% | |
| 246 | 3% | 57% | Median |
| 247 | 3% | 53% | |
| 248 | 4% | 50% | |
| 249 | 3% | 47% | |
| 250 | 3% | 43% | |
| 251 | 3% | 40% | |
| 252 | 4% | 37% | |
| 253 | 3% | 34% | |
| 254 | 3% | 31% | |
| 255 | 3% | 27% | |
| 256 | 3% | 24% | |
| 257 | 2% | 21% | |
| 258 | 2% | 19% | |
| 259 | 2% | 17% | |
| 260 | 2% | 15% | |
| 261 | 1.5% | 13% | |
| 262 | 1.5% | 12% | |
| 263 | 2% | 10% | |
| 264 | 1.3% | 9% | |
| 265 | 1.0% | 8% | |
| 266 | 1.1% | 7% | |
| 267 | 1.0% | 6% | |
| 268 | 1.0% | 5% | |
| 269 | 0.7% | 4% | |
| 270 | 0.4% | 3% | |
| 271 | 0.7% | 2% | |
| 272 | 0.4% | 2% | |
| 273 | 0.3% | 1.4% | |
| 274 | 0.3% | 1.1% | |
| 275 | 0.1% | 0.8% | |
| 276 | 0.1% | 0.7% | |
| 277 | 0.1% | 0.6% | |
| 278 | 0.2% | 0.5% | |
| 279 | 0.1% | 0.3% | |
| 280 | 0% | 0.2% | |
| 281 | 0% | 0.2% | |
| 282 | 0% | 0.2% | |
| 283 | 0% | 0.1% | |
| 284 | 0% | 0.1% | |
| 285 | 0% | 0.1% | |
| 286 | 0% | 0% |
Technical Information
- Number of polls included in this average: 10
- Lowest number of simulations done in a poll included in this average: 1,048,576
- Total number of simulations done in the polls included in this average: 10,485,760
- Error estimate: 1.59%