Poll Average
Voting Intentions | Seats | Coalitions | Technical Information
Summary
The table below lists the polls on which the average is based. They are the most recent polls (less than 90 days old) registered and analyzed so far.
| Period | Polling firm/Commissioner(s) | PSD | CDS–PP | PS | BE | CDU | PAN | L | IL | A | CH |
|---|---|---|---|---|---|---|---|---|---|---|---|
| 4 October 2015 | General Election | 36.9% 89 |
36.9% 18 |
32.3% 86 |
10.2% 19 |
8.2% 17 |
1.4% 1 |
0.7% 0 |
0.0% 0 |
0.0% 0 |
0.0% 0 |
| N/A | Poll Average | 24–31% 67–87 |
4–6% 4–10 |
33–41% 97–117 |
8–12% 15–25 |
5–9% 7–19 |
2–7% 3–12 |
0–2% 0–1 |
0–2% 0 |
0–2% 0–1 |
0–3% 0–2 |
| 30 September–3 October 2019 | Pitagórica Jornal de Notícias |
24–31% 65–93 |
3–7% 2–12 |
33–41% 92–118 |
7–12% 12–25 |
5–9% 6–18 |
3–7% 4–13 |
0–2% 0–1 |
0–2% 0–2 |
1–2% 0–2 |
1–3% 0–2 |
| 26 September–2 October 2019 | Aximage Jornal Económico |
25–29% 72–82 |
4–6% 6–8 |
34–39% 101–112 |
9–12% 19–25 |
6–8% 8–15 |
3–5% 3–6 |
1–2% 0–1 |
1–2% 0 |
N/A N/A |
1–2% 0 |
| 26 September–1 October 2019 | Intercampus Correio da Manhã and Negócios |
23–29% 67–84 |
3–6% 3–10 |
32–38% 95–113 |
7–11% 14–23 |
6–10% 13–21 |
4–7% 6–14 |
N/A N/A |
N/A N/A |
N/A N/A |
N/A N/A |
| 25 September–1 October 2019 | Eurosondagem Porto Canal |
24–27% 66–77 |
4–6% 6–9 |
37–41% 107–118 |
8–11% 17–24 |
6–8% 10–17 |
3–5% 4–6 |
N/A N/A |
N/A N/A |
N/A N/A |
N/A N/A |
| 23–29 September 2019 | GfK Metris Expresso and SIC Notícias |
26–31% 71–85 |
4–6% 4–10 |
36–41% 101–117 |
9–12% 18–24 |
5–8% 6–15 |
2–4% 2–6 |
0–1% 0–1 |
0–1% 0 |
0–1% 0 |
0–1% 0 |
| 26–29 September 2019 | CESOP–UCP Público and RTP |
28–31% 78–89 |
4–6% 6–8 |
35–38% 100–112 |
9–11% 18–24 |
5–7% 6–13 |
2–4% 2–4 |
1% 0–1 |
1% 0 |
1% 0 |
1% 0 |
| 4 October 2015 | General Election | 36.9% 89 |
36.9% 18 |
32.3% 86 |
10.2% 19 |
8.2% 17 |
1.4% 1 |
0.7% 0 |
0.0% 0 |
0.0% 0 |
0.0% 0 |
Only polls for which at least the sample size has been published are included in the table above.
Legend:
- Top half of each row: Voting intentions (95% confidence interval)
- Bottom half of each row: Seat projections for the Assembleia da República (95% confidence interval)
- PSD: Partido Social Democrata
- CDS–PP: CDS–Partido Popular
- PS: Partido Socialista
- BE: Bloco de Esquerda
- CDU: Coligação Democrática Unitária
- PAN: Pessoas–Animais–Natureza
- L: LIVRE
- IL: Iniciativa Liberal
- A: Aliança
- CH: Chega
- N/A (single party): Party not included the published results
- N/A (entire row): Calculation for this opinion poll not started yet
Voting Intentions

Confidence Intervals
| Party | Last Result | Median | 80% Confidence Interval | 90% Confidence Interval | 95% Confidence Interval | 99% Confidence Interval |
|---|---|---|---|---|---|---|
| Partido Social Democrata | 36.9% | 27.3% | 25.0–30.0% | 24.5–30.5% | 24.1–30.9% | 23.3–31.7% |
| CDS–Partido Popular | 36.9% | 4.9% | 4.2–5.7% | 3.9–6.0% | 3.6–6.2% | 3.2–6.8% |
| Partido Socialista | 32.3% | 37.1% | 34.8–39.6% | 34.0–40.2% | 33.3–40.7% | 32.1–41.7% |
| Bloco de Esquerda | 10.2% | 9.8% | 8.4–11.0% | 7.9–11.4% | 7.6–11.7% | 6.9–12.3% |
| Coligação Democrática Unitária | 8.2% | 6.7% | 5.6–8.2% | 5.4–8.6% | 5.2–9.1% | 4.8–9.8% |
| Pessoas–Animais–Natureza | 1.4% | 3.9% | 2.9–5.8% | 2.7–6.3% | 2.5–6.6% | 2.3–7.3% |
| LIVRE | 0.7% | 1.0% | 0.5–1.5% | 0.4–1.6% | 0.3–1.8% | 0.2–2.1% |
| Iniciativa Liberal | 0.0% | 0.9% | 0.2–1.3% | 0.2–1.5% | 0.1–1.6% | 0.1–2.0% |
| Aliança | 0.0% | 0.9% | 0.3–1.5% | 0.2–1.8% | 0.2–2.0% | 0.1–2.5% |
| Chega | 0.0% | 1.1% | 0.4–2.1% | 0.3–2.4% | 0.2–2.8% | 0.2–3.3% |
Partido Social Democrata
For a full overview of the results for this party, see the Partido Social Democrata page.
| Voting Intentions | Probability | Accumulated | Special Marks |
|---|---|---|---|
| 20.5–21.5% | 0% | 100% | |
| 21.5–22.5% | 0.1% | 100% | |
| 22.5–23.5% | 0.8% | 99.9% | |
| 23.5–24.5% | 5% | 99.1% | |
| 24.5–25.5% | 12% | 95% | |
| 25.5–26.5% | 19% | 82% | |
| 26.5–27.5% | 19% | 64% | Median |
| 27.5–28.5% | 15% | 45% | |
| 28.5–29.5% | 14% | 30% | |
| 29.5–30.5% | 11% | 16% | |
| 30.5–31.5% | 4% | 4% | |
| 31.5–32.5% | 0.5% | 0.6% | |
| 32.5–33.5% | 0.1% | 0.1% | |
| 33.5–34.5% | 0% | 0% | |
| 34.5–35.5% | 0% | 0% | |
| 35.5–36.5% | 0% | 0% | |
| 36.5–37.5% | 0% | 0% | Last Result |
CDS–Partido Popular
For a full overview of the results for this party, see the CDS–Partido Popular page.
| Voting Intentions | Probability | Accumulated | Special Marks |
|---|---|---|---|
| 1.5–2.5% | 0% | 100% | |
| 2.5–3.5% | 2% | 100% | |
| 3.5–4.5% | 24% | 98% | |
| 4.5–5.5% | 60% | 74% | Median |
| 5.5–6.5% | 14% | 14% | |
| 6.5–7.5% | 0.9% | 0.9% | |
| 7.5–8.5% | 0.1% | 0.1% | |
| 8.5–9.5% | 0% | 0% | |
| 9.5–10.5% | 0% | 0% | |
| 10.5–11.5% | 0% | 0% | |
| 11.5–12.5% | 0% | 0% | |
| 12.5–13.5% | 0% | 0% | |
| 13.5–14.5% | 0% | 0% | |
| 14.5–15.5% | 0% | 0% | |
| 15.5–16.5% | 0% | 0% | |
| 16.5–17.5% | 0% | 0% | |
| 17.5–18.5% | 0% | 0% | |
| 18.5–19.5% | 0% | 0% | |
| 19.5–20.5% | 0% | 0% | |
| 20.5–21.5% | 0% | 0% | |
| 21.5–22.5% | 0% | 0% | |
| 22.5–23.5% | 0% | 0% | |
| 23.5–24.5% | 0% | 0% | |
| 24.5–25.5% | 0% | 0% | |
| 25.5–26.5% | 0% | 0% | |
| 26.5–27.5% | 0% | 0% | |
| 27.5–28.5% | 0% | 0% | |
| 28.5–29.5% | 0% | 0% | |
| 29.5–30.5% | 0% | 0% | |
| 30.5–31.5% | 0% | 0% | |
| 31.5–32.5% | 0% | 0% | |
| 32.5–33.5% | 0% | 0% | |
| 33.5–34.5% | 0% | 0% | |
| 34.5–35.5% | 0% | 0% | |
| 35.5–36.5% | 0% | 0% | |
| 36.5–37.5% | 0% | 0% | Last Result |
Partido Socialista
For a full overview of the results for this party, see the Partido Socialista page.
| Voting Intentions | Probability | Accumulated | Special Marks |
|---|---|---|---|
| 29.5–30.5% | 0% | 100% | |
| 30.5–31.5% | 0.2% | 100% | |
| 31.5–32.5% | 0.8% | 99.8% | Last Result |
| 32.5–33.5% | 2% | 99.0% | |
| 33.5–34.5% | 5% | 97% | |
| 34.5–35.5% | 10% | 92% | |
| 35.5–36.5% | 19% | 81% | |
| 36.5–37.5% | 21% | 62% | Median |
| 37.5–38.5% | 17% | 41% | |
| 38.5–39.5% | 13% | 24% | |
| 39.5–40.5% | 7% | 10% | |
| 40.5–41.5% | 2% | 3% | |
| 41.5–42.5% | 0.5% | 0.6% | |
| 42.5–43.5% | 0.1% | 0.1% | |
| 43.5–44.5% | 0% | 0% |
Bloco de Esquerda
For a full overview of the results for this party, see the Bloco de Esquerda page.
| Voting Intentions | Probability | Accumulated | Special Marks |
|---|---|---|---|
| 4.5–5.5% | 0% | 100% | |
| 5.5–6.5% | 0.2% | 100% | |
| 6.5–7.5% | 2% | 99.8% | |
| 7.5–8.5% | 10% | 98% | |
| 8.5–9.5% | 27% | 88% | |
| 9.5–10.5% | 39% | 61% | Last Result, Median |
| 10.5–11.5% | 18% | 22% | |
| 11.5–12.5% | 3% | 3% | |
| 12.5–13.5% | 0.2% | 0.2% | |
| 13.5–14.5% | 0% | 0% |
Coligação Democrática Unitária
For a full overview of the results for this party, see the Coligação Democrática Unitária page.
| Voting Intentions | Probability | Accumulated | Special Marks |
|---|---|---|---|
| 2.5–3.5% | 0% | 100% | |
| 3.5–4.5% | 0.2% | 100% | |
| 4.5–5.5% | 7% | 99.8% | |
| 5.5–6.5% | 38% | 92% | |
| 6.5–7.5% | 34% | 55% | Median |
| 7.5–8.5% | 15% | 21% | Last Result |
| 8.5–9.5% | 5% | 6% | |
| 9.5–10.5% | 0.9% | 0.9% | |
| 10.5–11.5% | 0.1% | 0.1% | |
| 11.5–12.5% | 0% | 0% |
Pessoas–Animais–Natureza
For a full overview of the results for this party, see the Pessoas–Animais–Natureza page.
| Voting Intentions | Probability | Accumulated | Special Marks |
|---|---|---|---|
| 0.5–1.5% | 0% | 100% | Last Result |
| 1.5–2.5% | 3% | 100% | |
| 2.5–3.5% | 34% | 97% | |
| 3.5–4.5% | 34% | 64% | Median |
| 4.5–5.5% | 16% | 30% | |
| 5.5–6.5% | 11% | 14% | |
| 6.5–7.5% | 3% | 3% | |
| 7.5–8.5% | 0.2% | 0.2% | |
| 8.5–9.5% | 0% | 0% |
LIVRE
For a full overview of the results for this party, see the LIVRE page.
| Voting Intentions | Probability | Accumulated | Special Marks |
|---|---|---|---|
| 0.0–0.5% | 14% | 100% | |
| 0.5–1.5% | 79% | 86% | Last Result, Median |
| 1.5–2.5% | 7% | 7% | |
| 2.5–3.5% | 0.1% | 0.1% | |
| 3.5–4.5% | 0% | 0% |
Iniciativa Liberal
For a full overview of the results for this party, see the Iniciativa Liberal page.
| Voting Intentions | Probability | Accumulated | Special Marks |
|---|---|---|---|
| 0.0–0.5% | 26% | 100% | Last Result |
| 0.5–1.5% | 70% | 74% | Median |
| 1.5–2.5% | 4% | 4% | |
| 2.5–3.5% | 0.1% | 0.1% | |
| 3.5–4.5% | 0% | 0% |
Aliança
For a full overview of the results for this party, see the Aliança page.
| Voting Intentions | Probability | Accumulated | Special Marks |
|---|---|---|---|
| 0.0–0.5% | 29% | 100% | Last Result |
| 0.5–1.5% | 61% | 71% | Median |
| 1.5–2.5% | 9% | 10% | |
| 2.5–3.5% | 0.5% | 0.5% | |
| 3.5–4.5% | 0% | 0% |
Chega
For a full overview of the results for this party, see the Chega page.
| Voting Intentions | Probability | Accumulated | Special Marks |
|---|---|---|---|
| 0.0–0.5% | 18% | 100% | Last Result |
| 0.5–1.5% | 58% | 82% | Median |
| 1.5–2.5% | 20% | 24% | |
| 2.5–3.5% | 4% | 4% | |
| 3.5–4.5% | 0.2% | 0.2% | |
| 4.5–5.5% | 0% | 0% |
Seats
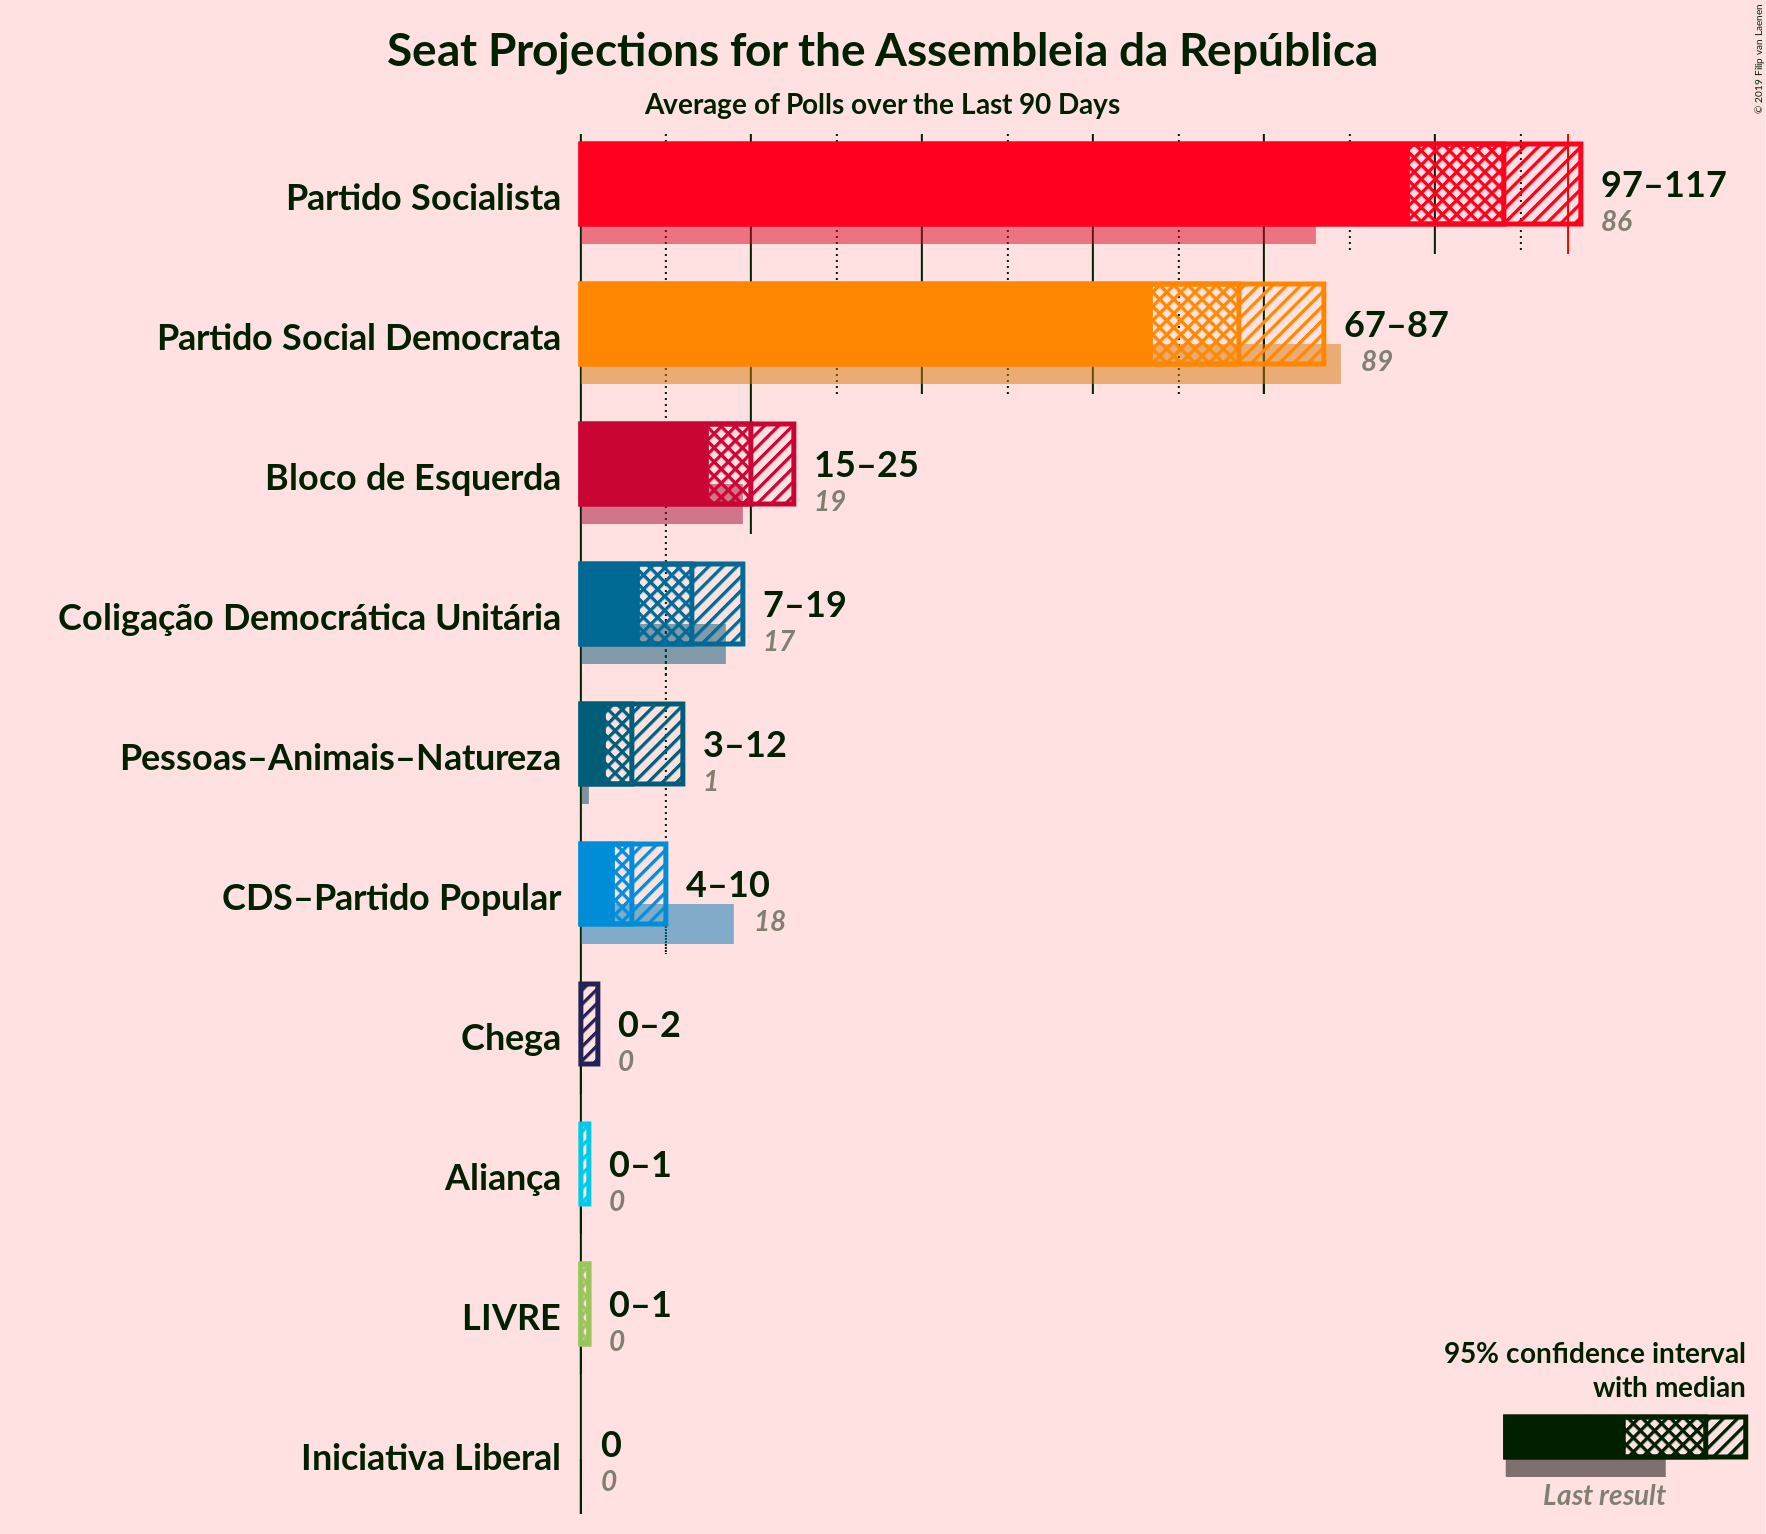
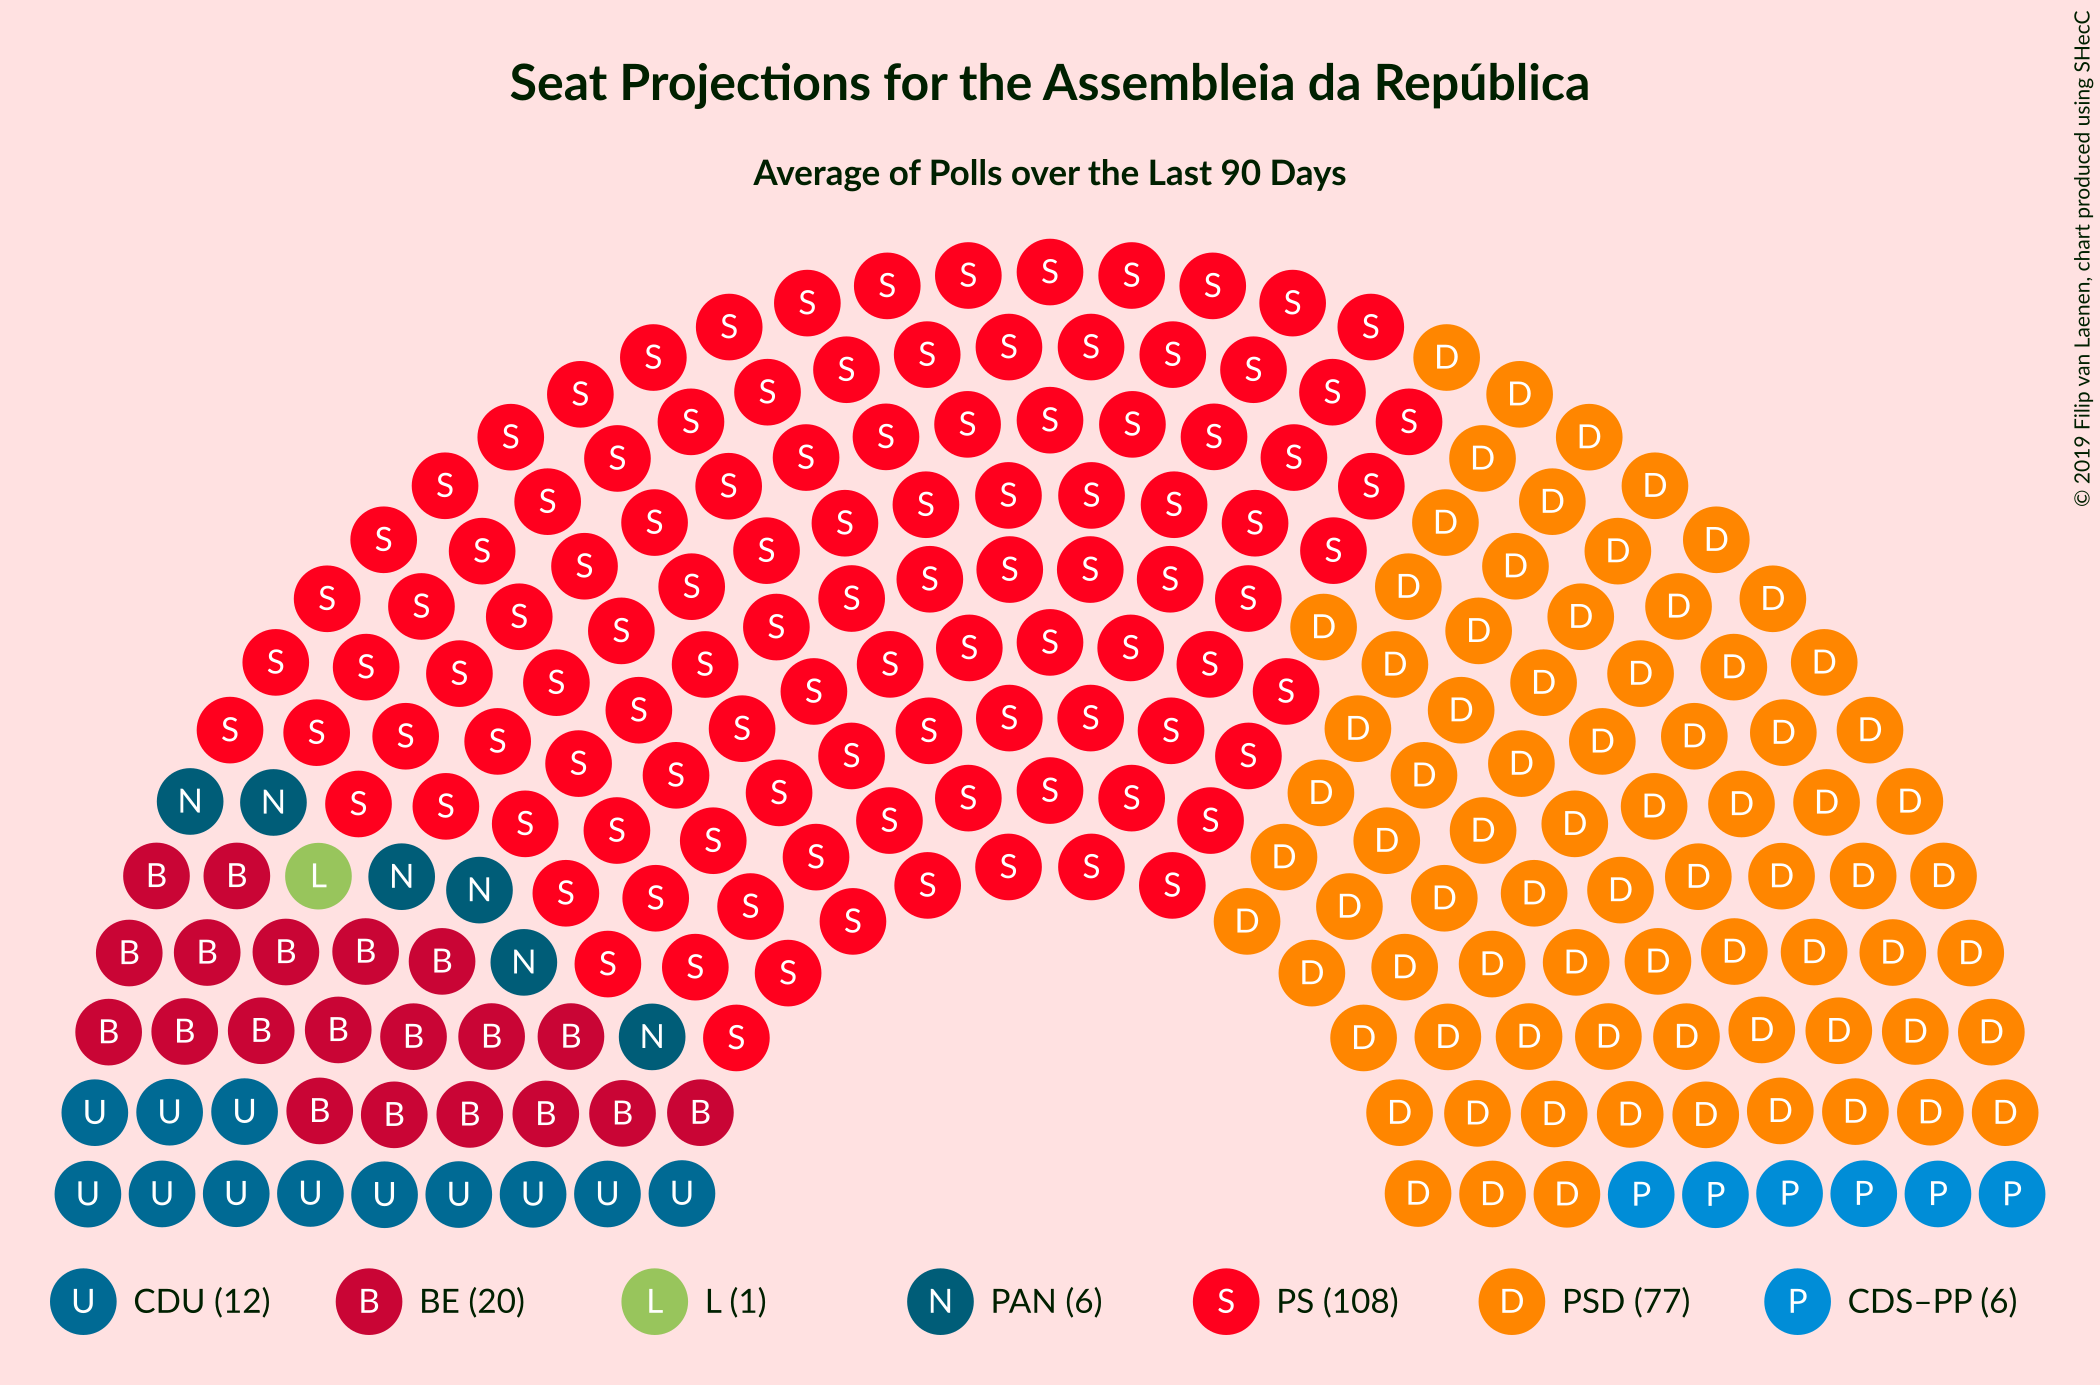
Confidence Intervals
| Party | Last Result | Median | 80% Confidence Interval | 90% Confidence Interval | 95% Confidence Interval | 99% Confidence Interval |
|---|---|---|---|---|---|---|
| Partido Social Democrata | 89 | 77 | 70–85 | 68–86 | 67–87 | 65–93 |
| CDS–Partido Popular | 18 | 6 | 6–7 | 4–9 | 4–10 | 2–12 |
| Partido Socialista | 86 | 108 | 102–114 | 100–115 | 97–117 | 92–119 |
| Bloco de Esquerda | 19 | 20 | 17–24 | 17–24 | 15–25 | 12–26 |
| Coligação Democrática Unitária | 17 | 13 | 8–17 | 8–18 | 7–19 | 6–20 |
| Pessoas–Animais–Natureza | 1 | 6 | 3–9 | 3–10 | 3–12 | 2–15 |
| LIVRE | 0 | 1 | 0–1 | 0–1 | 0–1 | 0–1 |
| Iniciativa Liberal | 0 | 0 | 0 | 0 | 0 | 0–2 |
| Aliança | 0 | 0 | 0 | 0 | 0–1 | 0–2 |
| Chega | 0 | 0 | 0–1 | 0–2 | 0–2 | 0–3 |
Partido Social Democrata
For a full overview of the results for this party, see the Partido Social Democrata page.
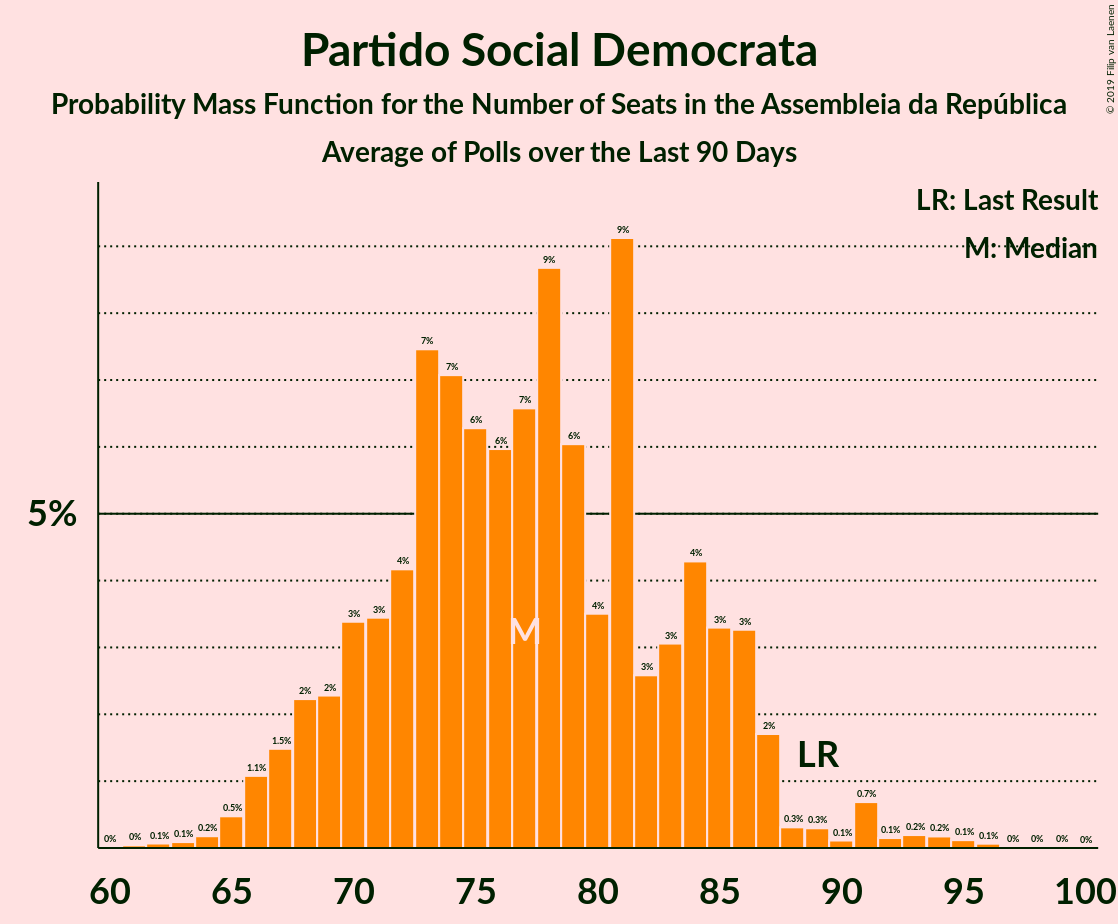
| Number of Seats | Probability | Accumulated | Special Marks |
|---|---|---|---|
| 61 | 0% | 100% | |
| 62 | 0.1% | 99.9% | |
| 63 | 0.1% | 99.9% | |
| 64 | 0.2% | 99.8% | |
| 65 | 0.5% | 99.6% | |
| 66 | 1.1% | 99.1% | |
| 67 | 1.5% | 98% | |
| 68 | 2% | 97% | |
| 69 | 2% | 94% | |
| 70 | 3% | 92% | |
| 71 | 3% | 89% | |
| 72 | 4% | 85% | |
| 73 | 7% | 81% | |
| 74 | 7% | 74% | |
| 75 | 6% | 67% | |
| 76 | 6% | 60% | |
| 77 | 7% | 54% | Median |
| 78 | 9% | 48% | |
| 79 | 6% | 39% | |
| 80 | 4% | 33% | |
| 81 | 9% | 29% | |
| 82 | 3% | 20% | |
| 83 | 3% | 18% | |
| 84 | 4% | 15% | |
| 85 | 3% | 10% | |
| 86 | 3% | 7% | |
| 87 | 2% | 4% | |
| 88 | 0.3% | 2% | |
| 89 | 0.3% | 2% | Last Result |
| 90 | 0.1% | 2% | |
| 91 | 0.7% | 1.4% | |
| 92 | 0.1% | 0.8% | |
| 93 | 0.2% | 0.6% | |
| 94 | 0.2% | 0.4% | |
| 95 | 0.1% | 0.2% | |
| 96 | 0.1% | 0.1% | |
| 97 | 0% | 0.1% | |
| 98 | 0% | 0% |
CDS–Partido Popular
For a full overview of the results for this party, see the CDS–Partido Popular page.
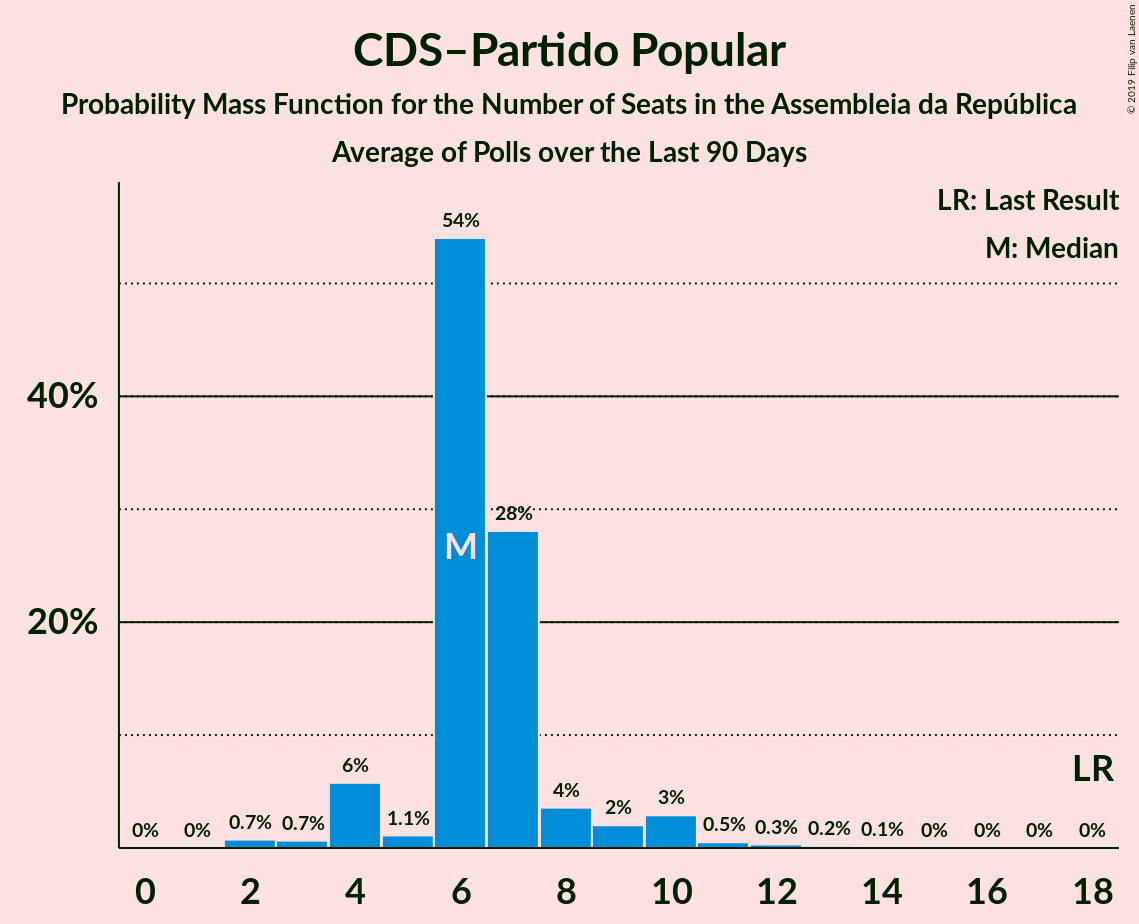
| Number of Seats | Probability | Accumulated | Special Marks |
|---|---|---|---|
| 2 | 0.7% | 100% | |
| 3 | 0.7% | 99.3% | |
| 4 | 6% | 98.6% | |
| 5 | 1.1% | 93% | |
| 6 | 54% | 92% | Median |
| 7 | 28% | 38% | |
| 8 | 4% | 10% | |
| 9 | 2% | 6% | |
| 10 | 3% | 4% | |
| 11 | 0.5% | 1.1% | |
| 12 | 0.3% | 0.6% | |
| 13 | 0.2% | 0.3% | |
| 14 | 0.1% | 0.1% | |
| 15 | 0% | 0% | |
| 16 | 0% | 0% | |
| 17 | 0% | 0% | |
| 18 | 0% | 0% | Last Result |
Partido Socialista
For a full overview of the results for this party, see the Partido Socialista page.
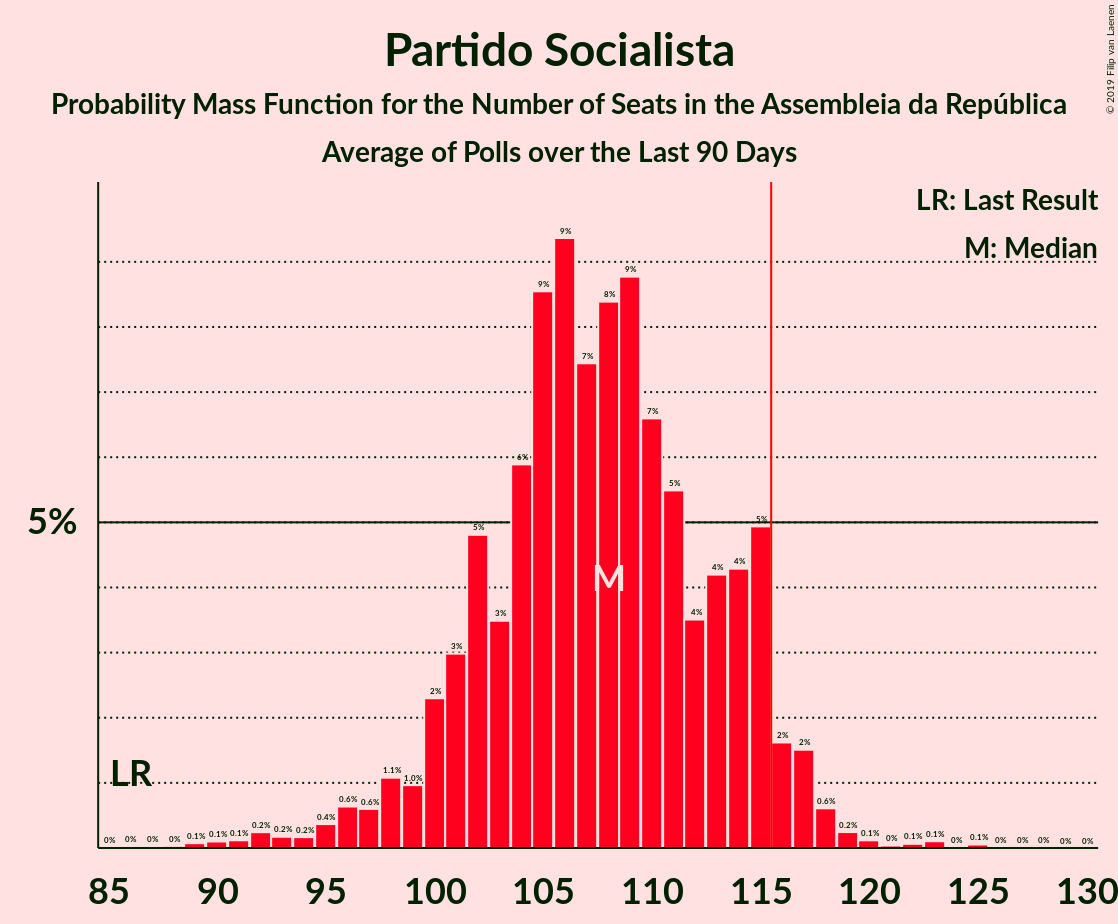
| Number of Seats | Probability | Accumulated | Special Marks |
|---|---|---|---|
| 86 | 0% | 100% | Last Result |
| 87 | 0% | 100% | |
| 88 | 0% | 99.9% | |
| 89 | 0.1% | 99.9% | |
| 90 | 0.1% | 99.8% | |
| 91 | 0.1% | 99.7% | |
| 92 | 0.2% | 99.6% | |
| 93 | 0.2% | 99.4% | |
| 94 | 0.2% | 99.2% | |
| 95 | 0.4% | 99.0% | |
| 96 | 0.6% | 98.7% | |
| 97 | 0.6% | 98% | |
| 98 | 1.1% | 97% | |
| 99 | 1.0% | 96% | |
| 100 | 2% | 95% | |
| 101 | 3% | 93% | |
| 102 | 5% | 90% | |
| 103 | 3% | 85% | |
| 104 | 6% | 82% | |
| 105 | 9% | 76% | |
| 106 | 9% | 67% | |
| 107 | 7% | 58% | |
| 108 | 8% | 51% | Median |
| 109 | 9% | 42% | |
| 110 | 7% | 33% | |
| 111 | 5% | 27% | |
| 112 | 4% | 21% | |
| 113 | 4% | 18% | |
| 114 | 4% | 14% | |
| 115 | 5% | 9% | |
| 116 | 2% | 4% | Majority |
| 117 | 2% | 3% | |
| 118 | 0.6% | 1.3% | |
| 119 | 0.2% | 0.6% | |
| 120 | 0.1% | 0.4% | |
| 121 | 0% | 0.3% | |
| 122 | 0.1% | 0.2% | |
| 123 | 0.1% | 0.2% | |
| 124 | 0% | 0.1% | |
| 125 | 0.1% | 0.1% | |
| 126 | 0% | 0% |
Bloco de Esquerda
For a full overview of the results for this party, see the Bloco de Esquerda page.
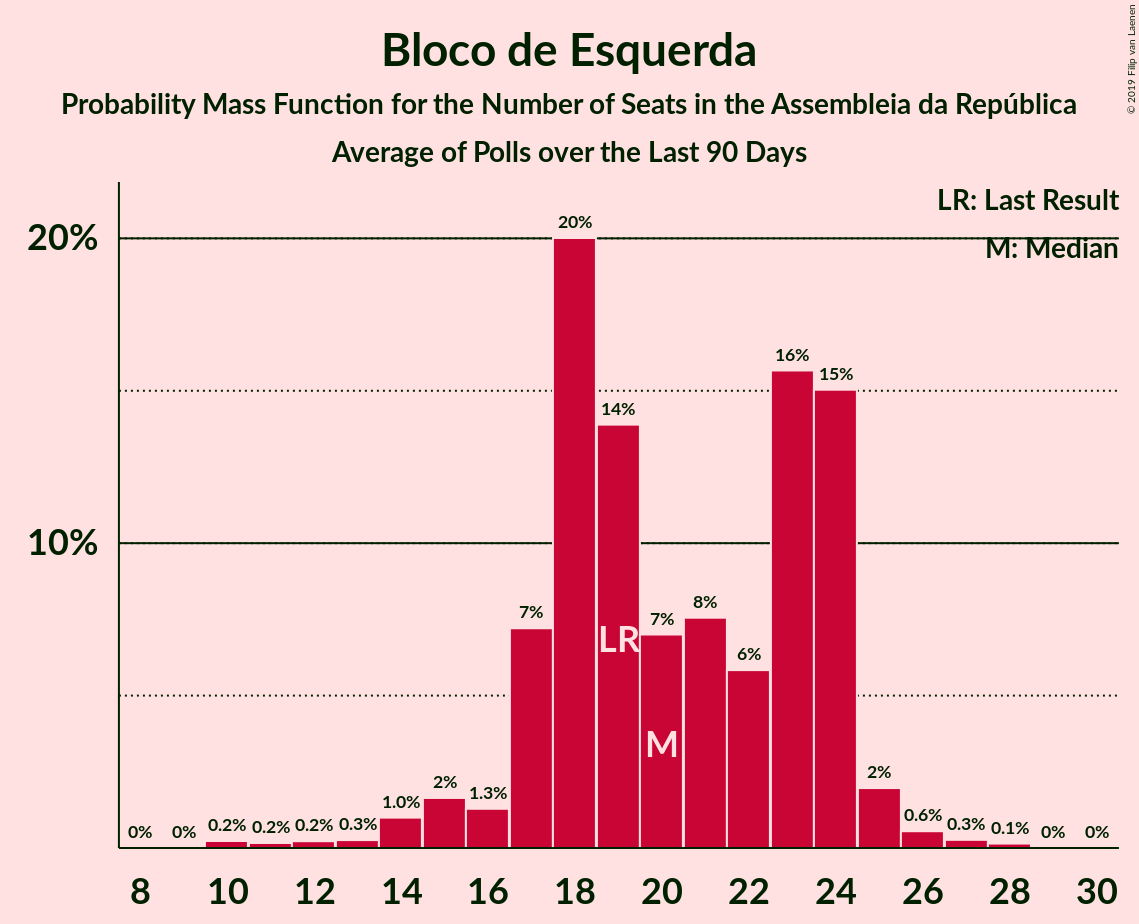
| Number of Seats | Probability | Accumulated | Special Marks |
|---|---|---|---|
| 10 | 0.2% | 100% | |
| 11 | 0.2% | 99.7% | |
| 12 | 0.2% | 99.6% | |
| 13 | 0.3% | 99.4% | |
| 14 | 1.0% | 99.1% | |
| 15 | 2% | 98% | |
| 16 | 1.3% | 96% | |
| 17 | 7% | 95% | |
| 18 | 20% | 88% | |
| 19 | 14% | 68% | Last Result |
| 20 | 7% | 54% | Median |
| 21 | 8% | 47% | |
| 22 | 6% | 40% | |
| 23 | 16% | 34% | |
| 24 | 15% | 18% | |
| 25 | 2% | 3% | |
| 26 | 0.6% | 1.0% | |
| 27 | 0.3% | 0.4% | |
| 28 | 0.1% | 0.2% | |
| 29 | 0% | 0% |
Coligação Democrática Unitária
For a full overview of the results for this party, see the Coligação Democrática Unitária page.
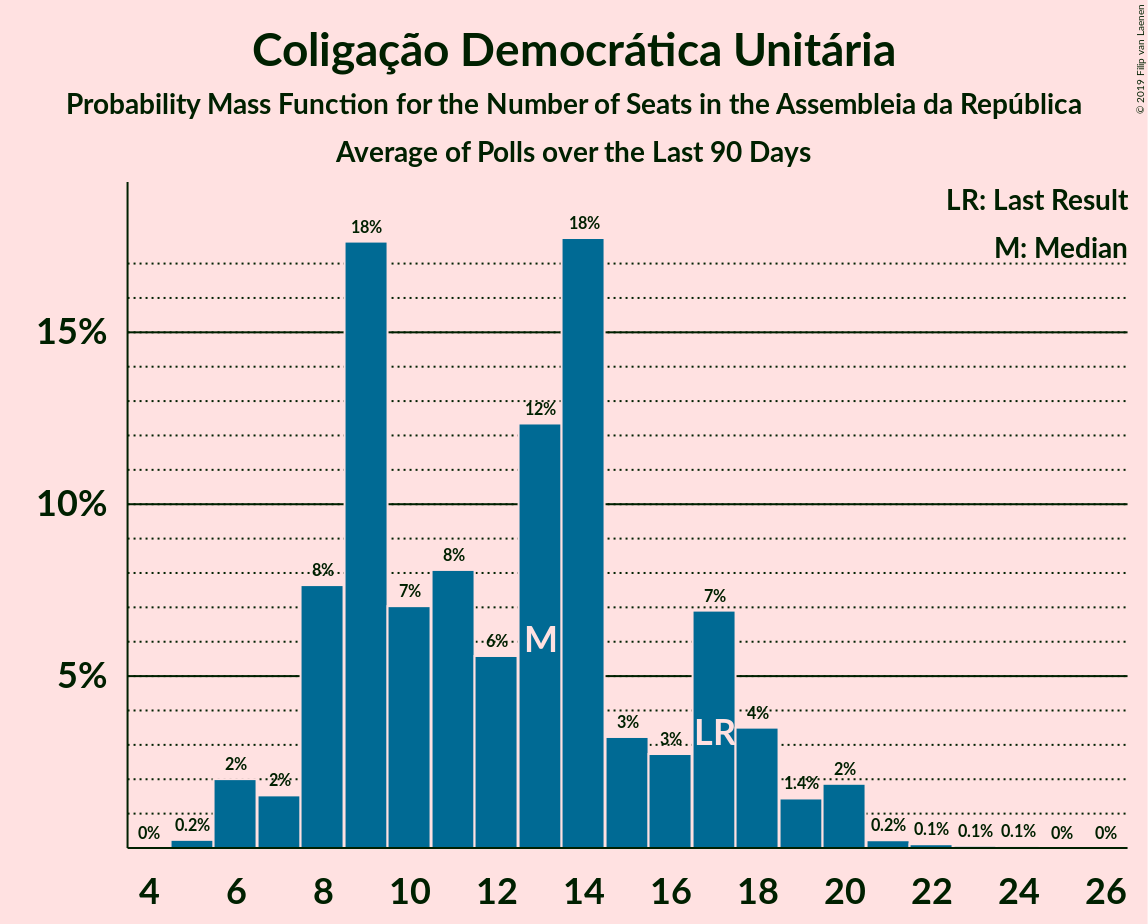
| Number of Seats | Probability | Accumulated | Special Marks |
|---|---|---|---|
| 5 | 0.2% | 100% | |
| 6 | 2% | 99.8% | |
| 7 | 2% | 98% | |
| 8 | 8% | 96% | |
| 9 | 18% | 89% | |
| 10 | 7% | 71% | |
| 11 | 8% | 64% | |
| 12 | 6% | 56% | |
| 13 | 12% | 50% | Median |
| 14 | 18% | 38% | |
| 15 | 3% | 20% | |
| 16 | 3% | 17% | |
| 17 | 7% | 14% | Last Result |
| 18 | 4% | 7% | |
| 19 | 1.4% | 4% | |
| 20 | 2% | 2% | |
| 21 | 0.2% | 0.5% | |
| 22 | 0.1% | 0.2% | |
| 23 | 0.1% | 0.1% | |
| 24 | 0.1% | 0.1% | |
| 25 | 0% | 0% |
Pessoas–Animais–Natureza
For a full overview of the results for this party, see the Pessoas–Animais–Natureza page.
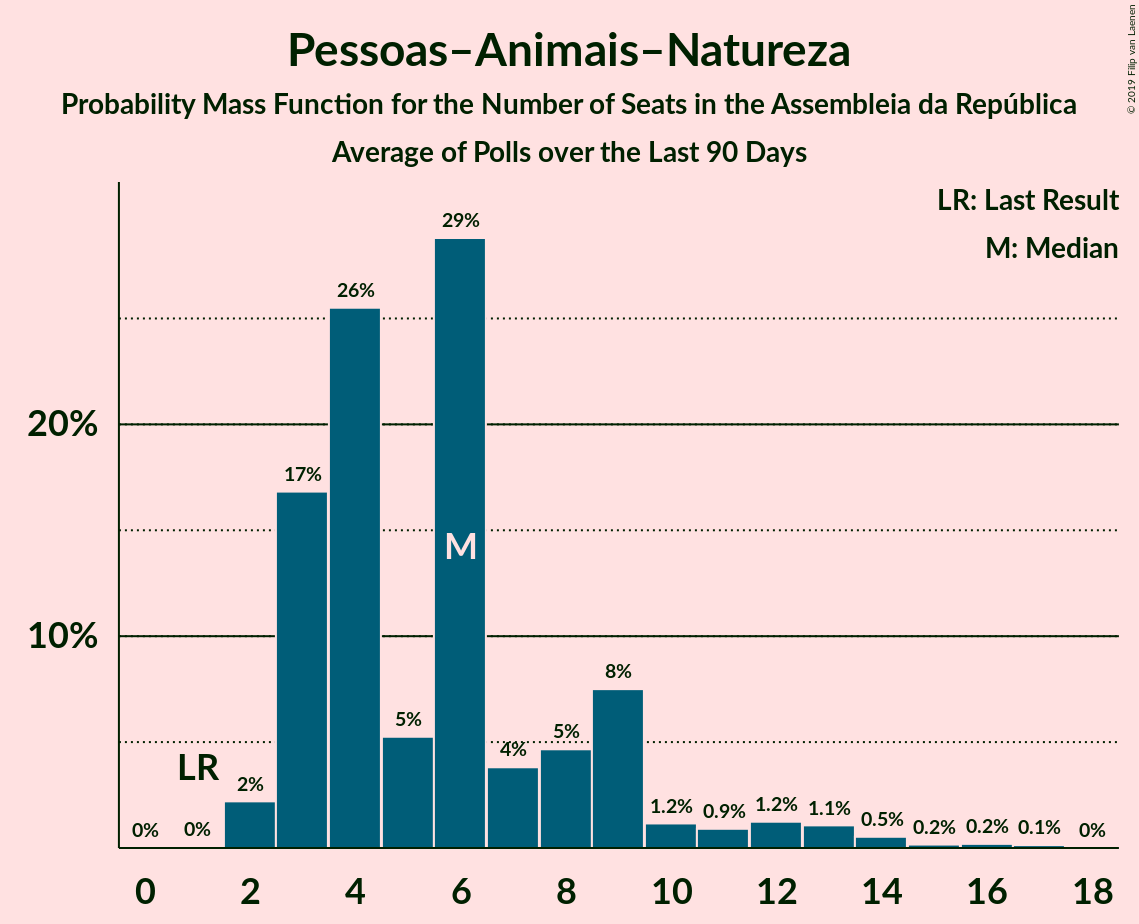
| Number of Seats | Probability | Accumulated | Special Marks |
|---|---|---|---|
| 1 | 0% | 100% | Last Result |
| 2 | 2% | 100% | |
| 3 | 17% | 98% | |
| 4 | 26% | 81% | |
| 5 | 5% | 55% | |
| 6 | 29% | 50% | Median |
| 7 | 4% | 21% | |
| 8 | 5% | 18% | |
| 9 | 8% | 13% | |
| 10 | 1.2% | 5% | |
| 11 | 0.9% | 4% | |
| 12 | 1.2% | 3% | |
| 13 | 1.1% | 2% | |
| 14 | 0.5% | 1.0% | |
| 15 | 0.2% | 0.5% | |
| 16 | 0.2% | 0.3% | |
| 17 | 0.1% | 0.1% | |
| 18 | 0% | 0% |
LIVRE
For a full overview of the results for this party, see the LIVRE page.
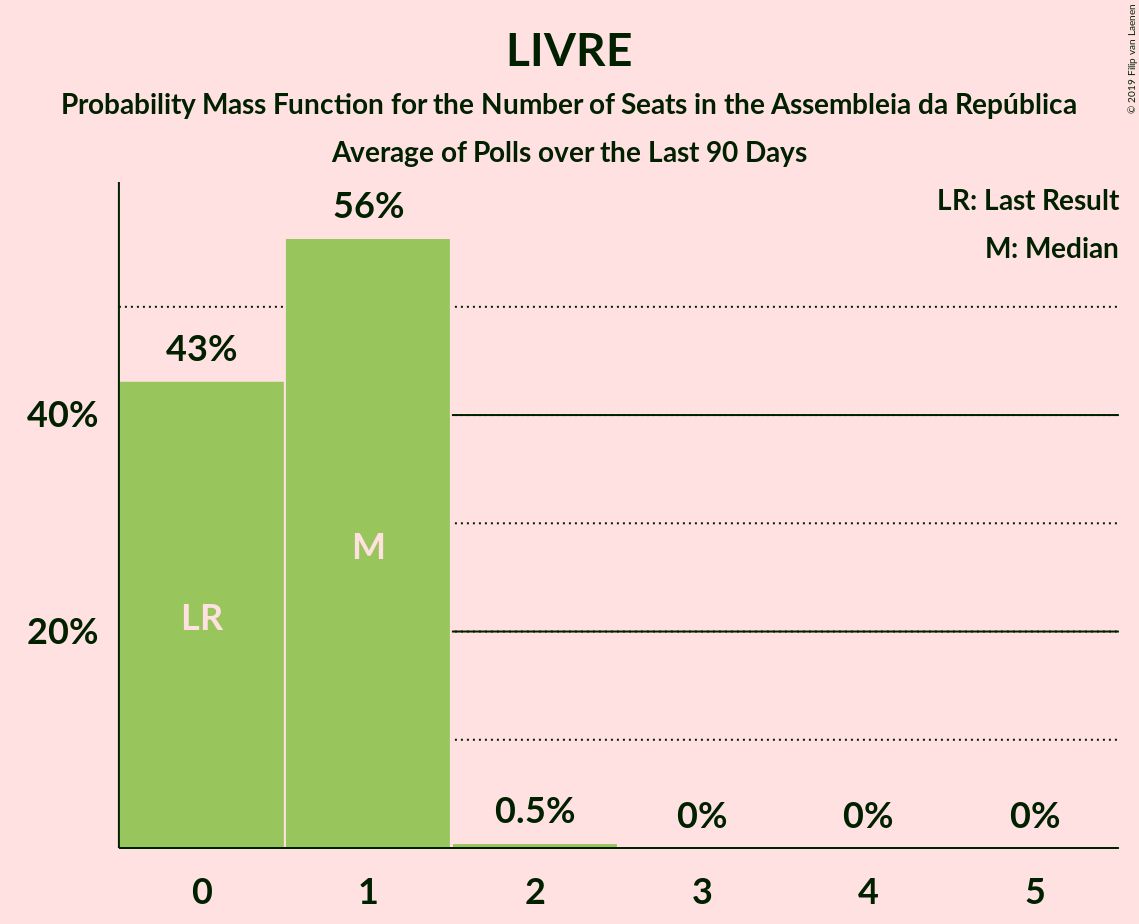
| Number of Seats | Probability | Accumulated | Special Marks |
|---|---|---|---|
| 0 | 43% | 100% | Last Result |
| 1 | 56% | 57% | Median |
| 2 | 0.5% | 0.5% | |
| 3 | 0% | 0% |
Iniciativa Liberal
For a full overview of the results for this party, see the Iniciativa Liberal page.
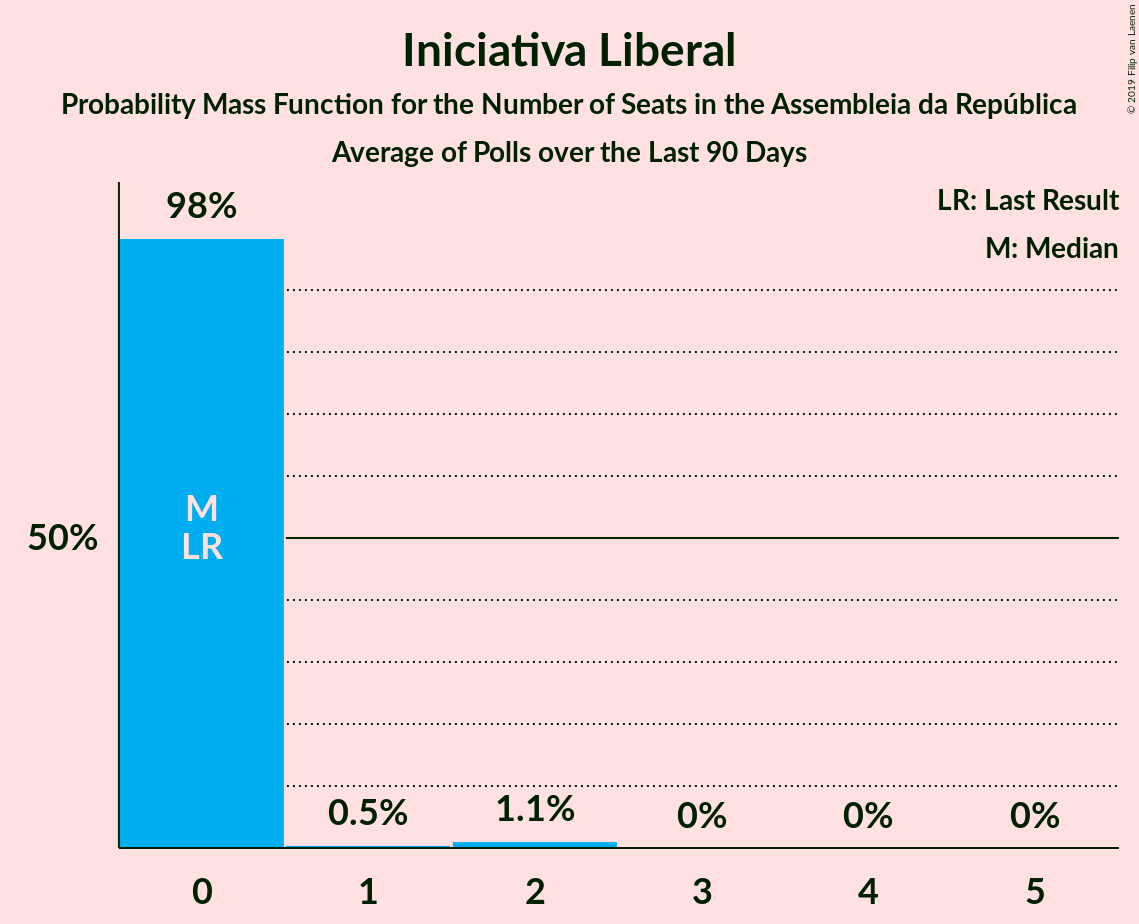
| Number of Seats | Probability | Accumulated | Special Marks |
|---|---|---|---|
| 0 | 98% | 100% | Last Result, Median |
| 1 | 0.5% | 2% | |
| 2 | 1.1% | 1.1% | |
| 3 | 0% | 0% |
Aliança
For a full overview of the results for this party, see the Aliança page.
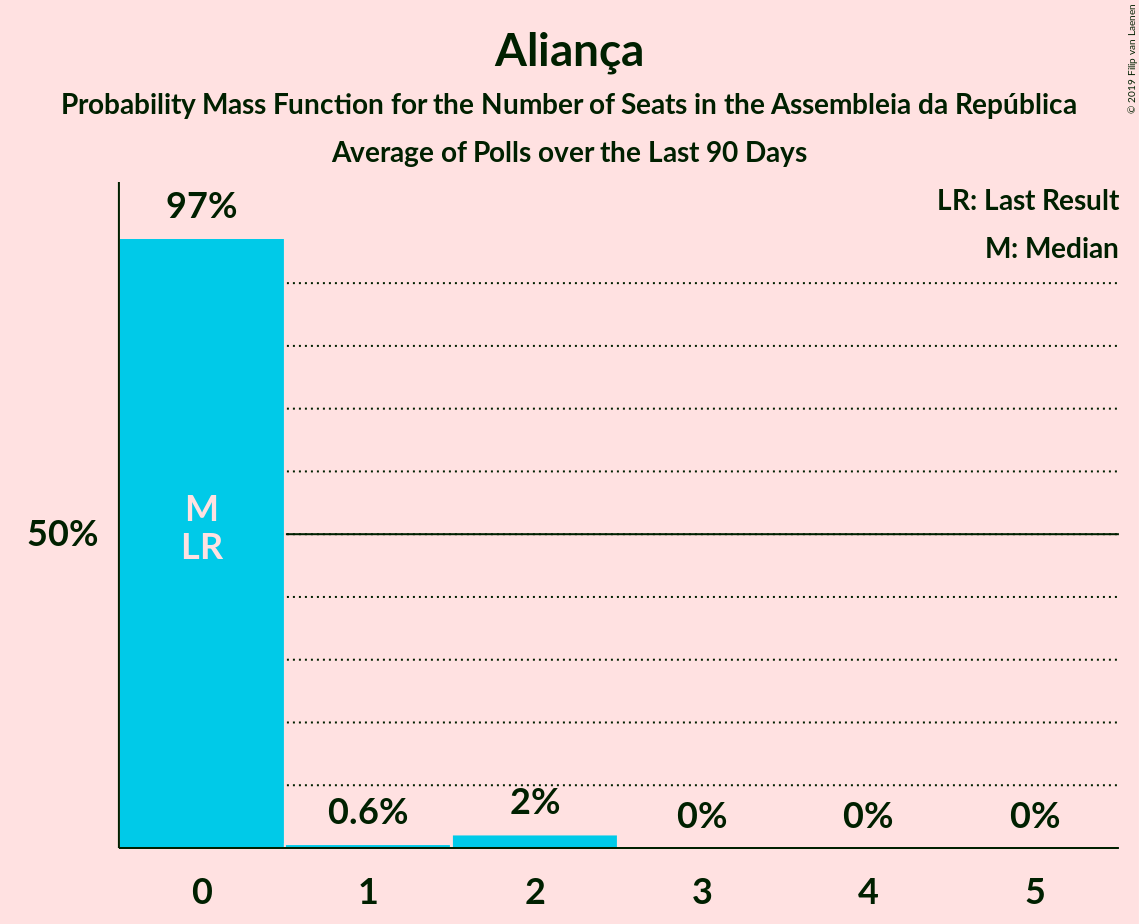
| Number of Seats | Probability | Accumulated | Special Marks |
|---|---|---|---|
| 0 | 97% | 100% | Last Result, Median |
| 1 | 0.6% | 3% | |
| 2 | 2% | 2% | |
| 3 | 0% | 0% |
Chega
For a full overview of the results for this party, see the Chega page.
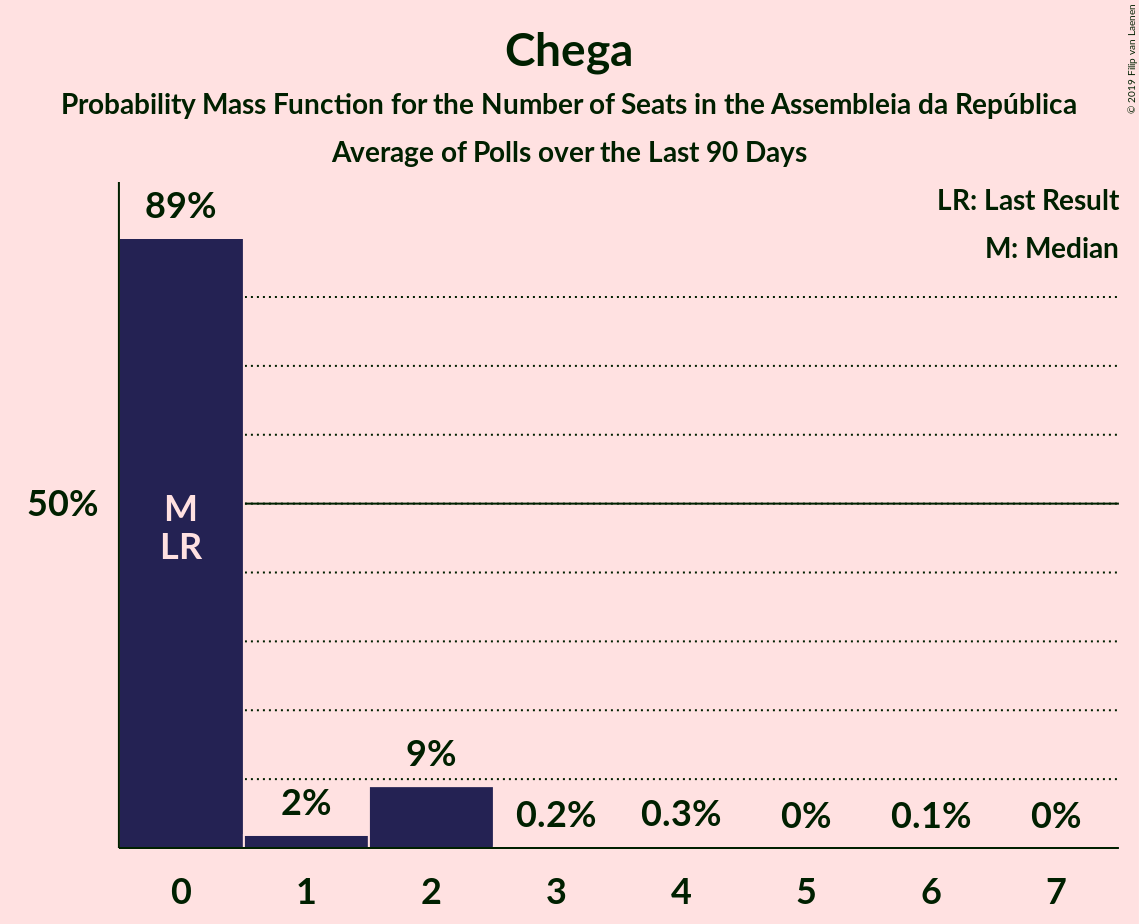
| Number of Seats | Probability | Accumulated | Special Marks |
|---|---|---|---|
| 0 | 89% | 100% | Last Result, Median |
| 1 | 2% | 11% | |
| 2 | 9% | 10% | |
| 3 | 0.2% | 0.6% | |
| 4 | 0.3% | 0.4% | |
| 5 | 0% | 0.1% | |
| 6 | 0.1% | 0.1% | |
| 7 | 0% | 0% |
Coalitions
Confidence Intervals
| Coalition | Last Result | Median | Majority? | 80% Confidence Interval | 90% Confidence Interval | 95% Confidence Interval | 99% Confidence Interval |
|---|---|---|---|---|---|---|---|
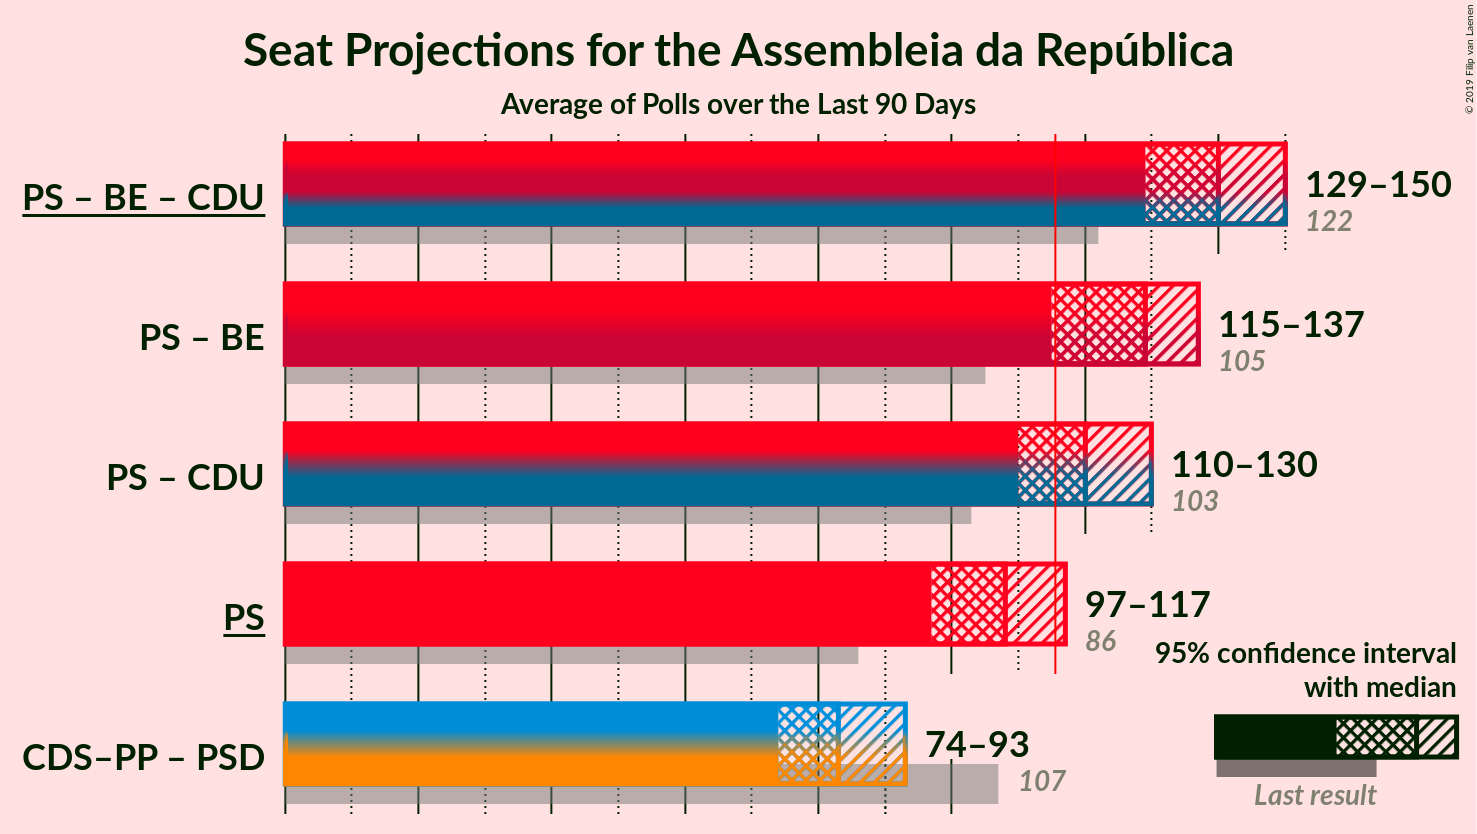
| Partido Socialista – Bloco de Esquerda – Coligação Democrática Unitária | 122 | 140 | 100% | 134–147 | 132–149 | 129–150 | 122–153 |
| Partido Socialista – Bloco de Esquerda | 105 | 129 | 97% | 120–134 | 118–136 | 115–137 | 110–141 |
| Partido Socialista – Coligação Democrática Unitária | 103 | 120 | 78% | 113–127 | 112–129 | 110–130 | 104–133 |
| Partido Socialista | 86 | 108 | 4% | 102–114 | 100–115 | 97–117 | 92–119 |
| CDS–Partido Popular – Partido Social Democrata | 107 | 83 | 0% | 77–91 | 75–92 | 74–93 | 72–99 |
Partido Socialista – Bloco de Esquerda – Coligação Democrática Unitária
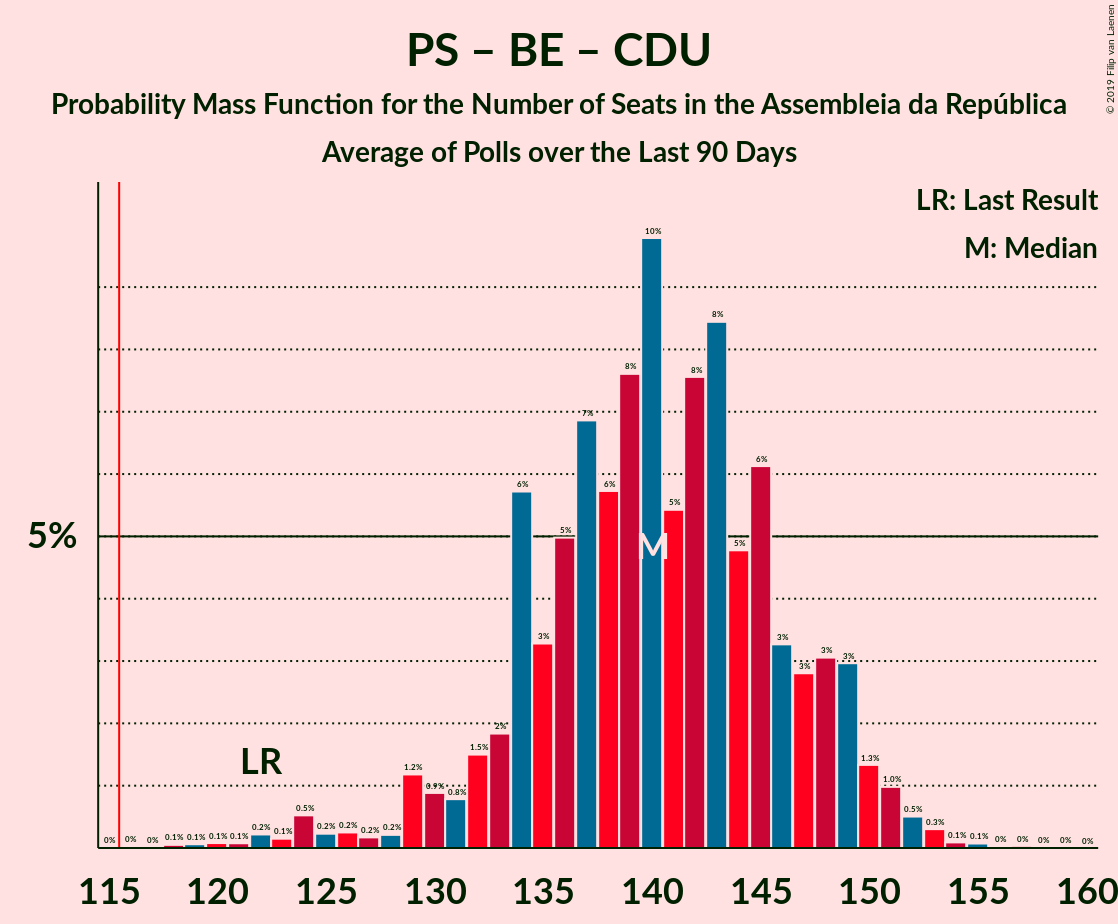
| Number of Seats | Probability | Accumulated | Special Marks |
|---|---|---|---|
| 117 | 0% | 100% | |
| 118 | 0.1% | 99.9% | |
| 119 | 0.1% | 99.9% | |
| 120 | 0.1% | 99.8% | |
| 121 | 0.1% | 99.8% | |
| 122 | 0.2% | 99.7% | Last Result |
| 123 | 0.1% | 99.5% | |
| 124 | 0.5% | 99.3% | |
| 125 | 0.2% | 98.8% | |
| 126 | 0.2% | 98.6% | |
| 127 | 0.2% | 98% | |
| 128 | 0.2% | 98% | |
| 129 | 1.2% | 98% | |
| 130 | 0.9% | 97% | |
| 131 | 0.8% | 96% | |
| 132 | 1.5% | 95% | |
| 133 | 2% | 94% | |
| 134 | 6% | 92% | |
| 135 | 3% | 86% | |
| 136 | 5% | 83% | |
| 137 | 7% | 78% | |
| 138 | 6% | 71% | |
| 139 | 8% | 65% | |
| 140 | 10% | 58% | |
| 141 | 5% | 48% | Median |
| 142 | 8% | 42% | |
| 143 | 8% | 35% | |
| 144 | 5% | 26% | |
| 145 | 6% | 22% | |
| 146 | 3% | 15% | |
| 147 | 3% | 12% | |
| 148 | 3% | 9% | |
| 149 | 3% | 6% | |
| 150 | 1.3% | 3% | |
| 151 | 1.0% | 2% | |
| 152 | 0.5% | 1.0% | |
| 153 | 0.3% | 0.5% | |
| 154 | 0.1% | 0.2% | |
| 155 | 0.1% | 0.1% | |
| 156 | 0% | 0.1% | |
| 157 | 0% | 0% |
Partido Socialista – Bloco de Esquerda
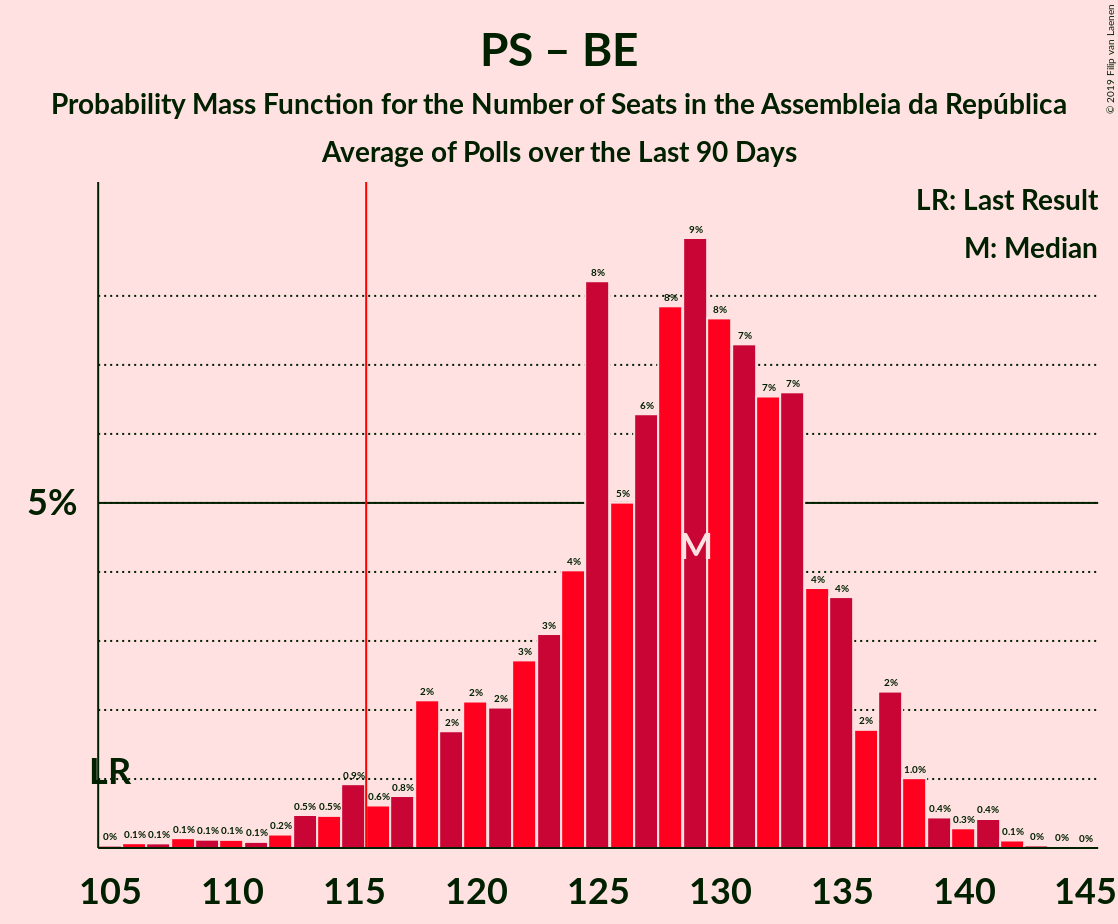
| Number of Seats | Probability | Accumulated | Special Marks |
|---|---|---|---|
| 105 | 0% | 100% | Last Result |
| 106 | 0.1% | 99.9% | |
| 107 | 0.1% | 99.9% | |
| 108 | 0.1% | 99.8% | |
| 109 | 0.1% | 99.6% | |
| 110 | 0.1% | 99.5% | |
| 111 | 0.1% | 99.4% | |
| 112 | 0.2% | 99.3% | |
| 113 | 0.5% | 99.1% | |
| 114 | 0.5% | 98.6% | |
| 115 | 0.9% | 98% | |
| 116 | 0.6% | 97% | Majority |
| 117 | 0.8% | 97% | |
| 118 | 2% | 96% | |
| 119 | 2% | 94% | |
| 120 | 2% | 92% | |
| 121 | 2% | 90% | |
| 122 | 3% | 88% | |
| 123 | 3% | 85% | |
| 124 | 4% | 82% | |
| 125 | 8% | 78% | |
| 126 | 5% | 70% | |
| 127 | 6% | 65% | |
| 128 | 8% | 59% | Median |
| 129 | 9% | 51% | |
| 130 | 8% | 42% | |
| 131 | 7% | 34% | |
| 132 | 7% | 27% | |
| 133 | 7% | 20% | |
| 134 | 4% | 14% | |
| 135 | 4% | 10% | |
| 136 | 2% | 6% | |
| 137 | 2% | 5% | |
| 138 | 1.0% | 2% | |
| 139 | 0.4% | 1.4% | |
| 140 | 0.3% | 0.9% | |
| 141 | 0.4% | 0.6% | |
| 142 | 0.1% | 0.2% | |
| 143 | 0% | 0.1% | |
| 144 | 0% | 0.1% | |
| 145 | 0% | 0% |
Partido Socialista – Coligação Democrática Unitária
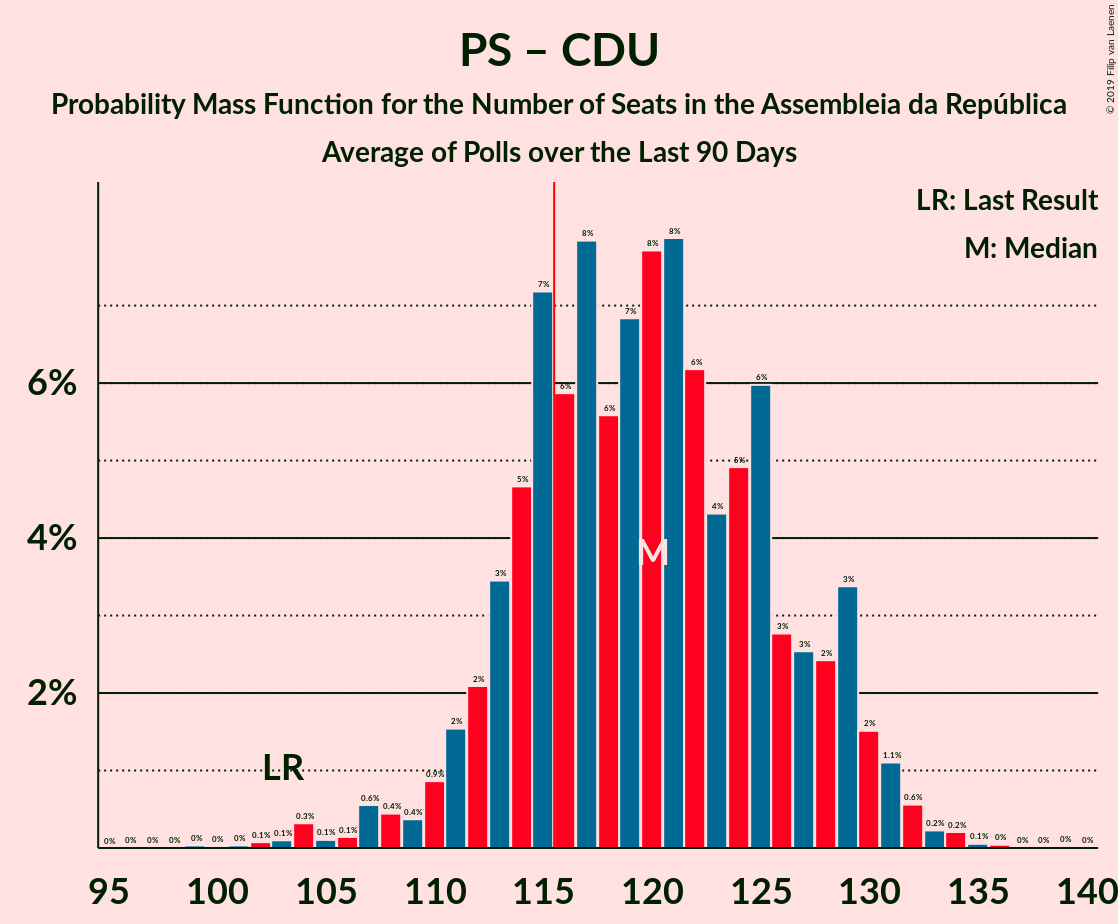
| Number of Seats | Probability | Accumulated | Special Marks |
|---|---|---|---|
| 99 | 0% | 100% | |
| 100 | 0% | 99.9% | |
| 101 | 0% | 99.9% | |
| 102 | 0.1% | 99.9% | |
| 103 | 0.1% | 99.8% | Last Result |
| 104 | 0.3% | 99.7% | |
| 105 | 0.1% | 99.4% | |
| 106 | 0.1% | 99.3% | |
| 107 | 0.6% | 99.1% | |
| 108 | 0.4% | 98.6% | |
| 109 | 0.4% | 98% | |
| 110 | 0.9% | 98% | |
| 111 | 2% | 97% | |
| 112 | 2% | 95% | |
| 113 | 3% | 93% | |
| 114 | 5% | 90% | |
| 115 | 7% | 85% | |
| 116 | 6% | 78% | Majority |
| 117 | 8% | 72% | |
| 118 | 6% | 64% | |
| 119 | 7% | 59% | |
| 120 | 8% | 52% | |
| 121 | 8% | 44% | Median |
| 122 | 6% | 36% | |
| 123 | 4% | 30% | |
| 124 | 5% | 26% | |
| 125 | 6% | 21% | |
| 126 | 3% | 15% | |
| 127 | 3% | 12% | |
| 128 | 2% | 10% | |
| 129 | 3% | 7% | |
| 130 | 2% | 4% | |
| 131 | 1.1% | 2% | |
| 132 | 0.6% | 1.1% | |
| 133 | 0.2% | 0.6% | |
| 134 | 0.2% | 0.4% | |
| 135 | 0.1% | 0.1% | |
| 136 | 0% | 0.1% | |
| 137 | 0% | 0% |
Partido Socialista
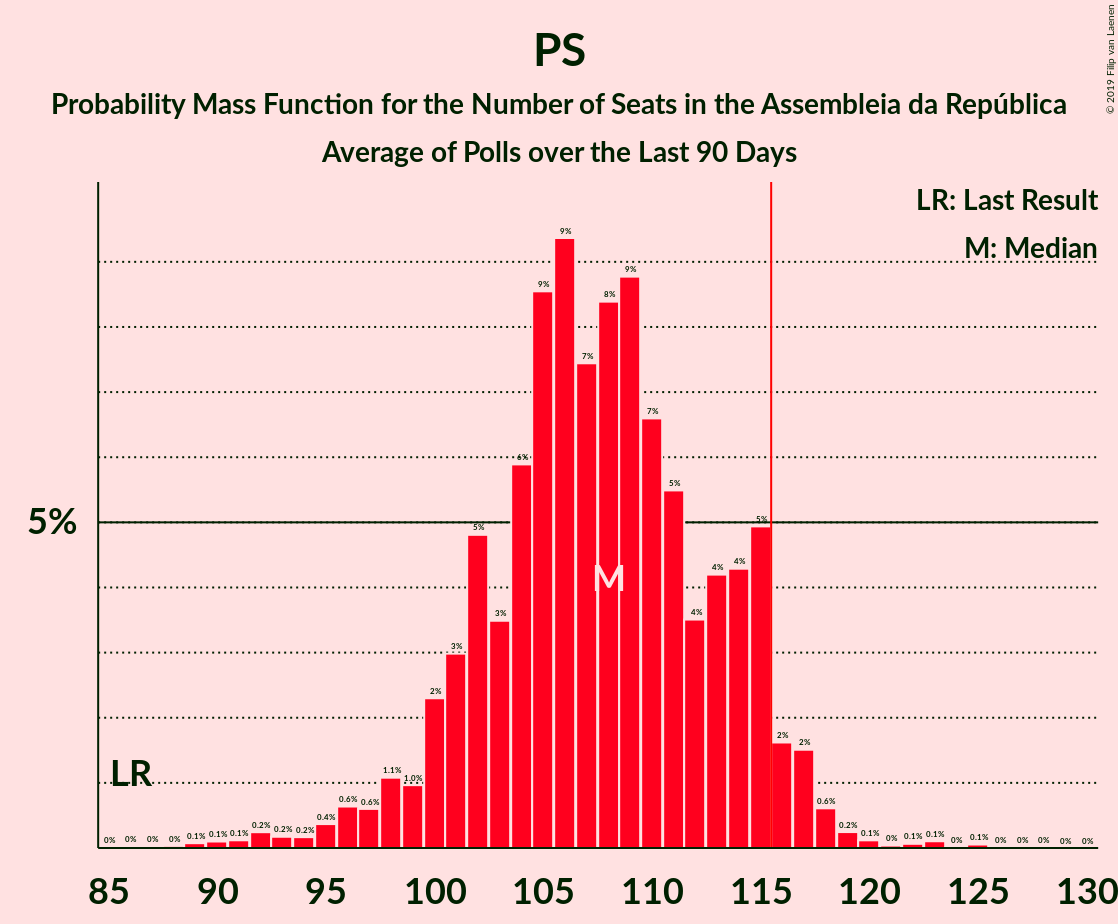
| Number of Seats | Probability | Accumulated | Special Marks |
|---|---|---|---|
| 86 | 0% | 100% | Last Result |
| 87 | 0% | 100% | |
| 88 | 0% | 99.9% | |
| 89 | 0.1% | 99.9% | |
| 90 | 0.1% | 99.8% | |
| 91 | 0.1% | 99.7% | |
| 92 | 0.2% | 99.6% | |
| 93 | 0.2% | 99.4% | |
| 94 | 0.2% | 99.2% | |
| 95 | 0.4% | 99.0% | |
| 96 | 0.6% | 98.7% | |
| 97 | 0.6% | 98% | |
| 98 | 1.1% | 97% | |
| 99 | 1.0% | 96% | |
| 100 | 2% | 95% | |
| 101 | 3% | 93% | |
| 102 | 5% | 90% | |
| 103 | 3% | 85% | |
| 104 | 6% | 82% | |
| 105 | 9% | 76% | |
| 106 | 9% | 67% | |
| 107 | 7% | 58% | |
| 108 | 8% | 51% | Median |
| 109 | 9% | 42% | |
| 110 | 7% | 33% | |
| 111 | 5% | 27% | |
| 112 | 4% | 21% | |
| 113 | 4% | 18% | |
| 114 | 4% | 14% | |
| 115 | 5% | 9% | |
| 116 | 2% | 4% | Majority |
| 117 | 2% | 3% | |
| 118 | 0.6% | 1.3% | |
| 119 | 0.2% | 0.6% | |
| 120 | 0.1% | 0.4% | |
| 121 | 0% | 0.3% | |
| 122 | 0.1% | 0.2% | |
| 123 | 0.1% | 0.2% | |
| 124 | 0% | 0.1% | |
| 125 | 0.1% | 0.1% | |
| 126 | 0% | 0% |
CDS–Partido Popular – Partido Social Democrata
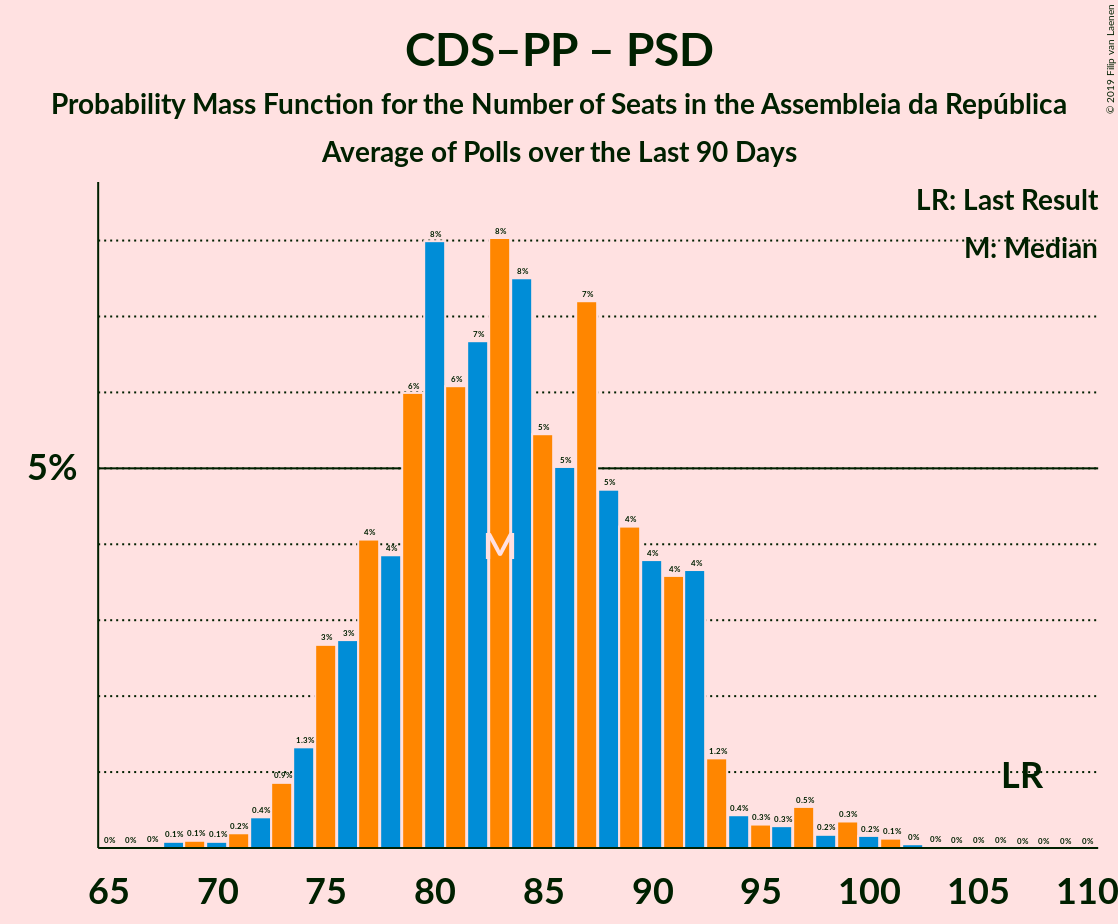
| Number of Seats | Probability | Accumulated | Special Marks |
|---|---|---|---|
| 68 | 0.1% | 100% | |
| 69 | 0.1% | 99.9% | |
| 70 | 0.1% | 99.8% | |
| 71 | 0.2% | 99.7% | |
| 72 | 0.4% | 99.5% | |
| 73 | 0.9% | 99.1% | |
| 74 | 1.3% | 98% | |
| 75 | 3% | 97% | |
| 76 | 3% | 94% | |
| 77 | 4% | 92% | |
| 78 | 4% | 87% | |
| 79 | 6% | 84% | |
| 80 | 8% | 78% | |
| 81 | 6% | 70% | |
| 82 | 7% | 64% | |
| 83 | 8% | 57% | Median |
| 84 | 8% | 49% | |
| 85 | 5% | 41% | |
| 86 | 5% | 36% | |
| 87 | 7% | 31% | |
| 88 | 5% | 24% | |
| 89 | 4% | 19% | |
| 90 | 4% | 15% | |
| 91 | 4% | 11% | |
| 92 | 4% | 7% | |
| 93 | 1.2% | 4% | |
| 94 | 0.4% | 2% | |
| 95 | 0.3% | 2% | |
| 96 | 0.3% | 2% | |
| 97 | 0.5% | 1.4% | |
| 98 | 0.2% | 0.9% | |
| 99 | 0.3% | 0.7% | |
| 100 | 0.2% | 0.4% | |
| 101 | 0.1% | 0.2% | |
| 102 | 0% | 0.1% | |
| 103 | 0% | 0% | |
| 104 | 0% | 0% | |
| 105 | 0% | 0% | |
| 106 | 0% | 0% | |
| 107 | 0% | 0% | Last Result |
Technical Information
- Number of polls included in this average: 6
- Lowest number of simulations done in a poll included in this average: 1,048,576
- Total number of simulations done in the polls included in this average: 6,291,456
- Error estimate: 3.76%