Poll Average
Voting Intentions | Seats | Coalitions | Technical Information
Summary
The table below lists the polls on which the average is based. They are the most recent polls (less than 90 days old) registered and analyzed so far.
| Period | Polling firm/Commissioner(s) | SNP | CON | LAB | GRN | LIB | ALBA | UKIP | REF | SSP | AFU |
|---|---|---|---|---|---|---|---|---|---|---|---|
| 5 May 2016 | General Election | 41.7% 63 |
22.9% 31 |
19.1% 24 |
6.6% 6 |
5.2% 5 |
0.0% 0 |
2.0% 0 |
0.0% 0 |
0.5% 0 |
0.0% 0 |
| N/A | Poll Average | 33–43% 54–69 |
20–25% 24–34 |
14–21% 17–27 |
7–14% 6–16 |
4–9% 2–10 |
2–5% 0–1 |
N/A N/A |
1–3% 0 |
N/A N/A |
1–3% 0 |
| 2–4 May 2021 | YouGov The Times |
35–41% 57–69 |
20–25% 24–33 |
14–18% 16–24 |
11–15% 12–20 |
4–7% 2–6 |
2–4% 0 |
N/A N/A |
1–2% 0 |
N/A N/A |
N/A N/A |
| 4 May 2021 | Survation The Courier |
33–39% 54–67 |
19–24% 21–31 |
17–22% 20–28 |
8–12% 10–14 |
6–9% 5–10 |
2–4% 0 |
N/A N/A |
N/A N/A |
N/A N/A |
N/A N/A |
| 30 April–4 May 2021 | Savanta ComRes The Scotsman |
31–37% 51–61 |
20–26% 26–35 |
17–22% 22–30 |
7–11% 8–13 |
5–8% 5–9 |
1–3% 0 |
N/A N/A |
N/A N/A |
N/A N/A |
N/A N/A |
| 3 May 2021 | Opinium Sky News |
38–44% 60–70 |
20–26% 25–33 |
15–19% 17–25 |
6–10% 5–11 |
5–8% 4–8 |
2–4% 0 |
N/A N/A |
N/A N/A |
N/A N/A |
N/A N/A |
| 3 May 2021 | Ipsos MORI STV News |
37–42% 59–68 |
21–25% 25–33 |
16–20% 18–25 |
10–14% 11–15 |
3–5% 2–5 |
1–3% 0 |
N/A N/A |
N/A N/A |
N/A N/A |
N/A N/A |
| 28–30 April 2021 | Panelbase The Sunday Times |
36–42% 60–69 |
20–25% 25–33 |
14–18% 17–24 |
7–10% 5–11 |
6–9% 5–10 |
3–5% 0–4 |
N/A N/A |
N/A N/A |
N/A N/A |
1–3% 0 |
| 27–30 April 2021 | BMG Research The Herald |
34–40% 55–68 |
20–25% 24–33 |
15–19% 17–25 |
7–11% 8–12 |
6–10% 6–12 |
3–5% 0–3 |
N/A N/A |
N/A N/A |
N/A N/A |
N/A N/A |
| 7–19 April 2021 | Lord Ashcroft | 40–44% 63–69 |
20–24% 26–32 |
14–18% 17–22 |
8–10% 10–11 |
6–8% 5–8 |
1–3% 0 |
N/A N/A |
1–3% 0 |
N/A N/A |
N/A N/A |
| 5 May 2016 | General Election | 41.7% 63 |
22.9% 31 |
19.1% 24 |
6.6% 6 |
5.2% 5 |
0.0% 0 |
2.0% 0 |
0.0% 0 |
0.5% 0 |
0.0% 0 |
Only polls for which at least the sample size has been published are included in the table above.
Legend:
- Top half of each row: Voting intentions (95% confidence interval)
- Bottom half of each row: Seat projections for the Scottish Parliament (95% confidence interval)
- SNP: Scottish National Party
- CON: Scottish Conservative & Unionist Party
- LAB: Scottish Labour
- GRN: Scottish Greens
- LIB: Scottish Liberal Democrats
- ALBA: Alba Party
- UKIP: UK Independence Party
- REF: Reform UK
- SSP: Scottish Socialist Party
- AFU: All For Unity
- N/A (single party): Party not included the published results
- N/A (entire row): Calculation for this opinion poll not started yet
Voting Intentions

Confidence Intervals
| Party | Last Result | Median | 80% Confidence Interval | 90% Confidence Interval | 95% Confidence Interval | 99% Confidence Interval |
|---|---|---|---|---|---|---|
| Scottish National Party | 41.7% | 38.4% | 34.4–42.0% | 33.4–42.7% | 32.7–43.3% | 31.4–44.2% |
| Scottish Conservative & Unionist Party | 22.9% | 22.3% | 20.5–24.1% | 20.0–24.6% | 19.6–25.0% | 18.7–26.0% |
| Scottish Labour | 19.1% | 17.2% | 15.3–19.6% | 14.8–20.2% | 14.5–20.7% | 13.7–21.7% |
| Scottish Greens | 6.6% | 9.4% | 7.7–12.8% | 7.3–13.5% | 7.0–14.0% | 6.4–15.0% |
| Scottish Liberal Democrats | 5.2% | 6.5% | 4.3–8.1% | 3.9–8.5% | 3.6–8.9% | 3.2–9.7% |
| UK Independence Party | 2.0% | N/A | N/A | N/A | N/A | N/A |
| Scottish Socialist Party | 0.5% | N/A | N/A | N/A | N/A | N/A |
| Alba Party | 0.0% | 2.8% | 1.8–4.3% | 1.7–4.6% | 1.5–4.9% | 1.3–5.4% |
| Reform UK | 0.0% | 1.6% | 0.8–2.3% | 0.7–2.4% | 0.6–2.6% | 0.5–2.8% |
| All For Unity | 0.0% | 2.1% | 1.6–2.7% | 1.4–2.9% | 1.3–3.0% | 1.2–3.4% |
Scottish National Party
For a full overview of the results for this party, see the Scottish National Party page.
| Voting Intentions | Probability | Accumulated | Special Marks |
|---|---|---|---|
| 28.5–29.5% | 0% | 100% | |
| 29.5–30.5% | 0.1% | 100% | |
| 30.5–31.5% | 0.5% | 99.9% | |
| 31.5–32.5% | 2% | 99.4% | |
| 32.5–33.5% | 3% | 98% | |
| 33.5–34.5% | 5% | 95% | |
| 34.5–35.5% | 7% | 89% | |
| 35.5–36.5% | 10% | 82% | |
| 36.5–37.5% | 12% | 72% | |
| 37.5–38.5% | 13% | 61% | Median |
| 38.5–39.5% | 13% | 47% | |
| 39.5–40.5% | 11% | 34% | |
| 40.5–41.5% | 9% | 23% | |
| 41.5–42.5% | 8% | 14% | Last Result |
| 42.5–43.5% | 4% | 6% | |
| 43.5–44.5% | 1.4% | 2% | |
| 44.5–45.5% | 0.2% | 0.3% | |
| 45.5–46.5% | 0% | 0% |
Scottish Conservative & Unionist Party
For a full overview of the results for this party, see the Scottish Conservative & Unionist Party page.
| Voting Intentions | Probability | Accumulated | Special Marks |
|---|---|---|---|
| 16.5–17.5% | 0% | 100% | |
| 17.5–18.5% | 0.3% | 100% | |
| 18.5–19.5% | 2% | 99.6% | |
| 19.5–20.5% | 8% | 98% | |
| 20.5–21.5% | 19% | 90% | |
| 21.5–22.5% | 28% | 71% | Median |
| 22.5–23.5% | 24% | 42% | Last Result |
| 23.5–24.5% | 13% | 18% | |
| 24.5–25.5% | 4% | 5% | |
| 25.5–26.5% | 0.9% | 1.1% | |
| 26.5–27.5% | 0.1% | 0.1% | |
| 27.5–28.5% | 0% | 0% |
Scottish Labour
For a full overview of the results for this party, see the Scottish Labour page.
| Voting Intentions | Probability | Accumulated | Special Marks |
|---|---|---|---|
| 11.5–12.5% | 0% | 100% | |
| 12.5–13.5% | 0.3% | 100% | |
| 13.5–14.5% | 3% | 99.7% | |
| 14.5–15.5% | 11% | 97% | |
| 15.5–16.5% | 21% | 86% | |
| 16.5–17.5% | 22% | 64% | Median |
| 17.5–18.5% | 19% | 42% | |
| 18.5–19.5% | 13% | 23% | Last Result |
| 19.5–20.5% | 7% | 10% | |
| 20.5–21.5% | 3% | 3% | |
| 21.5–22.5% | 0.6% | 0.7% | |
| 22.5–23.5% | 0.1% | 0.1% | |
| 23.5–24.5% | 0% | 0% |
Scottish Greens
For a full overview of the results for this party, see the Scottish Greens page.
| Voting Intentions | Probability | Accumulated | Special Marks |
|---|---|---|---|
| 4.5–5.5% | 0% | 100% | |
| 5.5–6.5% | 0.7% | 100% | |
| 6.5–7.5% | 7% | 99.3% | Last Result |
| 7.5–8.5% | 21% | 92% | |
| 8.5–9.5% | 27% | 72% | Median |
| 9.5–10.5% | 15% | 45% | |
| 10.5–11.5% | 9% | 30% | |
| 11.5–12.5% | 9% | 21% | |
| 12.5–13.5% | 7% | 12% | |
| 13.5–14.5% | 3% | 4% | |
| 14.5–15.5% | 0.9% | 1.1% | |
| 15.5–16.5% | 0.1% | 0.2% | |
| 16.5–17.5% | 0% | 0% |
Scottish Liberal Democrats
For a full overview of the results for this party, see the Scottish Liberal Democrats page.
| Voting Intentions | Probability | Accumulated | Special Marks |
|---|---|---|---|
| 1.5–2.5% | 0% | 100% | |
| 2.5–3.5% | 2% | 100% | |
| 3.5–4.5% | 12% | 98% | |
| 4.5–5.5% | 15% | 86% | Last Result |
| 5.5–6.5% | 24% | 72% | Median |
| 6.5–7.5% | 28% | 48% | |
| 7.5–8.5% | 15% | 19% | |
| 8.5–9.5% | 4% | 5% | |
| 9.5–10.5% | 0.6% | 0.7% | |
| 10.5–11.5% | 0% | 0% | |
| 11.5–12.5% | 0% | 0% |
Alba Party
For a full overview of the results for this party, see the Alba Party page.
| Voting Intentions | Probability | Accumulated | Special Marks |
|---|---|---|---|
| 0.0–0.5% | 0% | 100% | Last Result |
| 0.5–1.5% | 3% | 100% | |
| 1.5–2.5% | 37% | 97% | |
| 2.5–3.5% | 33% | 60% | Median |
| 3.5–4.5% | 21% | 27% | |
| 4.5–5.5% | 5% | 6% | |
| 5.5–6.5% | 0.3% | 0.4% | |
| 6.5–7.5% | 0% | 0% |
Reform UK
For a full overview of the results for this party, see the Reform UK page.
| Voting Intentions | Probability | Accumulated | Special Marks |
|---|---|---|---|
| 0.0–0.5% | 1.2% | 100% | Last Result |
| 0.5–1.5% | 47% | 98.8% | |
| 1.5–2.5% | 49% | 52% | Median |
| 2.5–3.5% | 3% | 3% | |
| 3.5–4.5% | 0% | 0% |
All For Unity
For a full overview of the results for this party, see the All For Unity page.
| Voting Intentions | Probability | Accumulated | Special Marks |
|---|---|---|---|
| 0.0–0.5% | 0% | 100% | Last Result |
| 0.5–1.5% | 10% | 100% | |
| 1.5–2.5% | 76% | 90% | Median |
| 2.5–3.5% | 15% | 15% | |
| 3.5–4.5% | 0.2% | 0.2% | |
| 4.5–5.5% | 0% | 0% |
Seats
Confidence Intervals
| Party | Last Result | Median | 80% Confidence Interval | 90% Confidence Interval | 95% Confidence Interval | 99% Confidence Interval |
|---|---|---|---|---|---|---|
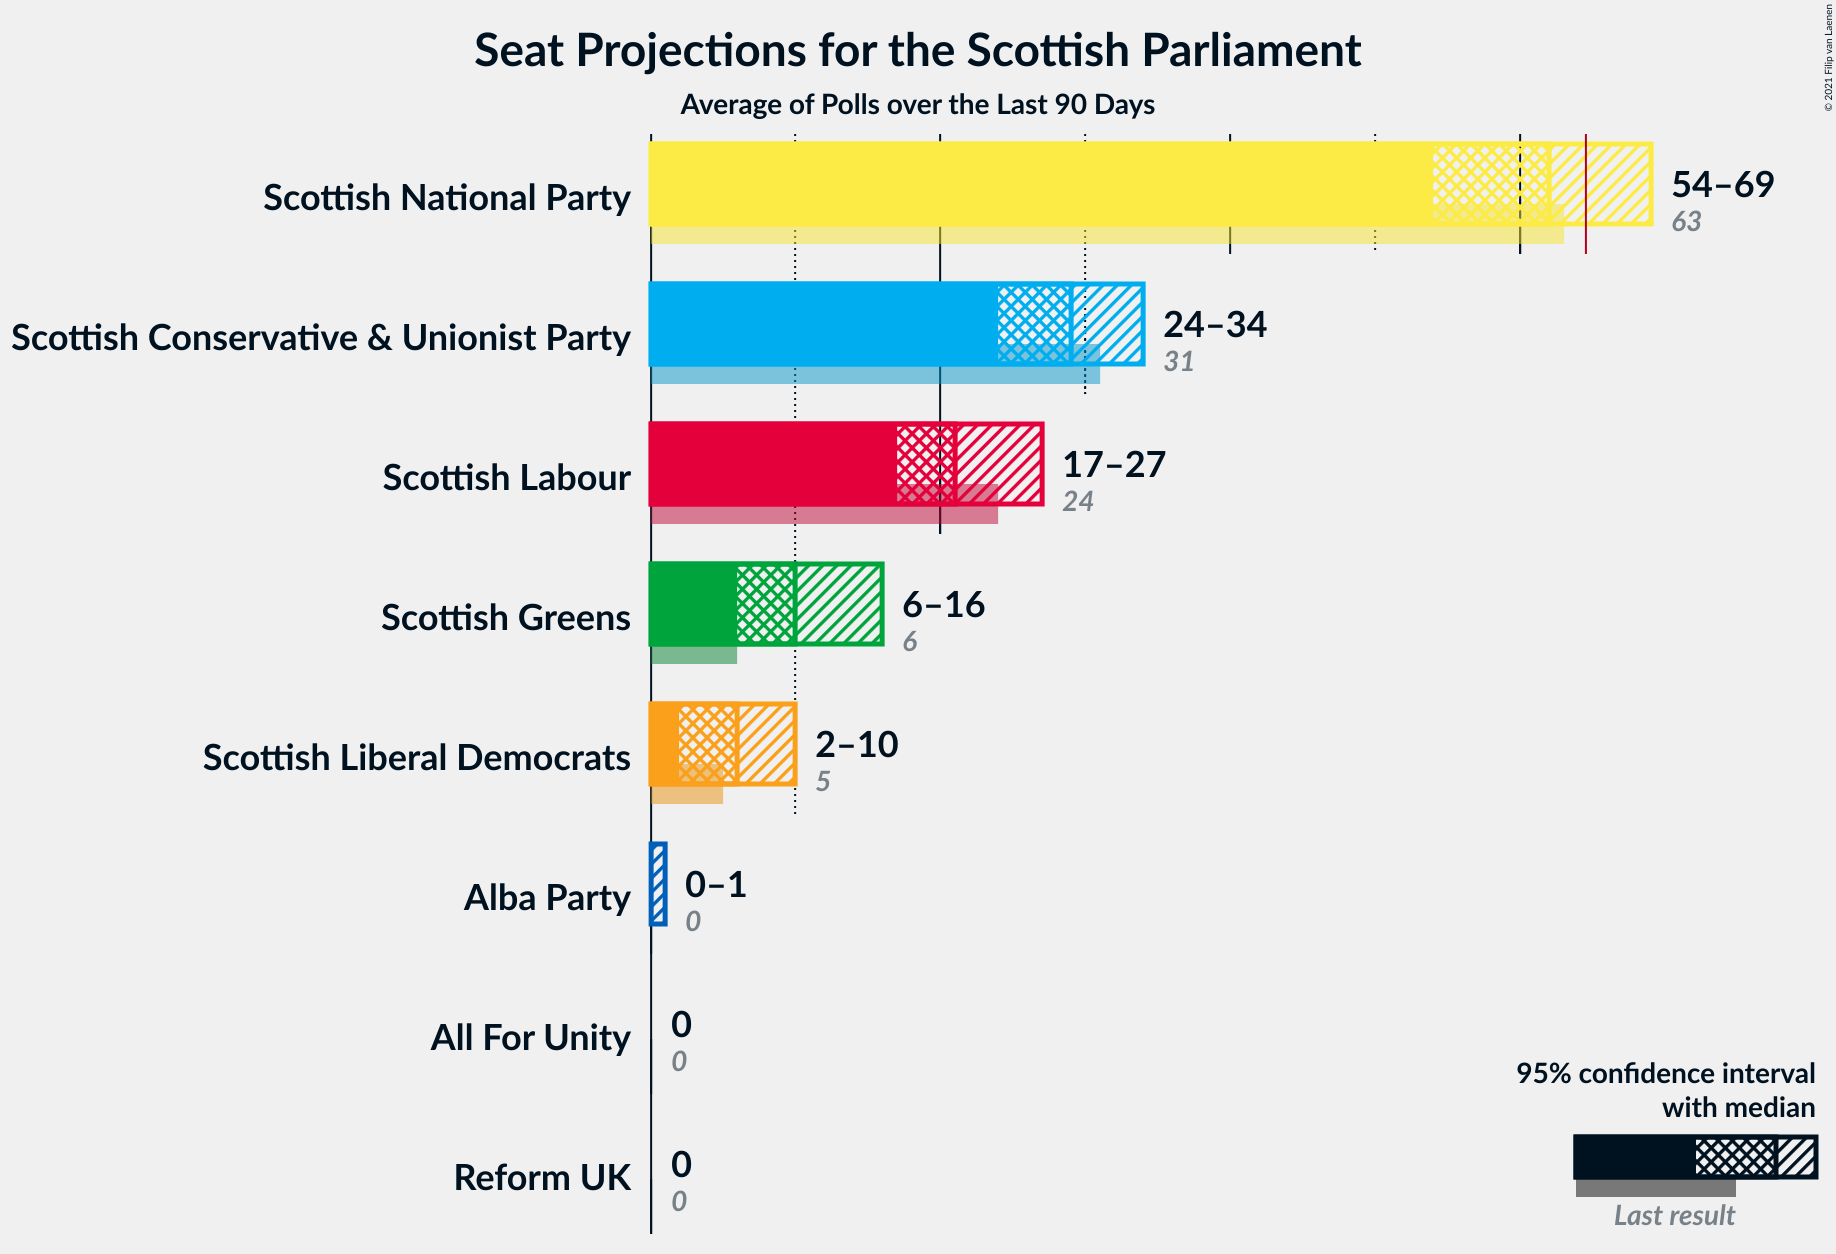
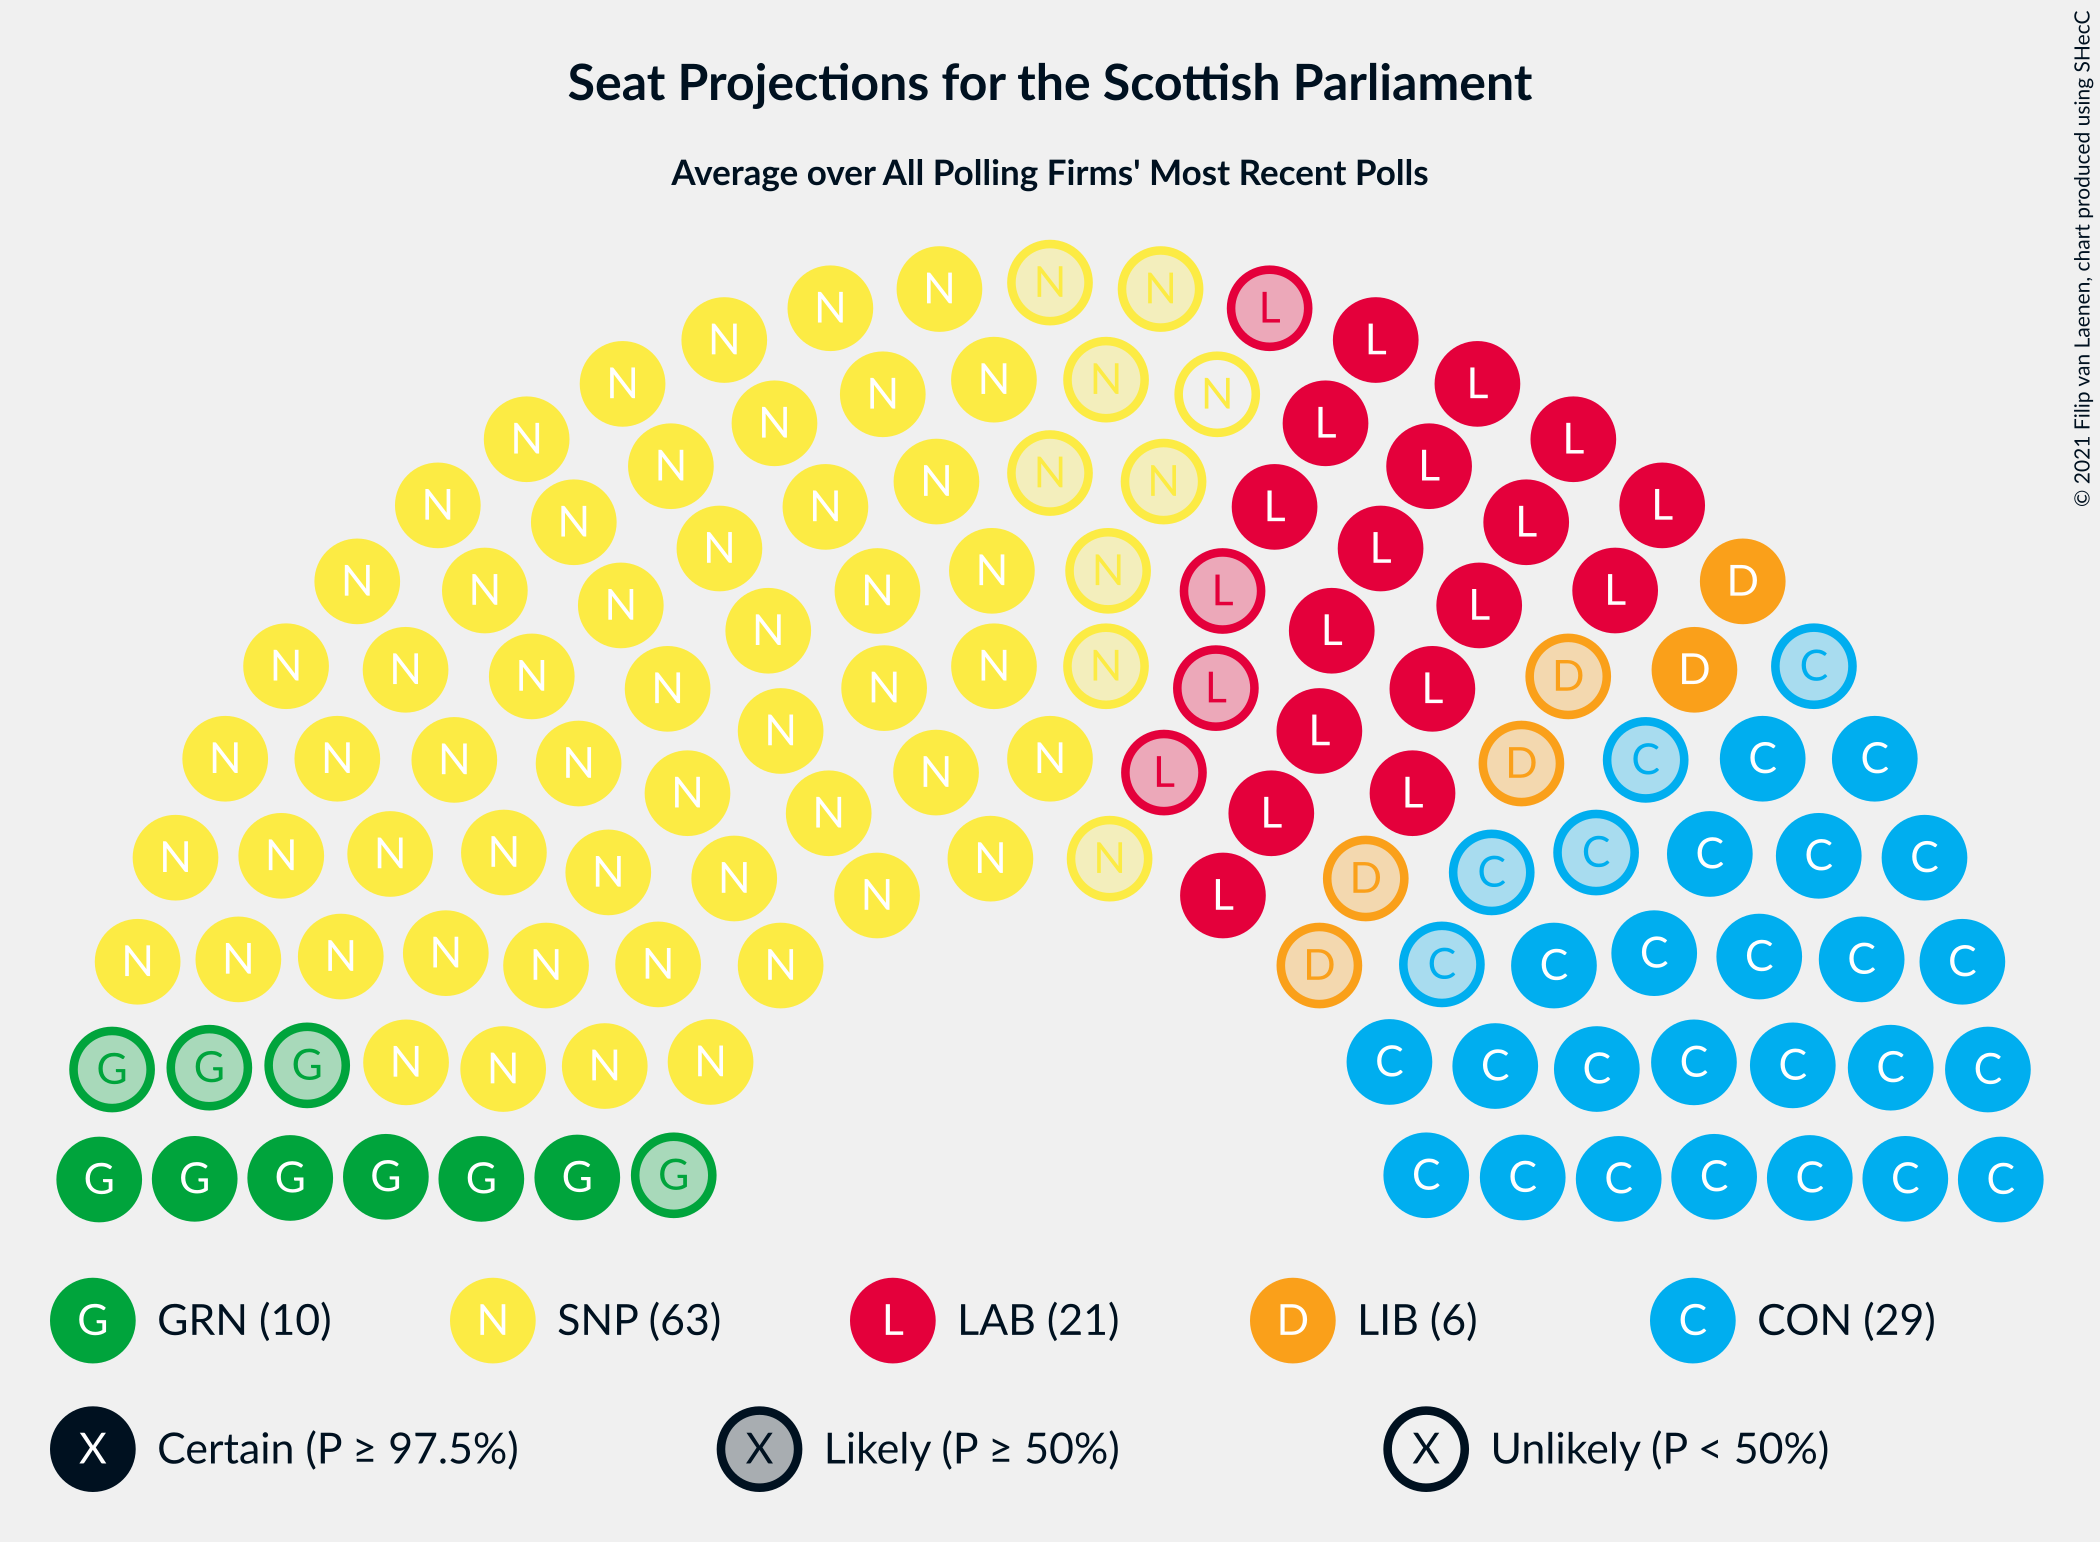
| Scottish National Party | 63 | 62 | 58–67 | 55–68 | 54–69 | 52–70 |
| Scottish Conservative & Unionist Party | 31 | 29 | 25–32 | 24–33 | 24–34 | 22–35 |
| Scottish Labour | 24 | 21 | 17–25 | 17–26 | 17–27 | 16–29 |
| Scottish Greens | 6 | 10 | 10–14 | 8–15 | 6–16 | 5–19 |
| Scottish Liberal Democrats | 5 | 6 | 4–8 | 3–10 | 2–10 | 2–12 |
| UK Independence Party | 0 | N/A | N/A | N/A | N/A | N/A |
| Scottish Socialist Party | 0 | N/A | N/A | N/A | N/A | N/A |
| Alba Party | 0 | 0 | 0 | 0 | 0–1 | 0–4 |
| Reform UK | 0 | 0 | 0 | 0 | 0 | 0 |
| All For Unity | 0 | 0 | 0 | 0 | 0 | 0 |
Scottish National Party
For a full overview of the results for this party, see the Scottish National Party page.
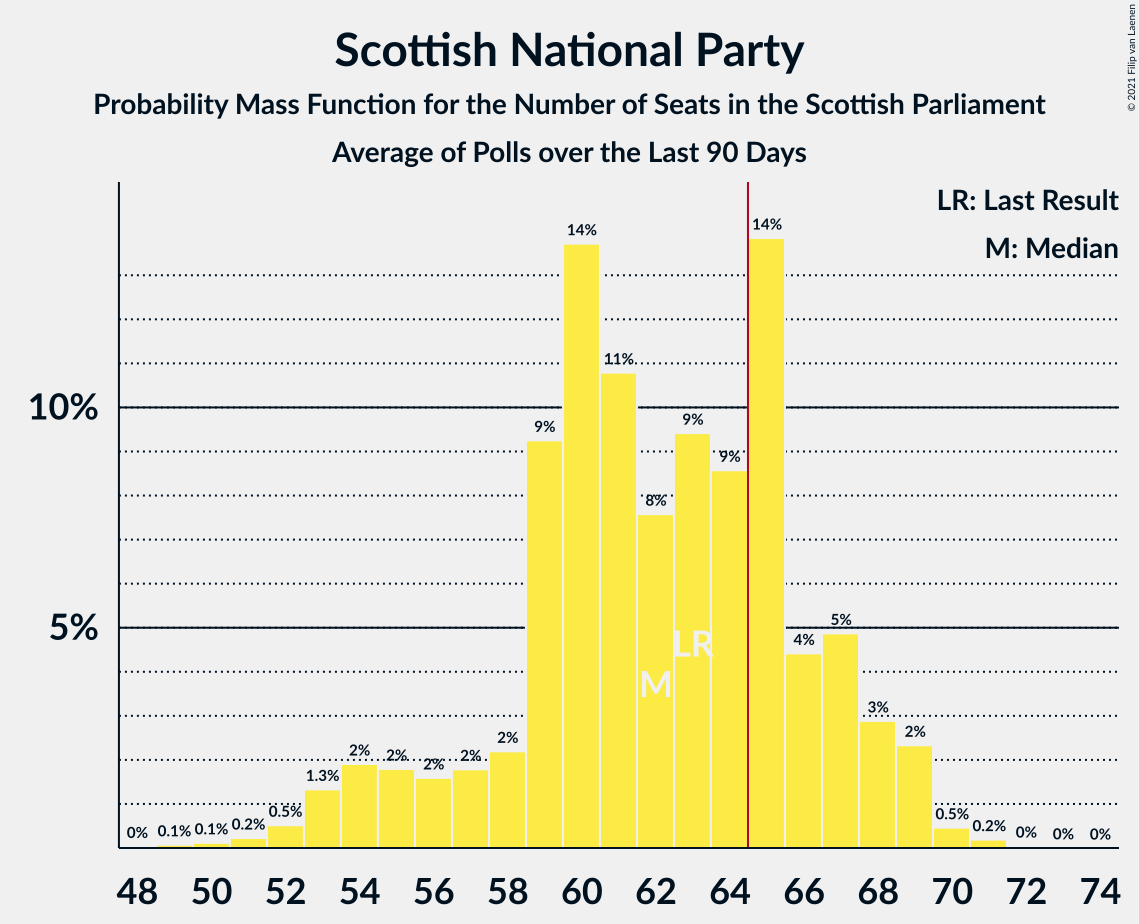
| Number of Seats | Probability | Accumulated | Special Marks |
|---|---|---|---|
| 48 | 0% | 100% | |
| 49 | 0.1% | 99.9% | |
| 50 | 0.1% | 99.9% | |
| 51 | 0.2% | 99.7% | |
| 52 | 0.5% | 99.5% | |
| 53 | 1.3% | 99.0% | |
| 54 | 2% | 98% | |
| 55 | 2% | 96% | |
| 56 | 2% | 94% | |
| 57 | 2% | 92% | |
| 58 | 2% | 91% | |
| 59 | 9% | 88% | |
| 60 | 14% | 79% | |
| 61 | 11% | 65% | |
| 62 | 8% | 55% | Median |
| 63 | 9% | 47% | Last Result |
| 64 | 9% | 38% | |
| 65 | 14% | 29% | Majority |
| 66 | 4% | 15% | |
| 67 | 5% | 11% | |
| 68 | 3% | 6% | |
| 69 | 2% | 3% | |
| 70 | 0.5% | 0.7% | |
| 71 | 0.2% | 0.2% | |
| 72 | 0% | 0.1% | |
| 73 | 0% | 0% |
Scottish Conservative & Unionist Party
For a full overview of the results for this party, see the Scottish Conservative & Unionist Party page.
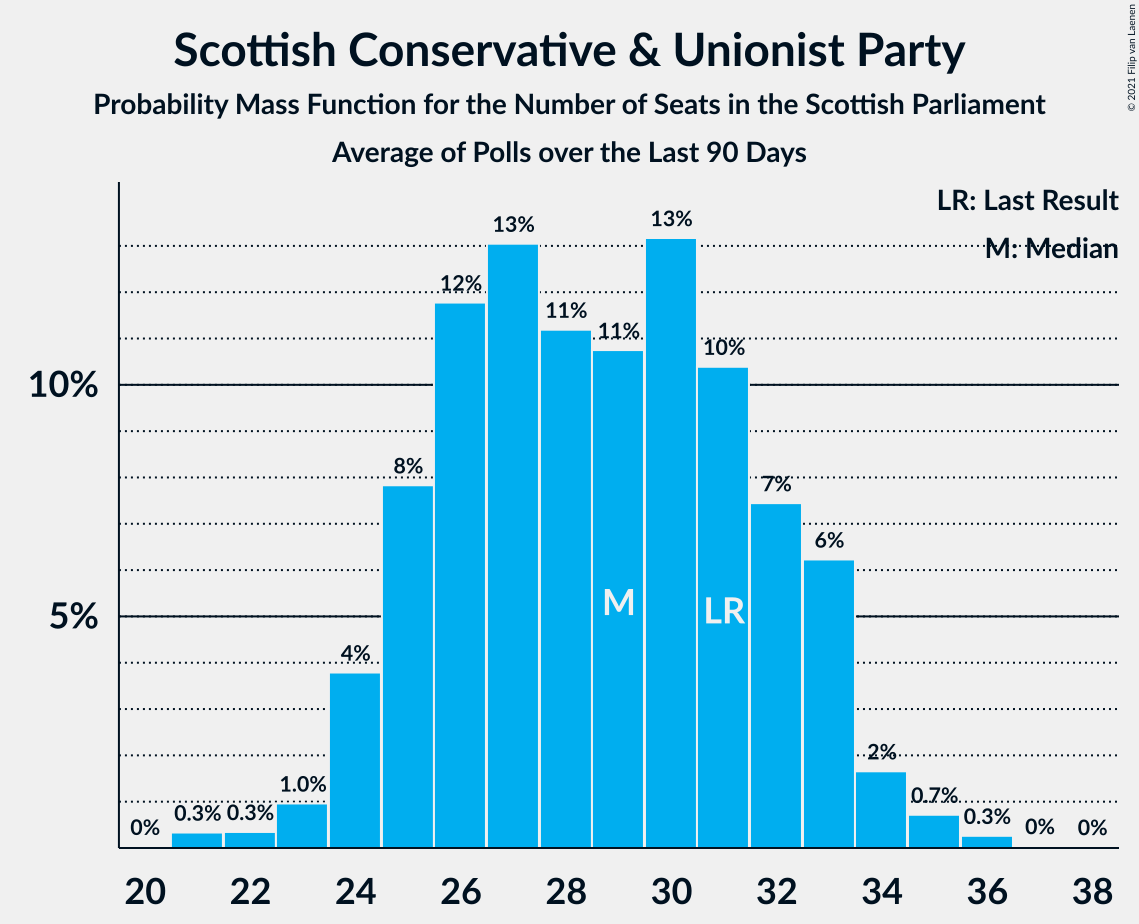
| Number of Seats | Probability | Accumulated | Special Marks |
|---|---|---|---|
| 21 | 0.3% | 100% | |
| 22 | 0.3% | 99.6% | |
| 23 | 1.0% | 99.3% | |
| 24 | 4% | 98% | |
| 25 | 8% | 95% | |
| 26 | 12% | 87% | |
| 27 | 13% | 75% | |
| 28 | 11% | 62% | |
| 29 | 11% | 51% | Median |
| 30 | 13% | 40% | |
| 31 | 10% | 27% | Last Result |
| 32 | 7% | 16% | |
| 33 | 6% | 9% | |
| 34 | 2% | 3% | |
| 35 | 0.7% | 1.1% | |
| 36 | 0.3% | 0.3% | |
| 37 | 0% | 0.1% | |
| 38 | 0% | 0% |
Scottish Labour
For a full overview of the results for this party, see the Scottish Labour page.
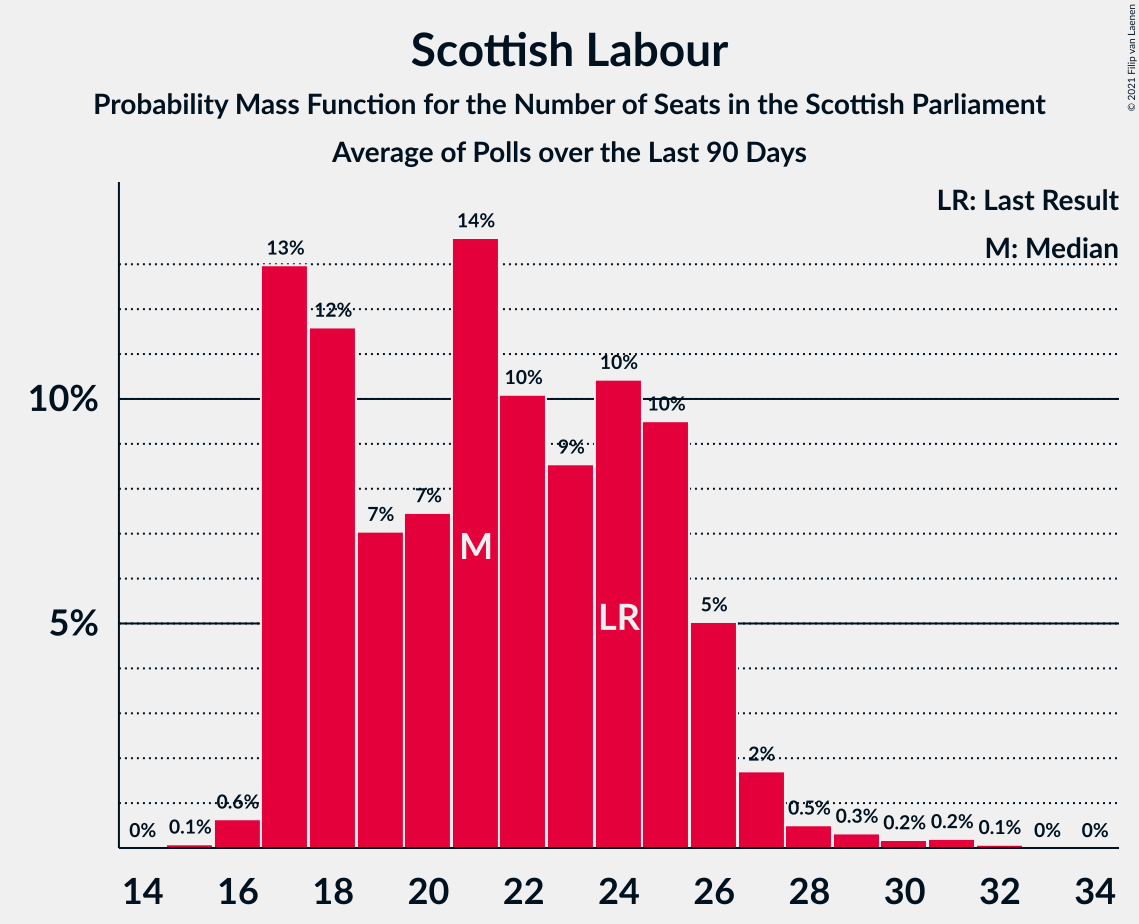
| Number of Seats | Probability | Accumulated | Special Marks |
|---|---|---|---|
| 15 | 0.1% | 100% | |
| 16 | 0.6% | 99.9% | |
| 17 | 13% | 99.3% | |
| 18 | 12% | 86% | |
| 19 | 7% | 75% | |
| 20 | 7% | 68% | |
| 21 | 14% | 60% | Median |
| 22 | 10% | 47% | |
| 23 | 9% | 37% | |
| 24 | 10% | 28% | Last Result |
| 25 | 10% | 18% | |
| 26 | 5% | 8% | |
| 27 | 2% | 3% | |
| 28 | 0.5% | 1.3% | |
| 29 | 0.3% | 0.8% | |
| 30 | 0.2% | 0.5% | |
| 31 | 0.2% | 0.3% | |
| 32 | 0.1% | 0.1% | |
| 33 | 0% | 0% |
Scottish Greens
For a full overview of the results for this party, see the Scottish Greens page.
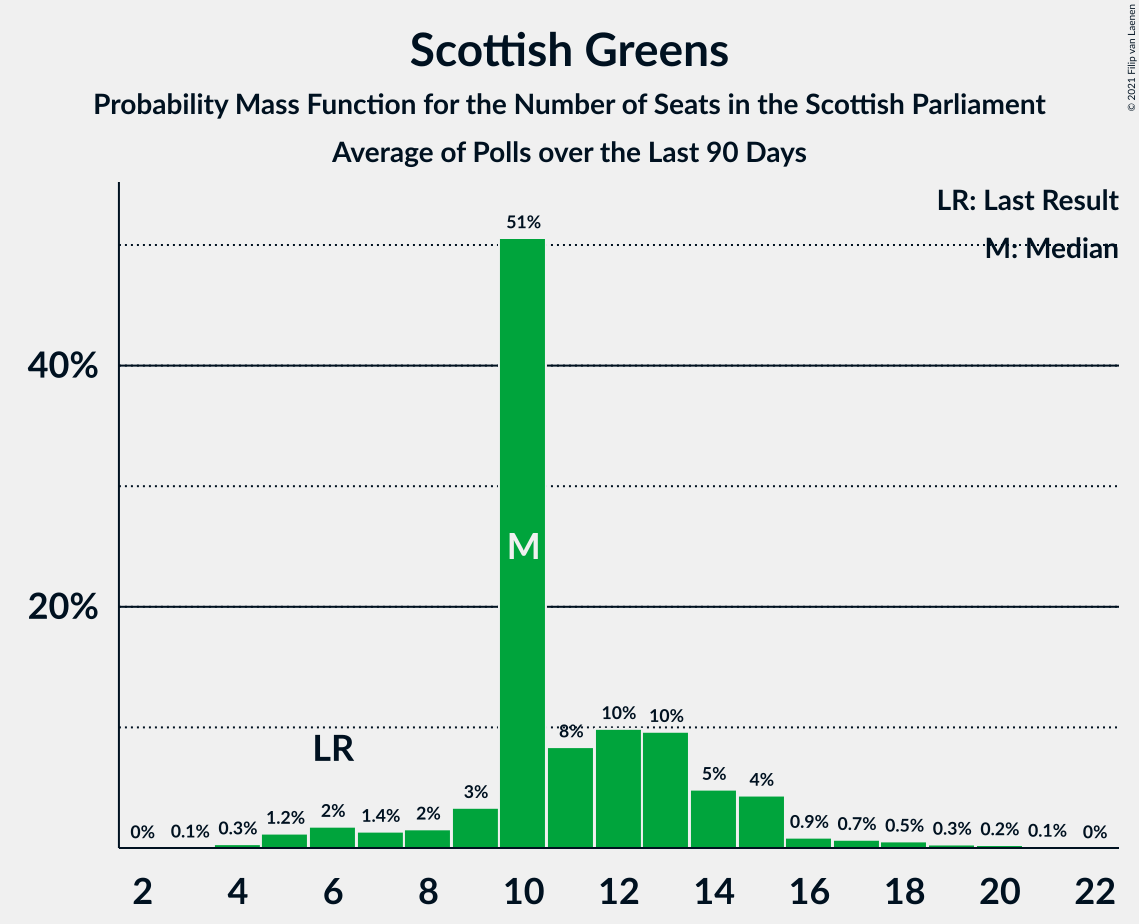
| Number of Seats | Probability | Accumulated | Special Marks |
|---|---|---|---|
| 3 | 0.1% | 100% | |
| 4 | 0.3% | 99.9% | |
| 5 | 1.2% | 99.6% | |
| 6 | 2% | 98% | Last Result |
| 7 | 1.4% | 97% | |
| 8 | 2% | 95% | |
| 9 | 3% | 94% | |
| 10 | 51% | 90% | Median |
| 11 | 8% | 40% | |
| 12 | 10% | 31% | |
| 13 | 10% | 22% | |
| 14 | 5% | 12% | |
| 15 | 4% | 7% | |
| 16 | 0.9% | 3% | |
| 17 | 0.7% | 2% | |
| 18 | 0.5% | 1.2% | |
| 19 | 0.3% | 0.7% | |
| 20 | 0.2% | 0.4% | |
| 21 | 0.1% | 0.1% | |
| 22 | 0% | 0% |
Scottish Liberal Democrats
For a full overview of the results for this party, see the Scottish Liberal Democrats page.
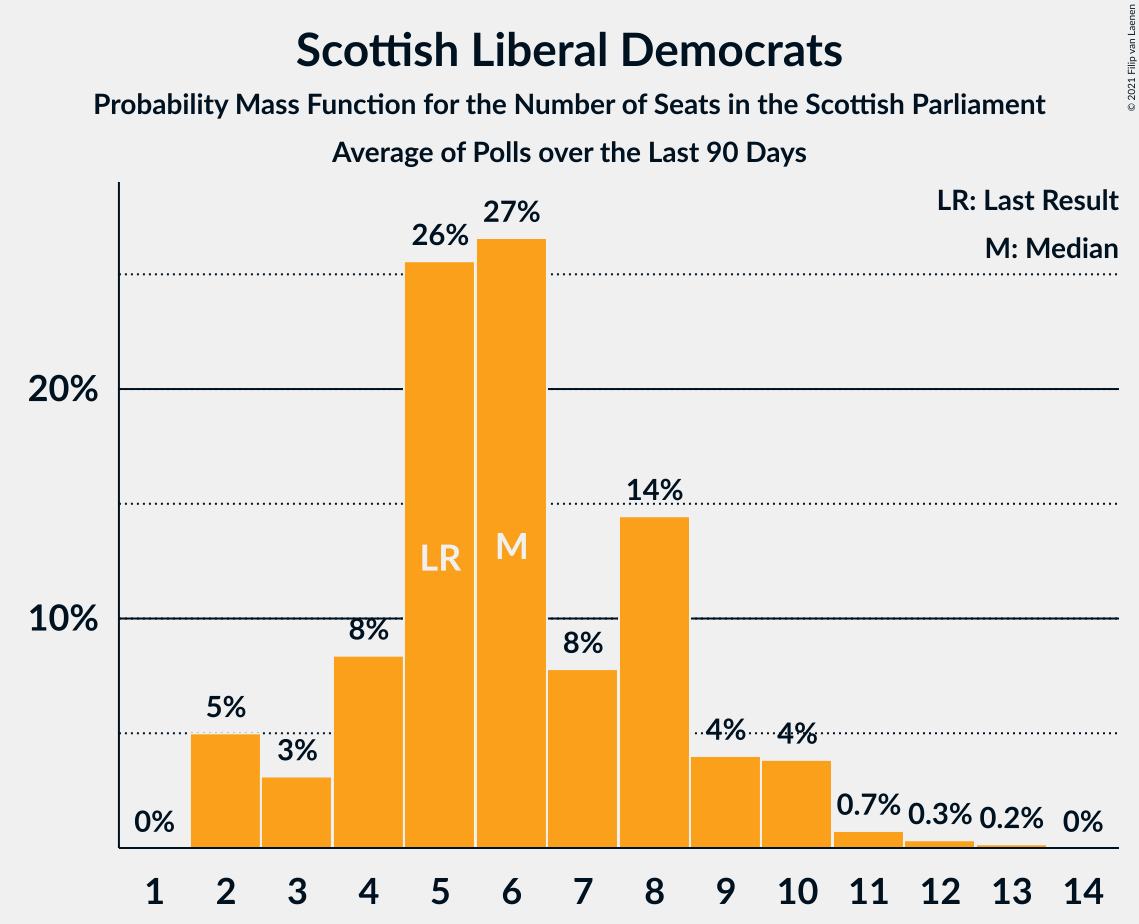
| Number of Seats | Probability | Accumulated | Special Marks |
|---|---|---|---|
| 2 | 5% | 100% | |
| 3 | 3% | 95% | |
| 4 | 8% | 92% | |
| 5 | 26% | 84% | Last Result |
| 6 | 27% | 58% | Median |
| 7 | 8% | 31% | |
| 8 | 14% | 24% | |
| 9 | 4% | 9% | |
| 10 | 4% | 5% | |
| 11 | 0.7% | 1.2% | |
| 12 | 0.3% | 0.5% | |
| 13 | 0.2% | 0.2% | |
| 14 | 0% | 0% |
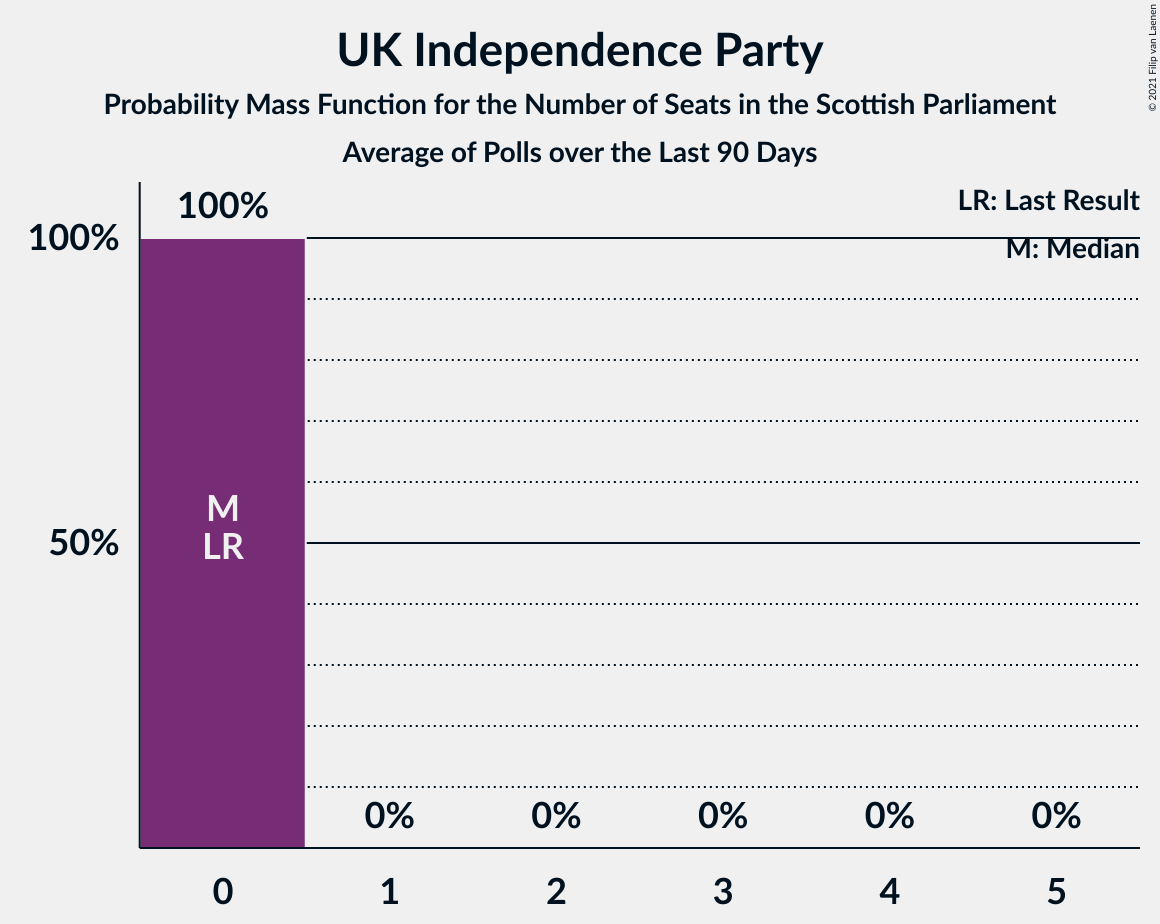
UK Independence Party
For a full overview of the results for this party, see the UK Independence Party page.
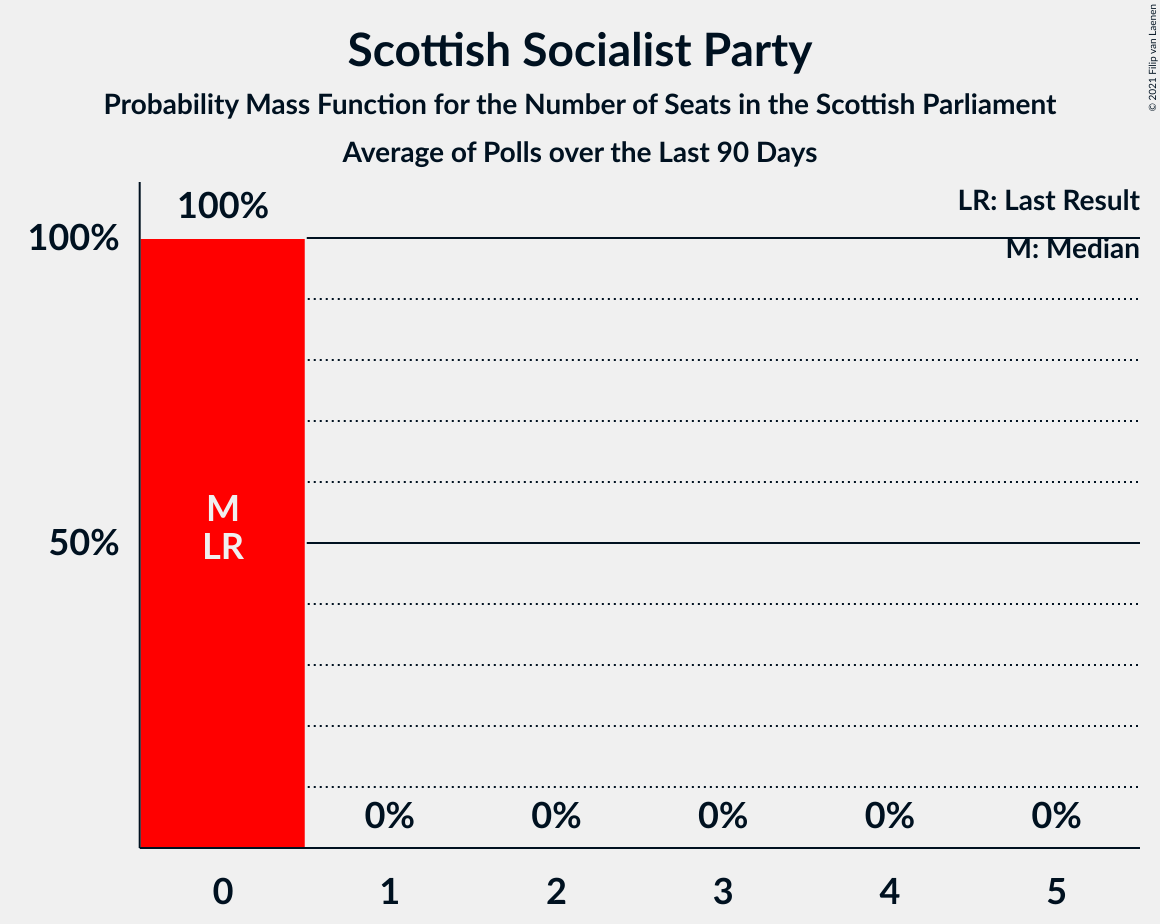
Scottish Socialist Party
For a full overview of the results for this party, see the Scottish Socialist Party page.
Alba Party
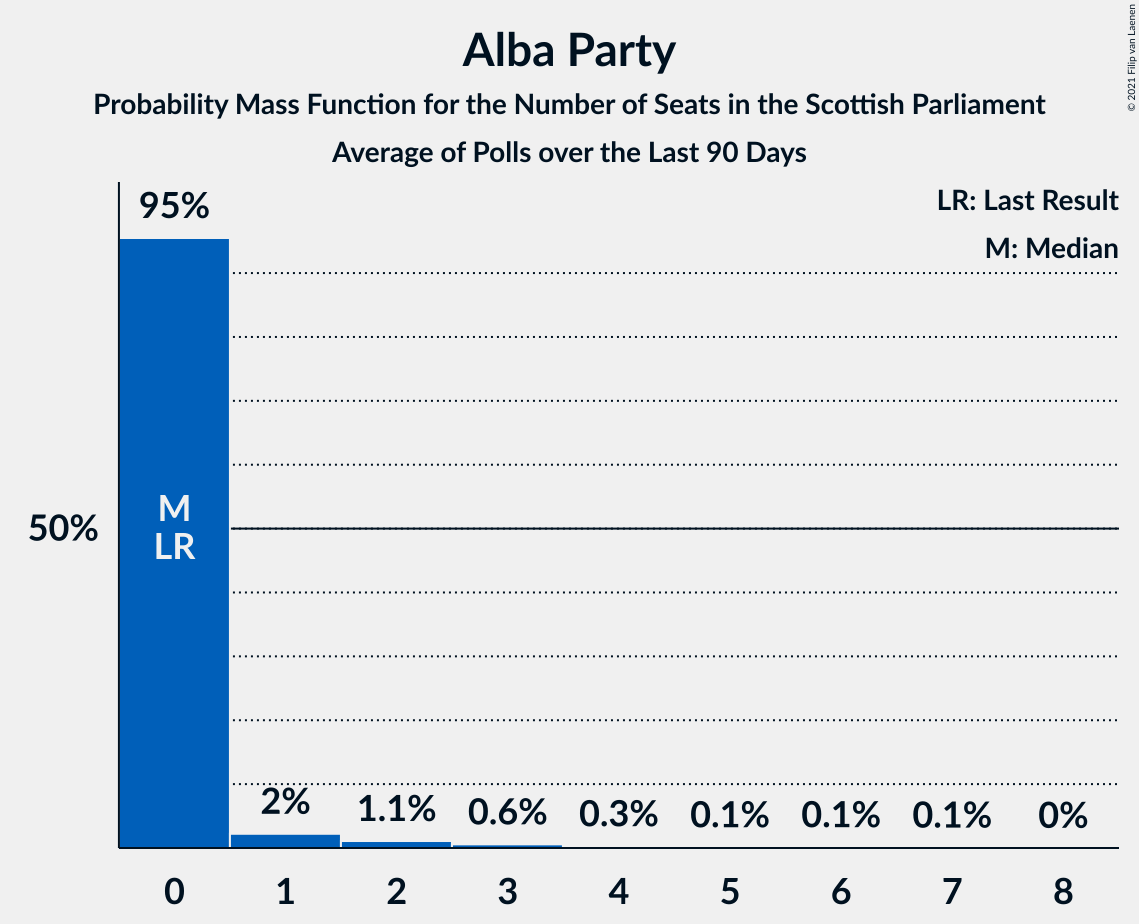
For a full overview of the results for this party, see the Alba Party page.
| Number of Seats | Probability | Accumulated | Special Marks |
|---|---|---|---|
| 0 | 95% | 100% | Last Result, Median |
| 1 | 2% | 5% | |
| 2 | 1.1% | 2% | |
| 3 | 0.6% | 1.2% | |
| 4 | 0.3% | 0.6% | |
| 5 | 0.1% | 0.3% | |
| 6 | 0.1% | 0.2% | |
| 7 | 0.1% | 0.1% | |
| 8 | 0% | 0% |
Reform UK
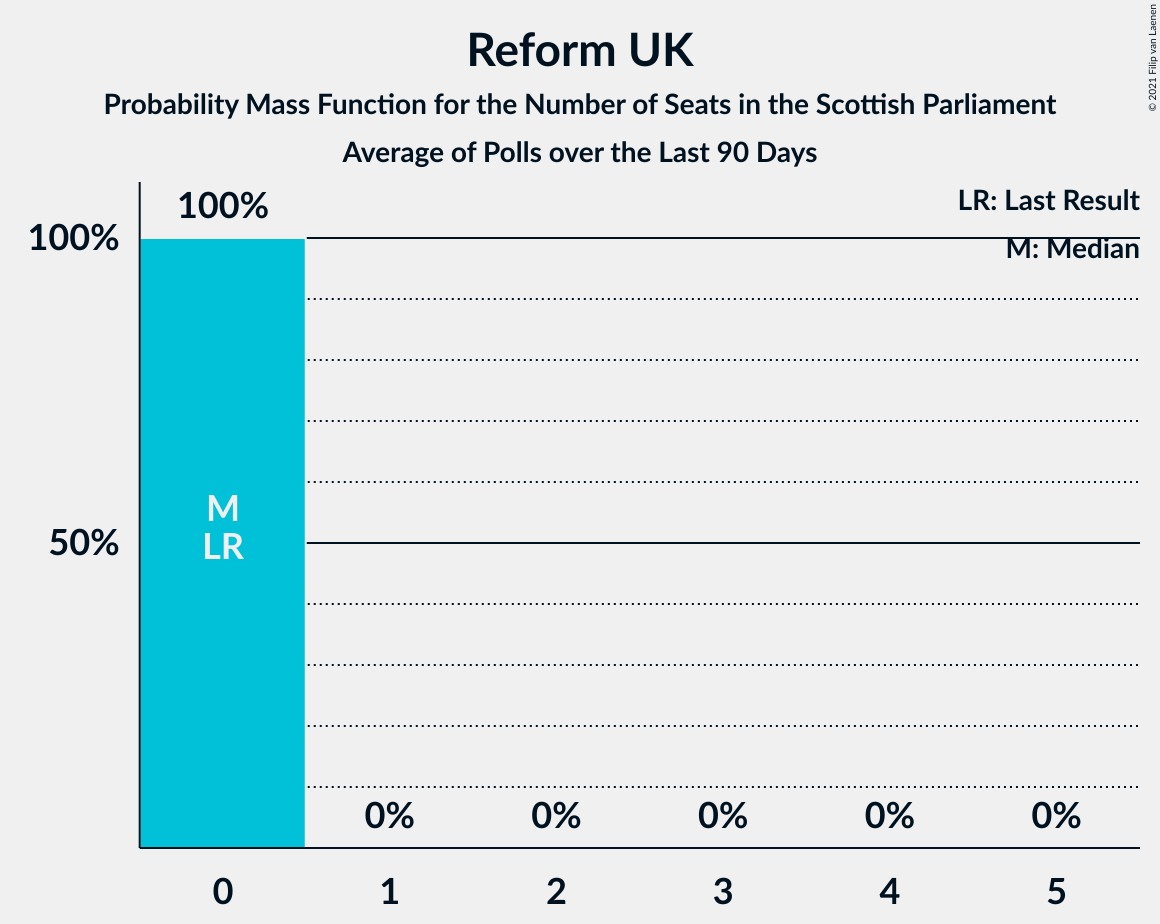
For a full overview of the results for this party, see the Reform UK page.
| Number of Seats | Probability | Accumulated | Special Marks |
|---|---|---|---|
| 0 | 100% | 100% | Last Result, Median |
All For Unity
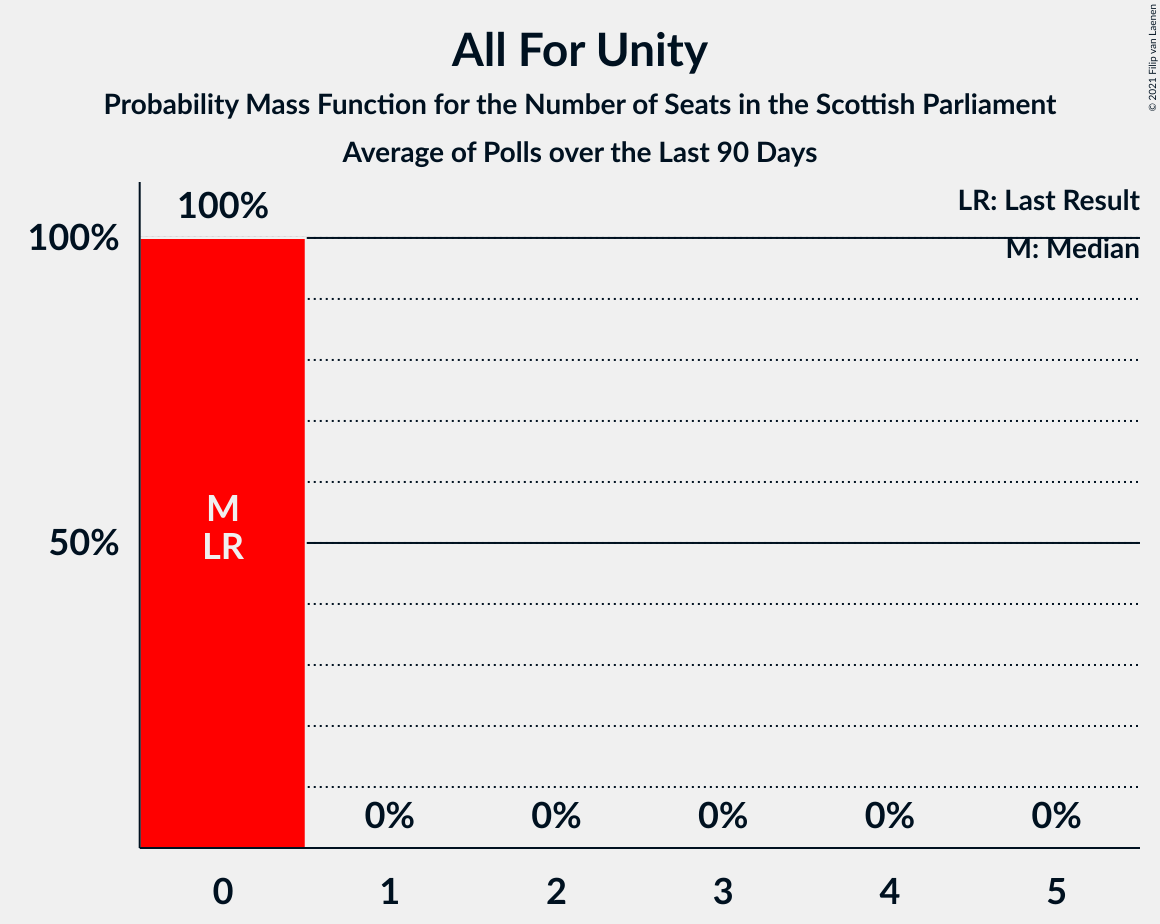
For a full overview of the results for this party, see the All For Unity page.
| Number of Seats | Probability | Accumulated | Special Marks |
|---|---|---|---|
| 0 | 100% | 100% | Last Result, Median |
Coalitions
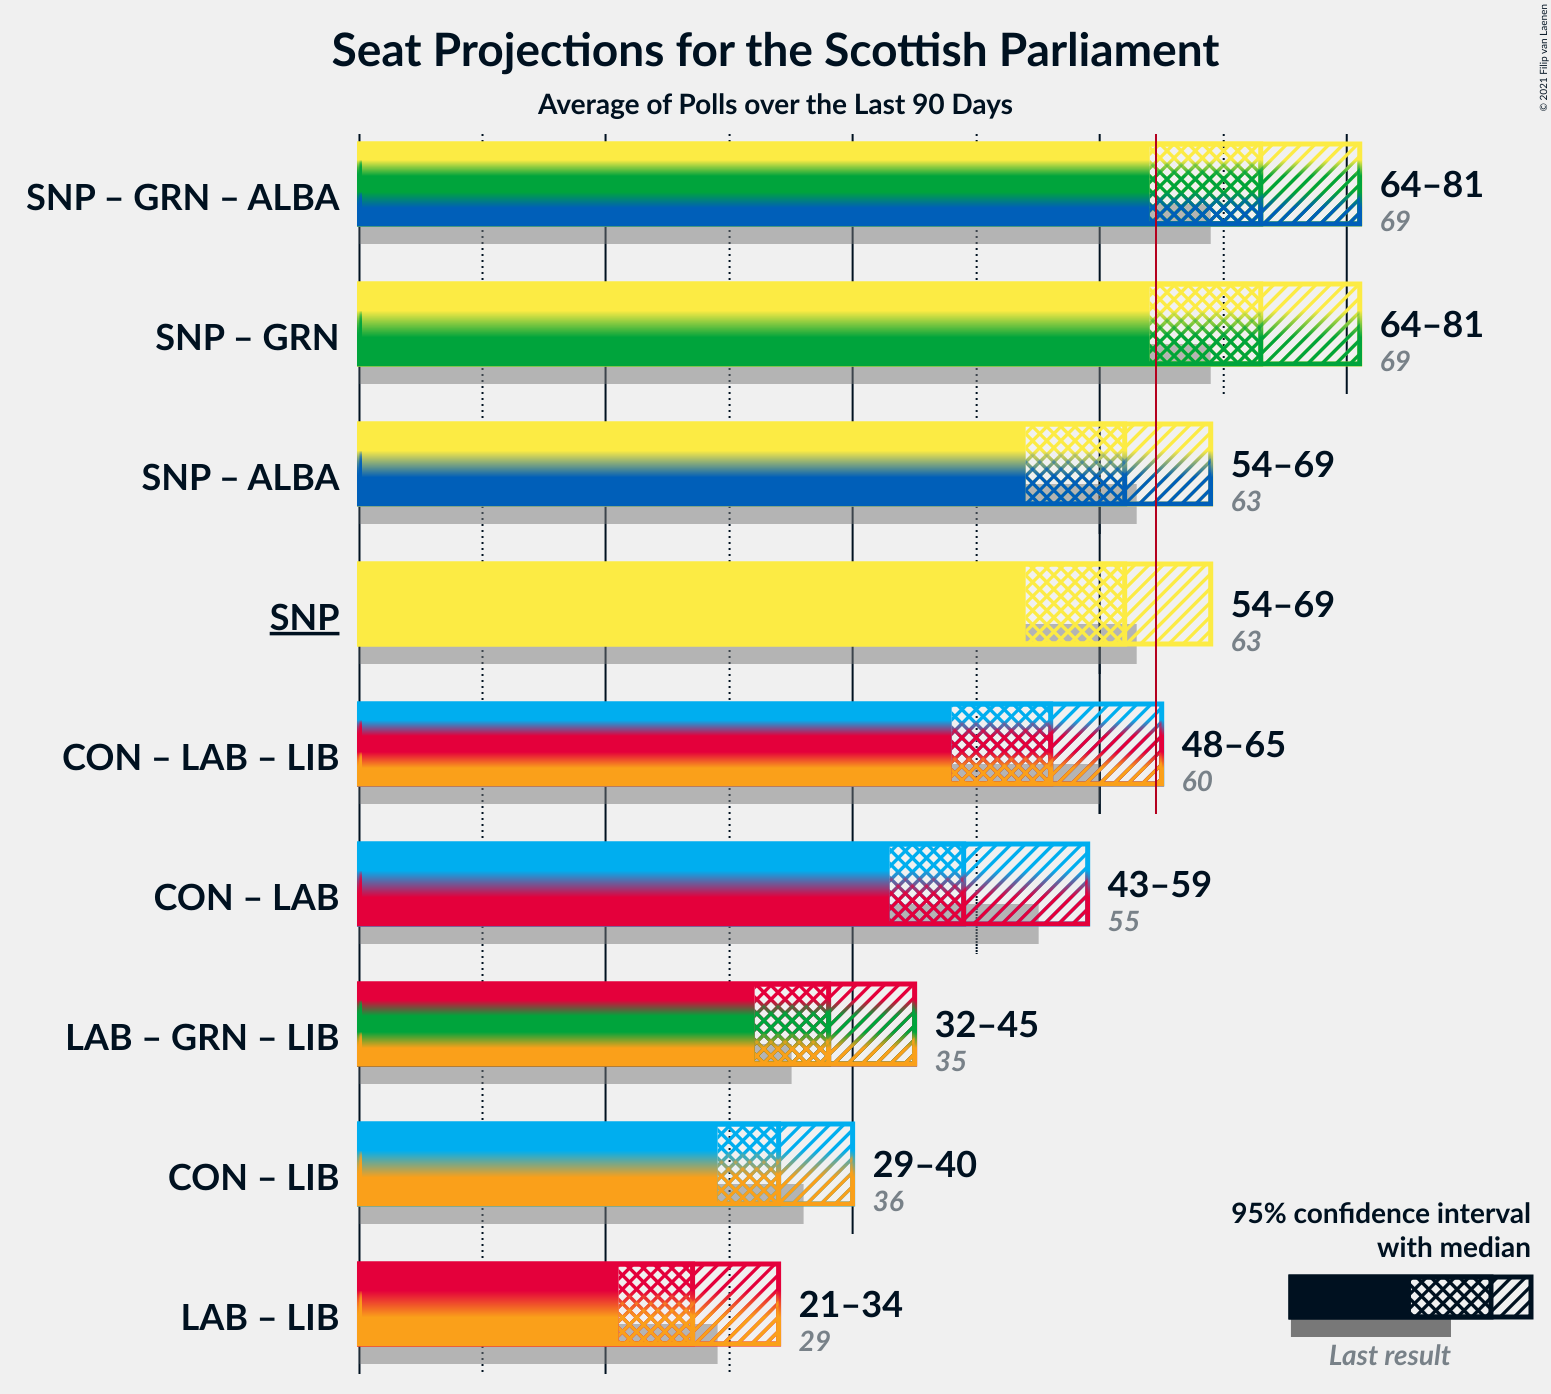
Confidence Intervals
| Coalition | Last Result | Median | Majority? | 80% Confidence Interval | 90% Confidence Interval | 95% Confidence Interval | 99% Confidence Interval |
|---|---|---|---|---|---|---|---|
| Scottish National Party – Scottish Greens – Alba Party | 69 | 73 | 97% | 68–78 | 66–79 | 64–81 | 62–83 |
| Scottish National Party – Scottish Greens | 69 | 73 | 97% | 68–78 | 65–79 | 64–81 | 62–82 |
| Scottish National Party – Alba Party | 63 | 62 | 30% | 58–67 | 55–68 | 54–69 | 52–70 |
| Scottish National Party | 63 | 62 | 29% | 58–67 | 55–68 | 54–69 | 52–70 |
| Scottish Conservative & Unionist Party – Scottish Labour – Scottish Liberal Democrats | 60 | 56 | 3% | 51–61 | 50–63 | 48–65 | 46–67 |
| Scottish Conservative & Unionist Party – Scottish Labour | 55 | 49 | 0% | 45–55 | 44–57 | 43–59 | 42–61 |
| Scottish Labour – Scottish Greens – Scottish Liberal Democrats | 35 | 38 | 0% | 33–43 | 33–44 | 32–45 | 31–47 |
| Scottish Conservative & Unionist Party – Scottish Liberal Democrats | 36 | 34 | 0% | 31–39 | 29–40 | 29–40 | 27–42 |
| Scottish Labour – Scottish Liberal Democrats | 29 | 27 | 0% | 23–32 | 22–33 | 21–34 | 19–36 |
Scottish National Party – Scottish Greens – Alba Party
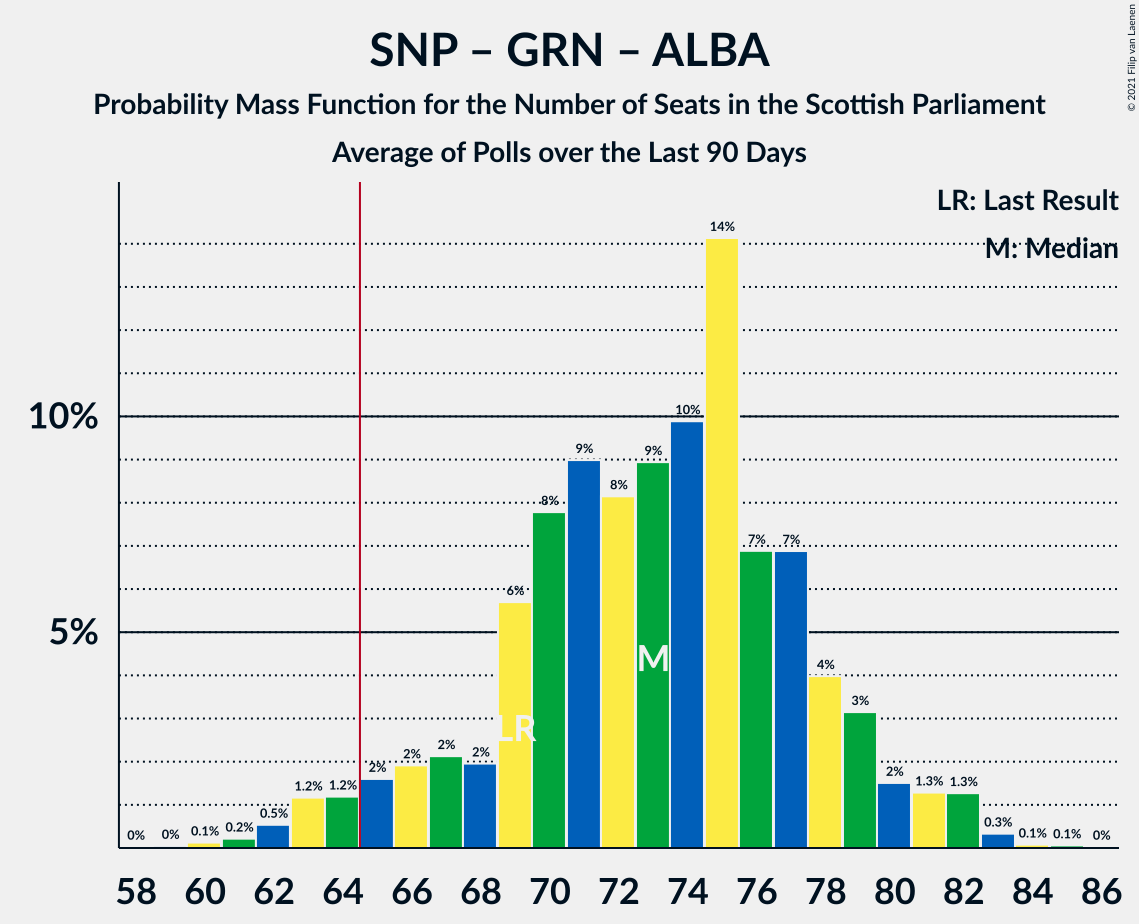
| Number of Seats | Probability | Accumulated | Special Marks |
|---|---|---|---|
| 58 | 0% | 100% | |
| 59 | 0% | 99.9% | |
| 60 | 0.1% | 99.9% | |
| 61 | 0.2% | 99.8% | |
| 62 | 0.5% | 99.6% | |
| 63 | 1.2% | 99.0% | |
| 64 | 1.2% | 98% | |
| 65 | 2% | 97% | Majority |
| 66 | 2% | 95% | |
| 67 | 2% | 93% | |
| 68 | 2% | 91% | |
| 69 | 6% | 89% | Last Result |
| 70 | 8% | 83% | |
| 71 | 9% | 76% | |
| 72 | 8% | 67% | Median |
| 73 | 9% | 58% | |
| 74 | 10% | 50% | |
| 75 | 14% | 40% | |
| 76 | 7% | 25% | |
| 77 | 7% | 19% | |
| 78 | 4% | 12% | |
| 79 | 3% | 8% | |
| 80 | 2% | 5% | |
| 81 | 1.3% | 3% | |
| 82 | 1.3% | 2% | |
| 83 | 0.3% | 0.5% | |
| 84 | 0.1% | 0.2% | |
| 85 | 0.1% | 0.1% | |
| 86 | 0% | 0% |
Scottish National Party – Scottish Greens
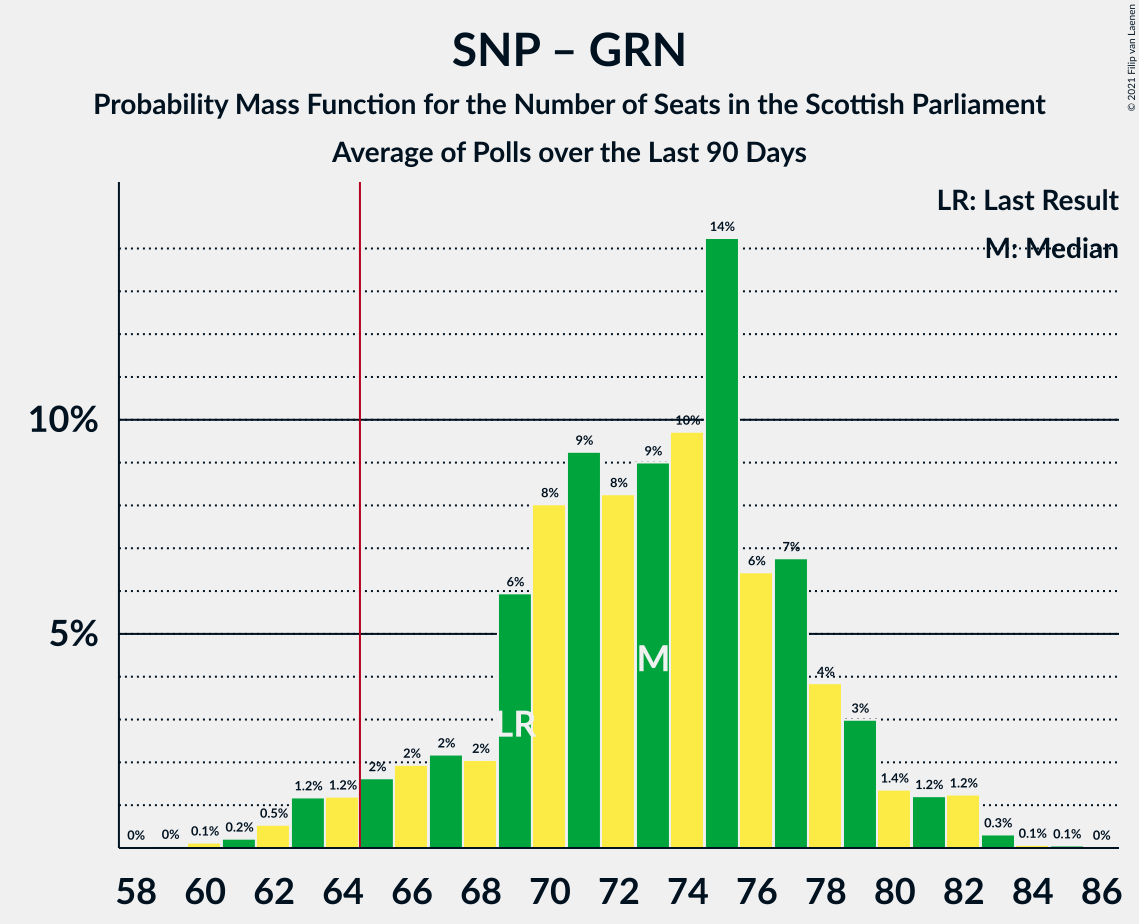
| Number of Seats | Probability | Accumulated | Special Marks |
|---|---|---|---|
| 58 | 0% | 100% | |
| 59 | 0% | 99.9% | |
| 60 | 0.1% | 99.9% | |
| 61 | 0.2% | 99.8% | |
| 62 | 0.5% | 99.6% | |
| 63 | 1.2% | 99.0% | |
| 64 | 1.2% | 98% | |
| 65 | 2% | 97% | Majority |
| 66 | 2% | 95% | |
| 67 | 2% | 93% | |
| 68 | 2% | 91% | |
| 69 | 6% | 89% | Last Result |
| 70 | 8% | 83% | |
| 71 | 9% | 75% | |
| 72 | 8% | 66% | Median |
| 73 | 9% | 57% | |
| 74 | 10% | 48% | |
| 75 | 14% | 39% | |
| 76 | 6% | 24% | |
| 77 | 7% | 18% | |
| 78 | 4% | 11% | |
| 79 | 3% | 7% | |
| 80 | 1.4% | 4% | |
| 81 | 1.2% | 3% | |
| 82 | 1.2% | 2% | |
| 83 | 0.3% | 0.5% | |
| 84 | 0.1% | 0.2% | |
| 85 | 0.1% | 0.1% | |
| 86 | 0% | 0% |
Scottish National Party – Alba Party
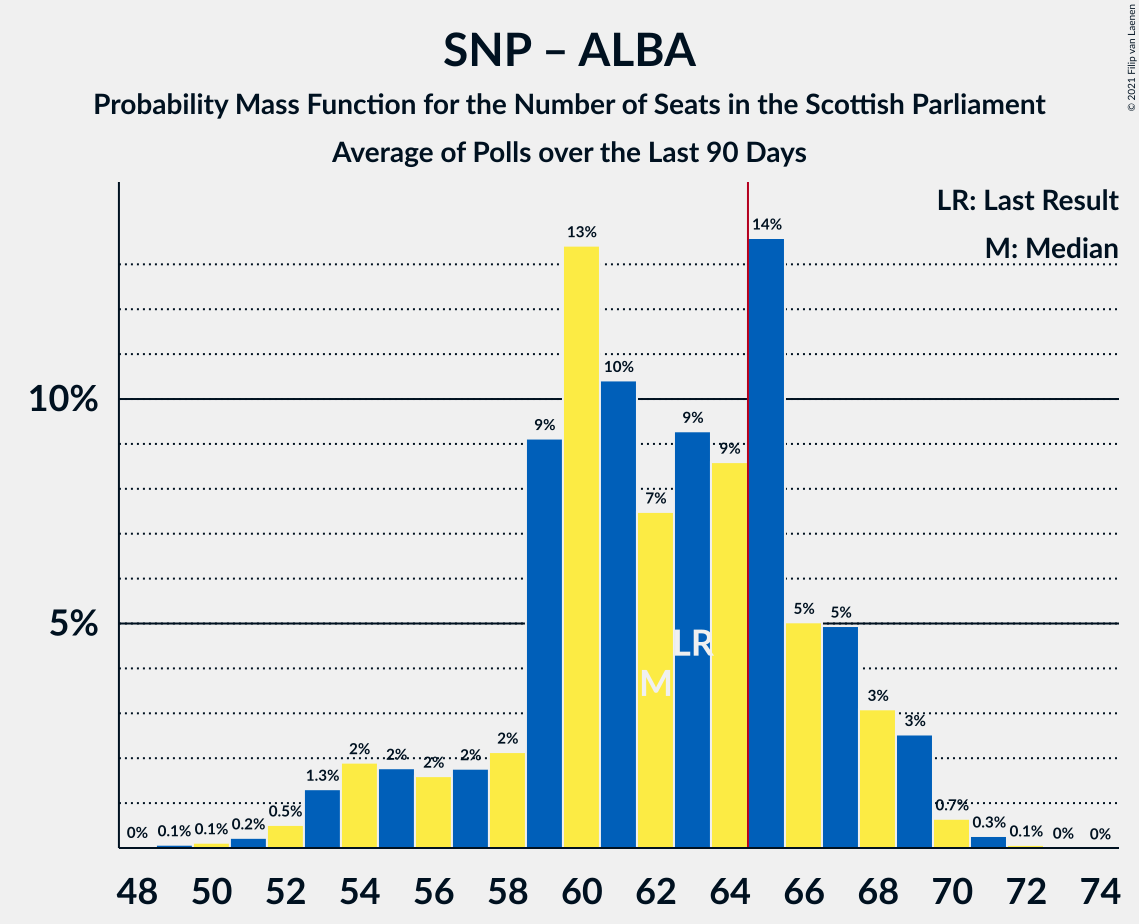
| Number of Seats | Probability | Accumulated | Special Marks |
|---|---|---|---|
| 48 | 0% | 100% | |
| 49 | 0.1% | 99.9% | |
| 50 | 0.1% | 99.9% | |
| 51 | 0.2% | 99.7% | |
| 52 | 0.5% | 99.5% | |
| 53 | 1.3% | 99.0% | |
| 54 | 2% | 98% | |
| 55 | 2% | 96% | |
| 56 | 2% | 94% | |
| 57 | 2% | 92% | |
| 58 | 2% | 91% | |
| 59 | 9% | 89% | |
| 60 | 13% | 79% | |
| 61 | 10% | 66% | |
| 62 | 7% | 56% | Median |
| 63 | 9% | 48% | Last Result |
| 64 | 9% | 39% | |
| 65 | 14% | 30% | Majority |
| 66 | 5% | 17% | |
| 67 | 5% | 12% | |
| 68 | 3% | 7% | |
| 69 | 3% | 4% | |
| 70 | 0.7% | 1.0% | |
| 71 | 0.3% | 0.4% | |
| 72 | 0.1% | 0.1% | |
| 73 | 0% | 0% |
Scottish National Party
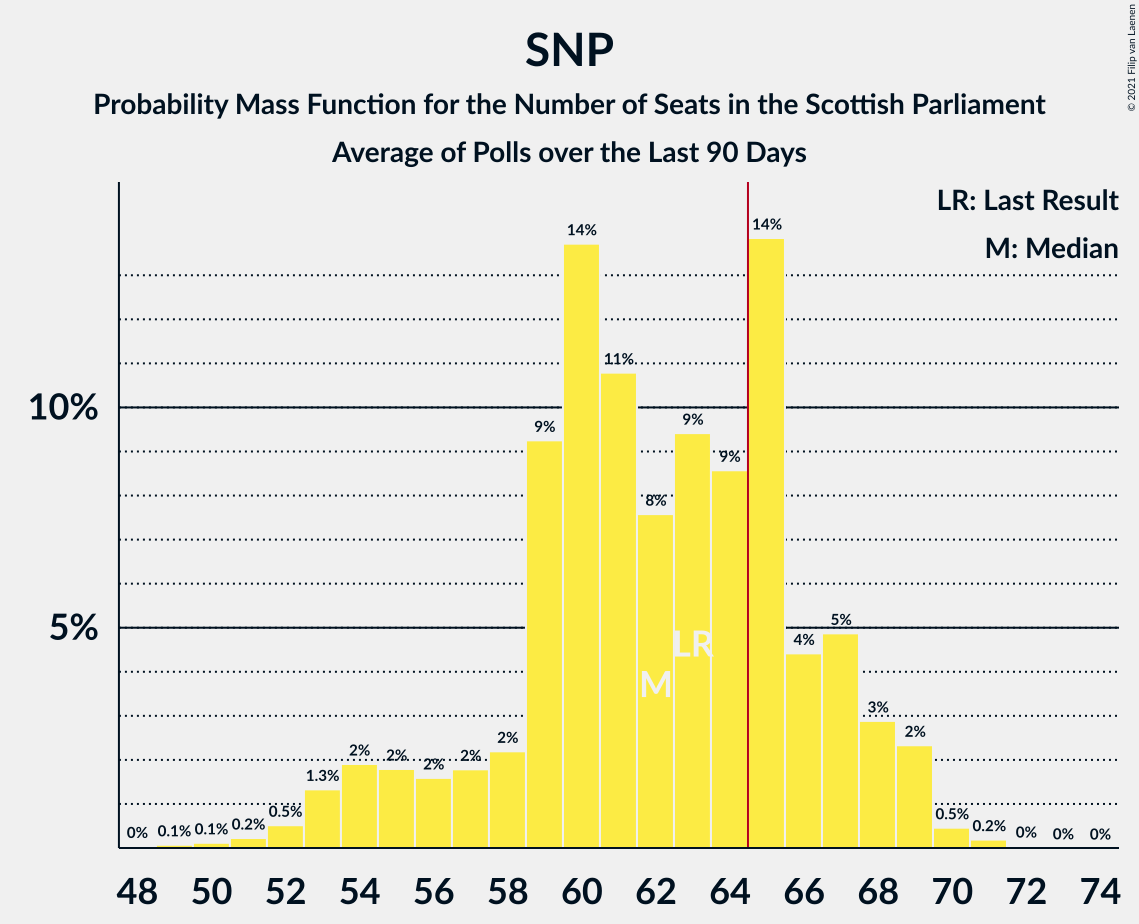
| Number of Seats | Probability | Accumulated | Special Marks |
|---|---|---|---|
| 48 | 0% | 100% | |
| 49 | 0.1% | 99.9% | |
| 50 | 0.1% | 99.9% | |
| 51 | 0.2% | 99.7% | |
| 52 | 0.5% | 99.5% | |
| 53 | 1.3% | 99.0% | |
| 54 | 2% | 98% | |
| 55 | 2% | 96% | |
| 56 | 2% | 94% | |
| 57 | 2% | 92% | |
| 58 | 2% | 91% | |
| 59 | 9% | 88% | |
| 60 | 14% | 79% | |
| 61 | 11% | 65% | |
| 62 | 8% | 55% | Median |
| 63 | 9% | 47% | Last Result |
| 64 | 9% | 38% | |
| 65 | 14% | 29% | Majority |
| 66 | 4% | 15% | |
| 67 | 5% | 11% | |
| 68 | 3% | 6% | |
| 69 | 2% | 3% | |
| 70 | 0.5% | 0.7% | |
| 71 | 0.2% | 0.2% | |
| 72 | 0% | 0.1% | |
| 73 | 0% | 0% |
Scottish Conservative & Unionist Party – Scottish Labour – Scottish Liberal Democrats
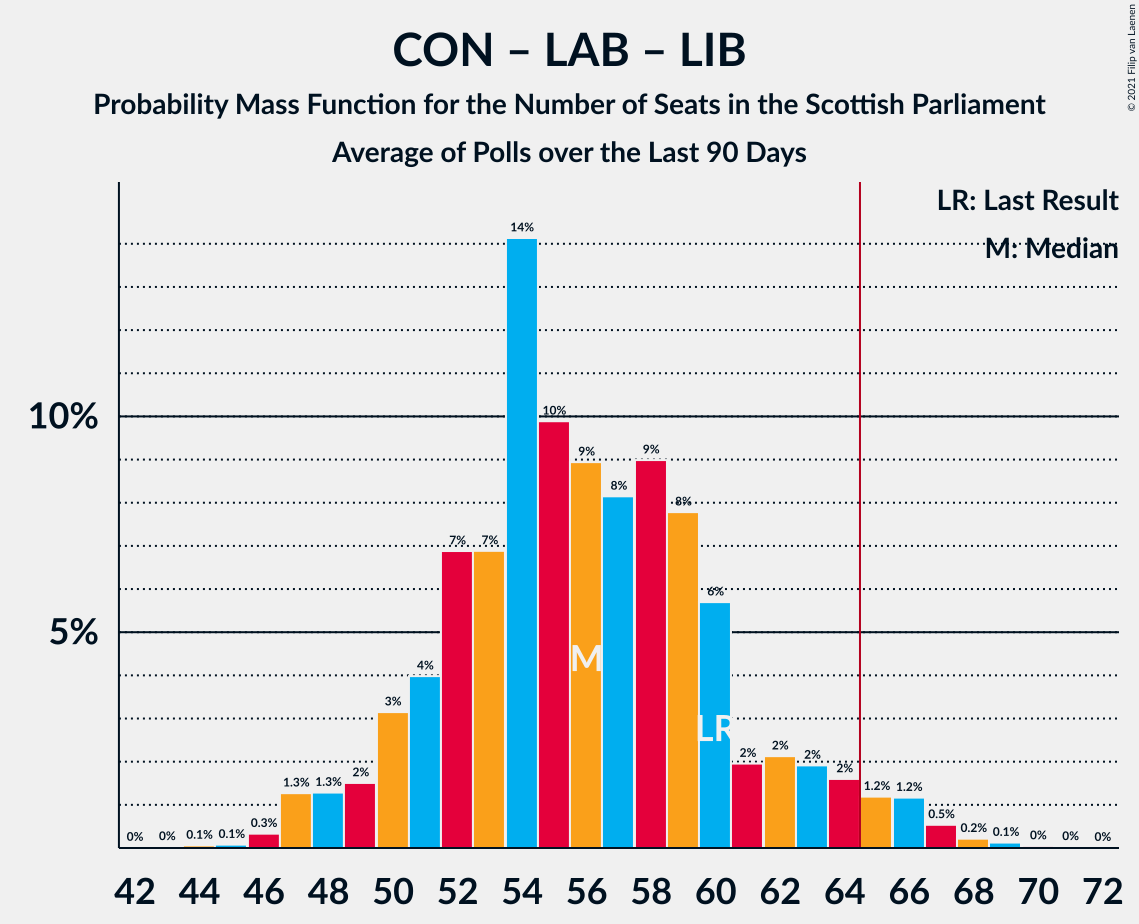
| Number of Seats | Probability | Accumulated | Special Marks |
|---|---|---|---|
| 44 | 0.1% | 100% | |
| 45 | 0.1% | 99.9% | |
| 46 | 0.3% | 99.8% | |
| 47 | 1.3% | 99.5% | |
| 48 | 1.3% | 98% | |
| 49 | 2% | 97% | |
| 50 | 3% | 95% | |
| 51 | 4% | 92% | |
| 52 | 7% | 88% | |
| 53 | 7% | 81% | |
| 54 | 14% | 75% | |
| 55 | 10% | 60% | |
| 56 | 9% | 50% | Median |
| 57 | 8% | 42% | |
| 58 | 9% | 33% | |
| 59 | 8% | 24% | |
| 60 | 6% | 17% | Last Result |
| 61 | 2% | 11% | |
| 62 | 2% | 9% | |
| 63 | 2% | 7% | |
| 64 | 2% | 5% | |
| 65 | 1.2% | 3% | Majority |
| 66 | 1.2% | 2% | |
| 67 | 0.5% | 1.0% | |
| 68 | 0.2% | 0.4% | |
| 69 | 0.1% | 0.2% | |
| 70 | 0% | 0.1% | |
| 71 | 0% | 0.1% | |
| 72 | 0% | 0% |
Scottish Conservative & Unionist Party – Scottish Labour
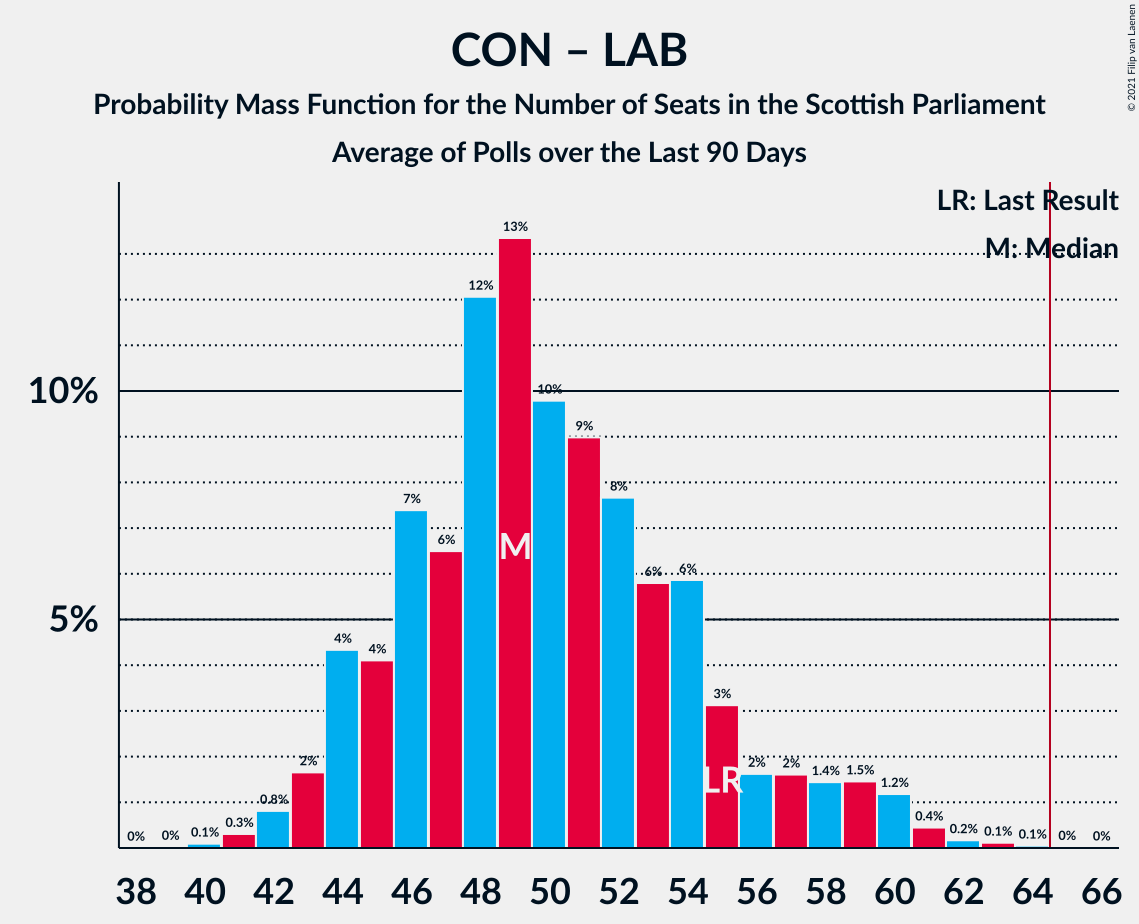
| Number of Seats | Probability | Accumulated | Special Marks |
|---|---|---|---|
| 40 | 0.1% | 100% | |
| 41 | 0.3% | 99.9% | |
| 42 | 0.8% | 99.6% | |
| 43 | 2% | 98.8% | |
| 44 | 4% | 97% | |
| 45 | 4% | 93% | |
| 46 | 7% | 89% | |
| 47 | 6% | 81% | |
| 48 | 12% | 75% | |
| 49 | 13% | 63% | |
| 50 | 10% | 49% | Median |
| 51 | 9% | 40% | |
| 52 | 8% | 31% | |
| 53 | 6% | 23% | |
| 54 | 6% | 17% | |
| 55 | 3% | 11% | Last Result |
| 56 | 2% | 8% | |
| 57 | 2% | 7% | |
| 58 | 1.4% | 5% | |
| 59 | 1.5% | 3% | |
| 60 | 1.2% | 2% | |
| 61 | 0.4% | 0.8% | |
| 62 | 0.2% | 0.4% | |
| 63 | 0.1% | 0.2% | |
| 64 | 0.1% | 0.1% | |
| 65 | 0% | 0% | Majority |
Scottish Labour – Scottish Greens – Scottish Liberal Democrats
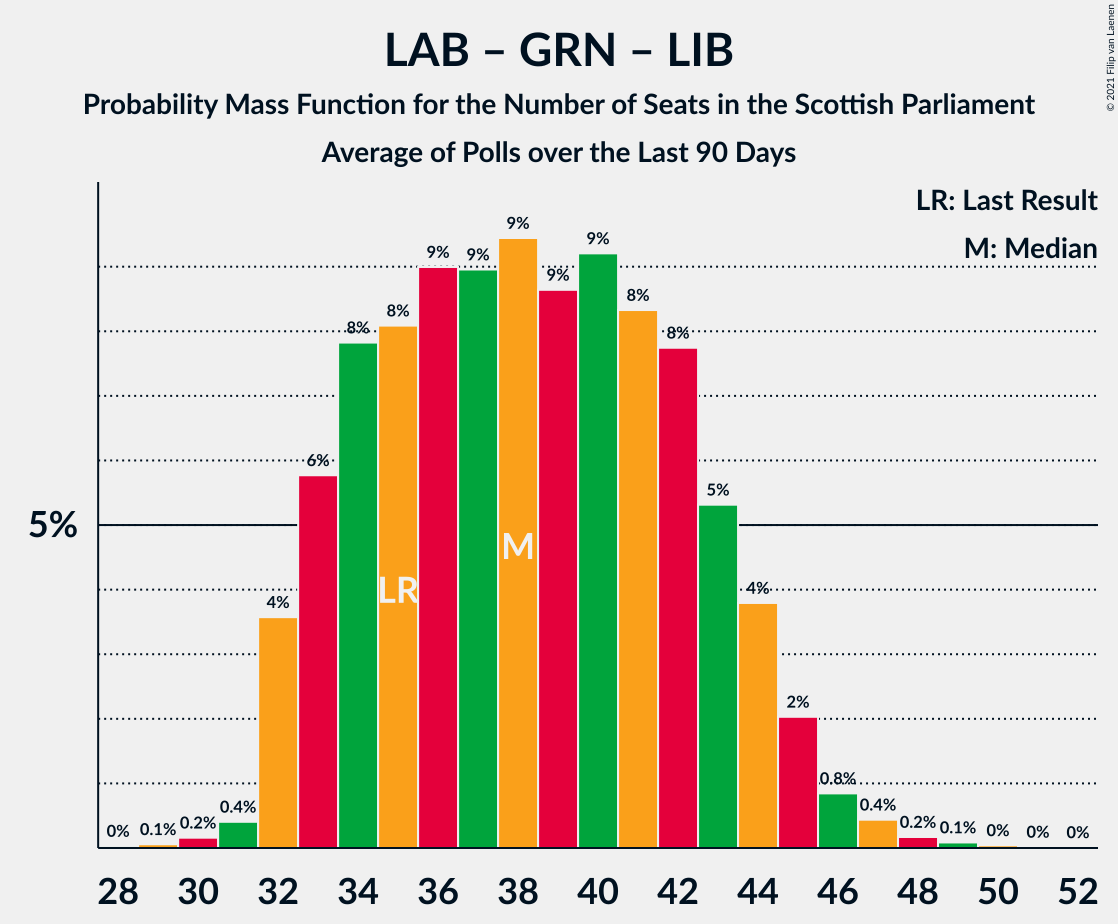
| Number of Seats | Probability | Accumulated | Special Marks |
|---|---|---|---|
| 29 | 0.1% | 100% | |
| 30 | 0.2% | 99.9% | |
| 31 | 0.4% | 99.7% | |
| 32 | 4% | 99.3% | |
| 33 | 6% | 96% | |
| 34 | 8% | 90% | |
| 35 | 8% | 82% | Last Result |
| 36 | 9% | 74% | |
| 37 | 9% | 65% | Median |
| 38 | 9% | 56% | |
| 39 | 9% | 47% | |
| 40 | 9% | 38% | |
| 41 | 8% | 29% | |
| 42 | 8% | 21% | |
| 43 | 5% | 13% | |
| 44 | 4% | 7% | |
| 45 | 2% | 4% | |
| 46 | 0.8% | 2% | |
| 47 | 0.4% | 0.8% | |
| 48 | 0.2% | 0.3% | |
| 49 | 0.1% | 0.2% | |
| 50 | 0% | 0.1% | |
| 51 | 0% | 0% |
Scottish Conservative & Unionist Party – Scottish Liberal Democrats
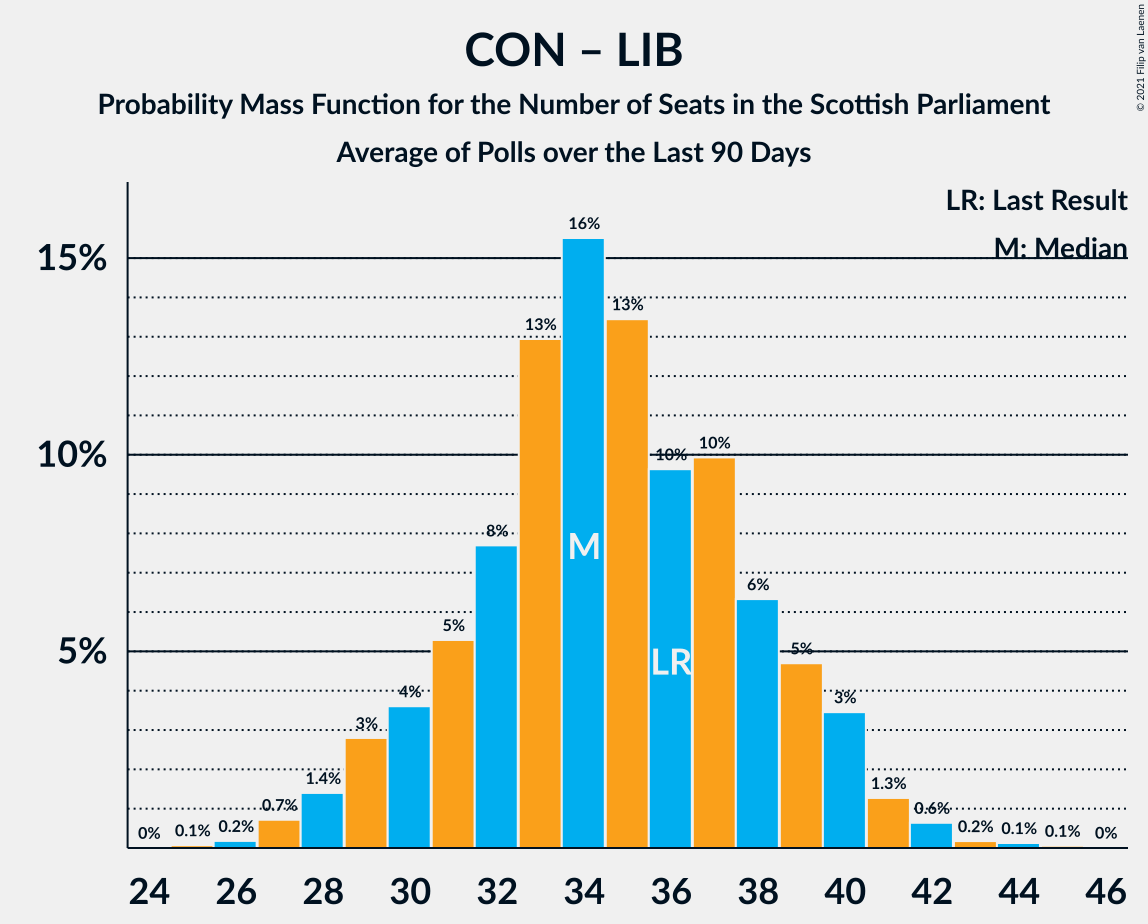
| Number of Seats | Probability | Accumulated | Special Marks |
|---|---|---|---|
| 25 | 0.1% | 100% | |
| 26 | 0.2% | 99.9% | |
| 27 | 0.7% | 99.7% | |
| 28 | 1.4% | 99.0% | |
| 29 | 3% | 98% | |
| 30 | 4% | 95% | |
| 31 | 5% | 91% | |
| 32 | 8% | 86% | |
| 33 | 13% | 78% | |
| 34 | 16% | 65% | |
| 35 | 13% | 50% | Median |
| 36 | 10% | 36% | Last Result |
| 37 | 10% | 27% | |
| 38 | 6% | 17% | |
| 39 | 5% | 10% | |
| 40 | 3% | 6% | |
| 41 | 1.3% | 2% | |
| 42 | 0.6% | 1.0% | |
| 43 | 0.2% | 0.4% | |
| 44 | 0.1% | 0.2% | |
| 45 | 0.1% | 0.1% | |
| 46 | 0% | 0% |
Scottish Labour – Scottish Liberal Democrats
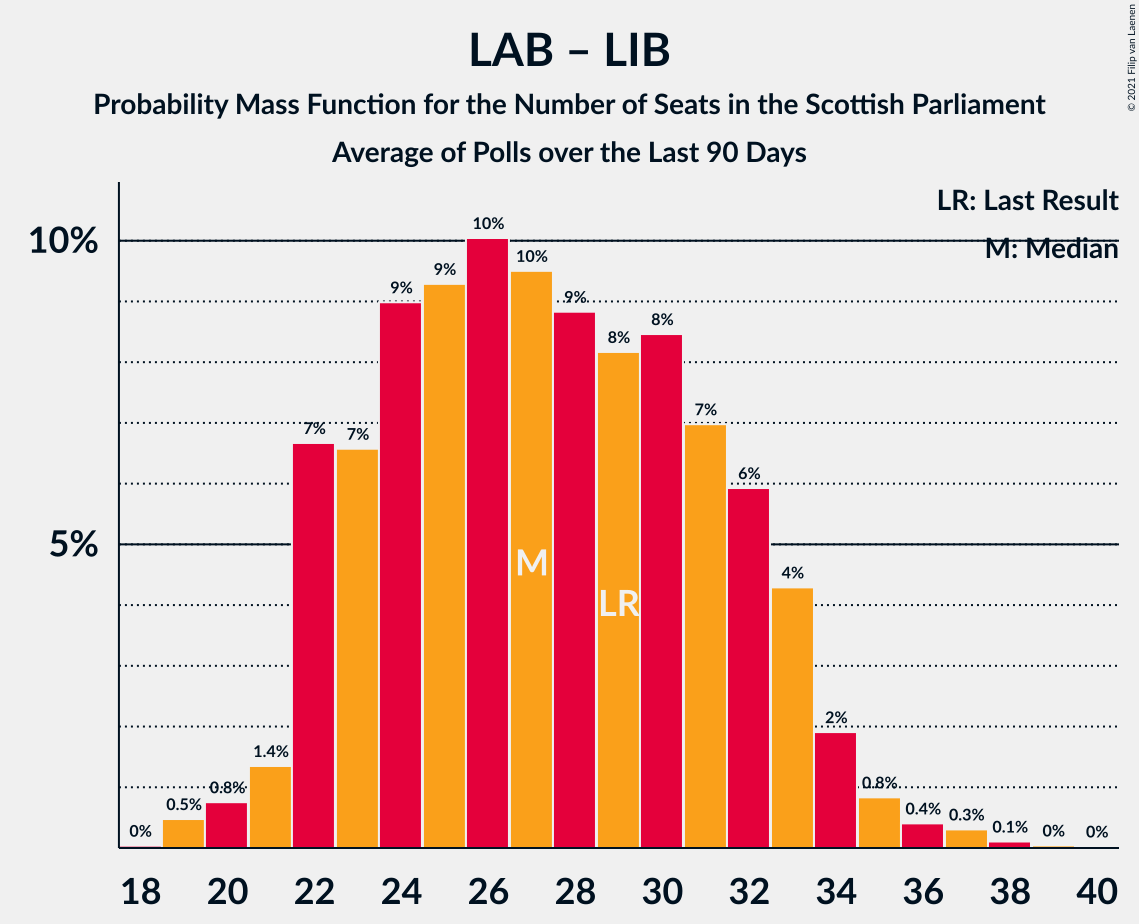
| Number of Seats | Probability | Accumulated | Special Marks |
|---|---|---|---|
| 19 | 0.5% | 100% | |
| 20 | 0.8% | 99.5% | |
| 21 | 1.4% | 98.7% | |
| 22 | 7% | 97% | |
| 23 | 7% | 91% | |
| 24 | 9% | 84% | |
| 25 | 9% | 75% | |
| 26 | 10% | 66% | |
| 27 | 10% | 56% | Median |
| 28 | 9% | 46% | |
| 29 | 8% | 37% | Last Result |
| 30 | 8% | 29% | |
| 31 | 7% | 21% | |
| 32 | 6% | 14% | |
| 33 | 4% | 8% | |
| 34 | 2% | 4% | |
| 35 | 0.8% | 2% | |
| 36 | 0.4% | 0.9% | |
| 37 | 0.3% | 0.5% | |
| 38 | 0.1% | 0.2% | |
| 39 | 0% | 0.1% | |
| 40 | 0% | 0% |
Technical Information
- Number of polls included in this average: 8
- Lowest number of simulations done in a poll included in this average: 1,048,576
- Total number of simulations done in the polls included in this average: 8,388,608
- Error estimate: 1.45%