Poll Average
Voting Intentions | Seats | Coalitions | Technical Information
Summary
The table below lists the polls on which the average is based. They are the most recent polls (less than 90 days old) registered and analyzed so far.
| Period | Polling firm/Commissioner(s) | Cs | JxCAT | ERC | PSC | CatComú | CUP | PP | Vox | PDeCAT |
|---|---|---|---|---|---|---|---|---|---|---|
| 21 December 2017 | General Election | 25.4% 36 |
21.7% 34 |
21.4% 32 |
13.9% 17 |
7.5% 8 |
4.5% 4 |
4.2% 4 |
0.0% 0 |
0.0% 0 |
| N/A | Poll Average | 5–13% 6–18 |
14–25% 23–39 |
17–25% 25–38 |
17–25% 24–35 |
5–10% 5–12 |
4–8% 4–11 |
3–7% 2–9 |
4–10% 5–13 |
1–4% 0–5 |
| 2–14 February 2021 | SyM Consulting | 11–13% 14–18 |
21–24% 32–37 |
19–22% 28–33 |
16–19% 23–25 |
6–8% 6–9 |
5–6% 5–8 |
3–5% 2–5 |
8–10% 10–14 |
N/A N/A |
| 13–14 February 2021 | SocioMétrica El Español |
6–11% 6–14 |
20–27% 31–44 |
15–22% 22–34 |
17–24% 24–34 |
5–10% 5–12 |
5–9% 6–12 |
2–6% 0–7 |
5–10% 7–14 |
2–4% 0–6 |
| 4–14 February 2021 | GESOP El Periódico |
5–7% 5–8 |
18–22% 29–35 |
19–22% 28–34 |
21–24% 29–35 |
6–8% 7–10 |
5–7% 6–8 |
5–7% 5–8 |
6–9% 8–12 |
2–4% 0–5 |
| 14 February 2021 | GAD3 RTVE–CCMA |
5–6% 5–7 |
19–22% 31–35 |
23–26% 35–40 |
23–26% 32–36 |
5–7% 5–8 |
5–6% 6–8 |
4–5% 3–6 |
5–7% 6–9 |
2–3% 0–1 |
| 8–14 February 2021 | Feedback El Nacional |
6–10% 8–13 |
18–23% 29–38 |
16–21% 24–33 |
19–24% 26–34 |
7–10% 7–13 |
5–8% 7–11 |
3–5% 2–7 |
6–9% 7–12 |
2–4% 0–5 |
| 12 February 2021 | electoPanel electomania.es |
6–12% 8–16 |
17–25% 28–41 |
16–24% 24–36 |
18–26% 24–37 |
5–10% 4–12 |
4–8% 4–11 |
3–7% 2–9 |
5–10% 5–13 |
1–3% 0–1 |
| 1–12 February 2021 | Metroscopia | 8–10% 9–13 |
20–23% 31–37 |
19–22% 28–33 |
22–25% 30–34 |
6–7% 5–8 |
5–7% 7–9 |
4–6% 5–7 |
5–6% 5–8 |
2–3% 0–1 |
| 8 February 2021 | Celeste-Tel | 8–13% 10–17 |
17–23% 27–37 |
17–23% 26–35 |
19–25% 26–34 |
6–10% 5–11 |
4–7% 4–9 |
4–7% 4–9 |
5–8% 5–10 |
1–3% 0 |
| 7 February 2021 | Key Data Público |
7–14% 8–18 |
16–24% 24–39 |
17–26% 24–39 |
17–26% 22–36 |
4–10% 4–12 |
4–9% 3–11 |
3–9% 3–12 |
3–9% 3–12 |
1–5% 0–6 |
| 5–7 February 2021 | Demoscopia y Servicios | 6–11% 7–14 |
18–25% 29–40 |
18–24% 26–37 |
19–26% 25–36 |
5–10% 5–11 |
4–8% 4–11 |
4–8% 3–10 |
4–8% 3–10 |
N/A N/A |
| 6 February 2021 | Sigma Dos El Mundo |
8–11% 9–14 |
19–24% 30–38 |
18–23% 27–35 |
20–26% 27–35 |
6–9% 5–10 |
4–7% 4–9 |
4–7% 4–9 |
4–7% 3–9 |
N/A N/A |
| 3–6 February 2021 | NC Report La Razón |
9–14% 11–18 |
17–23% 26–37 |
17–24% 25–35 |
18–25% 25–34 |
5–10% 5–11 |
4–8% 4–10 |
5–9% 5–11 |
4–8% 3–10 |
1–3% 0 |
| 1–4 February 2021 | Opinòmetre Ara |
7–10% 8–14 |
17–23% 27–37 |
19–25% 29–39 |
18–24% 25–33 |
5–9% 5–11 |
5–9% 7–11 |
4–7% 3–9 |
4–7% 3–9 |
2–4% 0–5 |
| 1–4 February 2021 | Hamalgama Métrica OKDiario |
10–14% 13–19 |
18–23% 29–37 |
18–23% 27–35 |
18–23% 24–31 |
6–9% 6–11 |
4–7% 4–9 |
5–7% 5–9 |
4–7% 5–9 |
N/A N/A |
| 1–3 February 2021 | CIS | 7–9% 8–12 |
13–16% 21–26 |
18–22% 28–34 |
22–26% 30–36 |
8–10% 9–13 |
6–8% 8–11 |
5–7% 6–9 |
6–8% 7–11 |
1–2% 0 |
| 29 January–2 February 2021 | DYM Henneo |
9–12% 12–17 |
20–24% 31–39 |
17–22% 25–33 |
20–25% 27–35 |
6–9% 6–10 |
5–7% 6–10 |
3–5% 0–5 |
5–7% 5–9 |
N/A N/A |
| 21 December 2017 | General Election | 25.4% 36 |
21.7% 34 |
21.4% 32 |
13.9% 17 |
7.5% 8 |
4.5% 4 |
4.2% 4 |
0.0% 0 |
0.0% 0 |
Only polls for which at least the sample size has been published are included in the table above.
Legend:
- Top half of each row: Voting intentions (95% confidence interval)
- Bottom half of each row: Seat projections for the Parliament of Catalonia (95% confidence interval)
- Cs: Ciutadans–Partido de la Ciudadanía
- JxCAT: Junts per Catalunya
- ERC: Esquerra Republicana–Catalunya Sí
- PSC: Partit dels Socialistes de Catalunya (PSC-PSOE)
- CatComú: Catalunya en Comú–Podem
- CUP: Candidatura d’Unitat Popular
- PP: Partit Popular
- Vox: Vox
- PDeCAT: Partit Demòcrata Europeu Català
- N/A (single party): Party not included the published results
- N/A (entire row): Calculation for this opinion poll not started yet
Voting Intentions

Confidence Intervals
| Party | Last Result | Median | 80% Confidence Interval | 90% Confidence Interval | 95% Confidence Interval | 99% Confidence Interval |
|---|---|---|---|---|---|---|
| Ciutadans–Partido de la Ciudadanía | 25.4% | 9.0% | 6.1–11.9% | 5.5–12.4% | 5.2–12.9% | 4.8–13.8% |
| Junts per Catalunya | 21.7% | 20.8% | 18.0–23.0% | 15.2–23.8% | 14.4–24.6% | 13.5–26.2% |
| Esquerra Republicana–Catalunya Sí | 21.4% | 20.3% | 18.2–23.2% | 17.5–24.2% | 16.9–24.7% | 15.8–25.6% |
| Partit dels Socialistes de Catalunya (PSC-PSOE) | 13.9% | 22.0% | 18.7–24.4% | 17.9–24.9% | 17.4–25.3% | 16.6–26.2% |
| Catalunya en Comú–Podem | 7.5% | 7.2% | 6.0–8.8% | 5.7–9.2% | 5.4–9.6% | 4.8–10.4% |
| Candidatura d’Unitat Popular | 4.5% | 5.9% | 4.9–7.3% | 4.6–7.7% | 4.3–8.1% | 3.7–9.0% |
| Partit Popular | 4.2% | 5.1% | 3.6–6.5% | 3.3–7.0% | 3.0–7.4% | 2.5–8.4% |
| Vox | 0.0% | 6.2% | 4.9–8.3% | 4.6–9.2% | 4.3–9.7% | 3.7–10.3% |
| Partit Demòcrata Europeu Català | 0.0% | 2.3% | 1.3–3.3% | 1.1–3.6% | 1.0–3.9% | 0.7–4.7% |
Ciutadans–Partido de la Ciudadanía
For a full overview of the results for this party, see the Ciutadans–Partido de la Ciudadanía page.
| Voting Intentions | Probability | Accumulated | Special Marks |
|---|---|---|---|
| 3.5–4.5% | 0.1% | 100% | |
| 4.5–5.5% | 6% | 99.9% | |
| 5.5–6.5% | 7% | 94% | |
| 6.5–7.5% | 9% | 87% | |
| 7.5–8.5% | 18% | 78% | |
| 8.5–9.5% | 19% | 60% | Median |
| 9.5–10.5% | 14% | 40% | |
| 10.5–11.5% | 12% | 26% | |
| 11.5–12.5% | 10% | 14% | |
| 12.5–13.5% | 4% | 4% | |
| 13.5–14.5% | 0.7% | 0.8% | |
| 14.5–15.5% | 0.1% | 0.1% | |
| 15.5–16.5% | 0% | 0% | |
| 16.5–17.5% | 0% | 0% | |
| 17.5–18.5% | 0% | 0% | |
| 18.5–19.5% | 0% | 0% | |
| 19.5–20.5% | 0% | 0% | |
| 20.5–21.5% | 0% | 0% | |
| 21.5–22.5% | 0% | 0% | |
| 22.5–23.5% | 0% | 0% | |
| 23.5–24.5% | 0% | 0% | |
| 24.5–25.5% | 0% | 0% | Last Result |
Junts per Catalunya
For a full overview of the results for this party, see the Junts per Catalunya page.
| Voting Intentions | Probability | Accumulated | Special Marks |
|---|---|---|---|
| 11.5–12.5% | 0% | 100% | |
| 12.5–13.5% | 0.6% | 100% | |
| 13.5–14.5% | 2% | 99.4% | |
| 14.5–15.5% | 3% | 97% | |
| 15.5–16.5% | 1.2% | 94% | |
| 16.5–17.5% | 2% | 93% | |
| 17.5–18.5% | 5% | 92% | |
| 18.5–19.5% | 11% | 87% | |
| 19.5–20.5% | 21% | 76% | |
| 20.5–21.5% | 23% | 55% | Median |
| 21.5–22.5% | 17% | 32% | Last Result |
| 22.5–23.5% | 9% | 15% | |
| 23.5–24.5% | 4% | 6% | |
| 24.5–25.5% | 2% | 3% | |
| 25.5–26.5% | 0.7% | 1.0% | |
| 26.5–27.5% | 0.3% | 0.4% | |
| 27.5–28.5% | 0.1% | 0.1% | |
| 28.5–29.5% | 0% | 0% |
Esquerra Republicana–Catalunya Sí
For a full overview of the results for this party, see the Esquerra Republicana–Catalunya Sí page.
| Voting Intentions | Probability | Accumulated | Special Marks |
|---|---|---|---|
| 13.5–14.5% | 0.1% | 100% | |
| 14.5–15.5% | 0.3% | 99.9% | |
| 15.5–16.5% | 1.2% | 99.7% | |
| 16.5–17.5% | 4% | 98% | |
| 17.5–18.5% | 9% | 95% | |
| 18.5–19.5% | 17% | 86% | |
| 19.5–20.5% | 25% | 68% | Median |
| 20.5–21.5% | 21% | 44% | Last Result |
| 21.5–22.5% | 10% | 23% | |
| 22.5–23.5% | 5% | 13% | |
| 23.5–24.5% | 5% | 8% | |
| 24.5–25.5% | 3% | 3% | |
| 25.5–26.5% | 0.4% | 0.5% | |
| 26.5–27.5% | 0.1% | 0.1% | |
| 27.5–28.5% | 0% | 0% |
Partit dels Socialistes de Catalunya (PSC-PSOE)
For a full overview of the results for this party, see the Partit dels Socialistes de Catalunya (PSC-PSOE) page.
| Voting Intentions | Probability | Accumulated | Special Marks |
|---|---|---|---|
| 13.5–14.5% | 0% | 100% | Last Result |
| 14.5–15.5% | 0% | 100% | |
| 15.5–16.5% | 0.4% | 99.9% | |
| 16.5–17.5% | 3% | 99.5% | |
| 17.5–18.5% | 6% | 97% | |
| 18.5–19.5% | 7% | 91% | |
| 19.5–20.5% | 11% | 84% | |
| 20.5–21.5% | 15% | 73% | |
| 21.5–22.5% | 18% | 58% | Median |
| 22.5–23.5% | 18% | 40% | |
| 23.5–24.5% | 14% | 22% | |
| 24.5–25.5% | 6% | 8% | |
| 25.5–26.5% | 1.3% | 2% | |
| 26.5–27.5% | 0.2% | 0.3% | |
| 27.5–28.5% | 0% | 0.1% | |
| 28.5–29.5% | 0% | 0% |
Catalunya en Comú–Podem
For a full overview of the results for this party, see the Catalunya en Comú–Podem page.
| Voting Intentions | Probability | Accumulated | Special Marks |
|---|---|---|---|
| 2.5–3.5% | 0% | 100% | |
| 3.5–4.5% | 0.3% | 100% | |
| 4.5–5.5% | 3% | 99.7% | |
| 5.5–6.5% | 23% | 96% | |
| 6.5–7.5% | 36% | 73% | Last Result, Median |
| 7.5–8.5% | 24% | 37% | |
| 8.5–9.5% | 10% | 13% | |
| 9.5–10.5% | 3% | 3% | |
| 10.5–11.5% | 0.3% | 0.4% | |
| 11.5–12.5% | 0% | 0% |
Candidatura d’Unitat Popular
For a full overview of the results for this party, see the Candidatura d’Unitat Popular page.
| Voting Intentions | Probability | Accumulated | Special Marks |
|---|---|---|---|
| 1.5–2.5% | 0% | 100% | |
| 2.5–3.5% | 0.3% | 100% | |
| 3.5–4.5% | 5% | 99.7% | Last Result |
| 4.5–5.5% | 31% | 95% | |
| 5.5–6.5% | 39% | 65% | Median |
| 6.5–7.5% | 19% | 26% | |
| 7.5–8.5% | 6% | 7% | |
| 8.5–9.5% | 1.0% | 1.2% | |
| 9.5–10.5% | 0.2% | 0.2% | |
| 10.5–11.5% | 0% | 0% |
Partit Popular
For a full overview of the results for this party, see the Partit Popular page.
| Voting Intentions | Probability | Accumulated | Special Marks |
|---|---|---|---|
| 0.5–1.5% | 0% | 100% | |
| 1.5–2.5% | 0.5% | 100% | |
| 2.5–3.5% | 9% | 99.5% | |
| 3.5–4.5% | 23% | 91% | Last Result |
| 4.5–5.5% | 32% | 68% | Median |
| 5.5–6.5% | 26% | 36% | |
| 6.5–7.5% | 8% | 10% | |
| 7.5–8.5% | 2% | 2% | |
| 8.5–9.5% | 0.3% | 0.4% | |
| 9.5–10.5% | 0.1% | 0.1% | |
| 10.5–11.5% | 0% | 0% |
Vox
For a full overview of the results for this party, see the Vox page.
| Voting Intentions | Probability | Accumulated | Special Marks |
|---|---|---|---|
| 0.0–0.5% | 0% | 100% | Last Result |
| 0.5–1.5% | 0% | 100% | |
| 1.5–2.5% | 0% | 100% | |
| 2.5–3.5% | 0.3% | 100% | |
| 3.5–4.5% | 4% | 99.7% | |
| 4.5–5.5% | 23% | 95% | |
| 5.5–6.5% | 33% | 72% | Median |
| 6.5–7.5% | 21% | 40% | |
| 7.5–8.5% | 10% | 19% | |
| 8.5–9.5% | 6% | 9% | |
| 9.5–10.5% | 3% | 3% | |
| 10.5–11.5% | 0.2% | 0.2% | |
| 11.5–12.5% | 0% | 0% |
Partit Demòcrata Europeu Català
For a full overview of the results for this party, see the Partit Demòcrata Europeu Català page.
| Voting Intentions | Probability | Accumulated | Special Marks |
|---|---|---|---|
| 0.0–0.5% | 0.1% | 100% | Last Result |
| 0.5–1.5% | 19% | 99.9% | |
| 1.5–2.5% | 43% | 81% | Median |
| 2.5–3.5% | 32% | 38% | |
| 3.5–4.5% | 5% | 6% | |
| 4.5–5.5% | 0.6% | 0.7% | |
| 5.5–6.5% | 0.1% | 0.1% | |
| 6.5–7.5% | 0% | 0% |
Seats
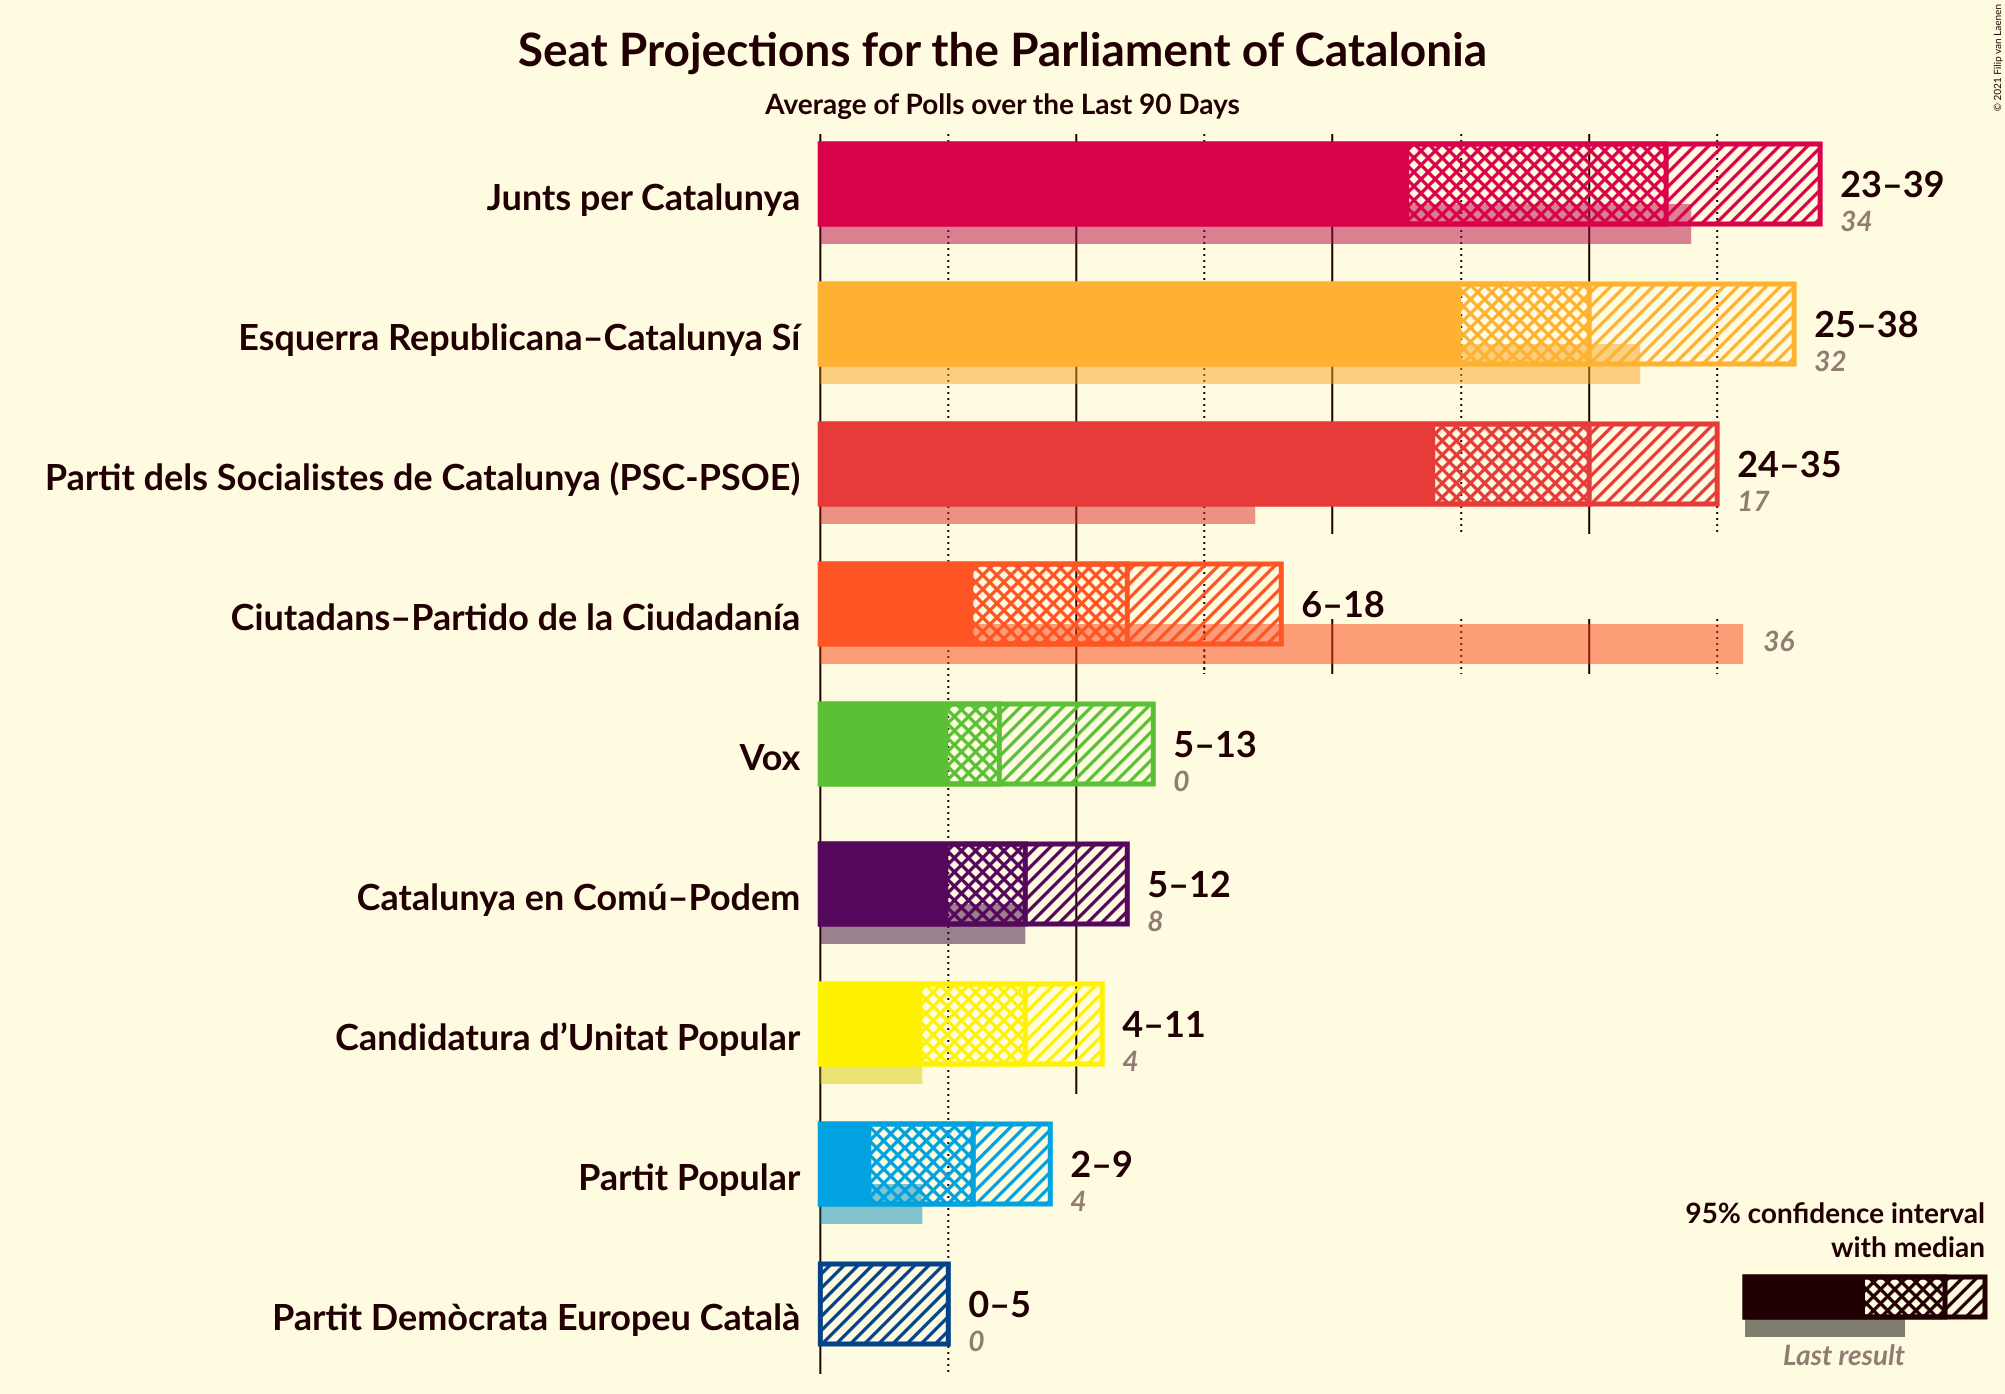
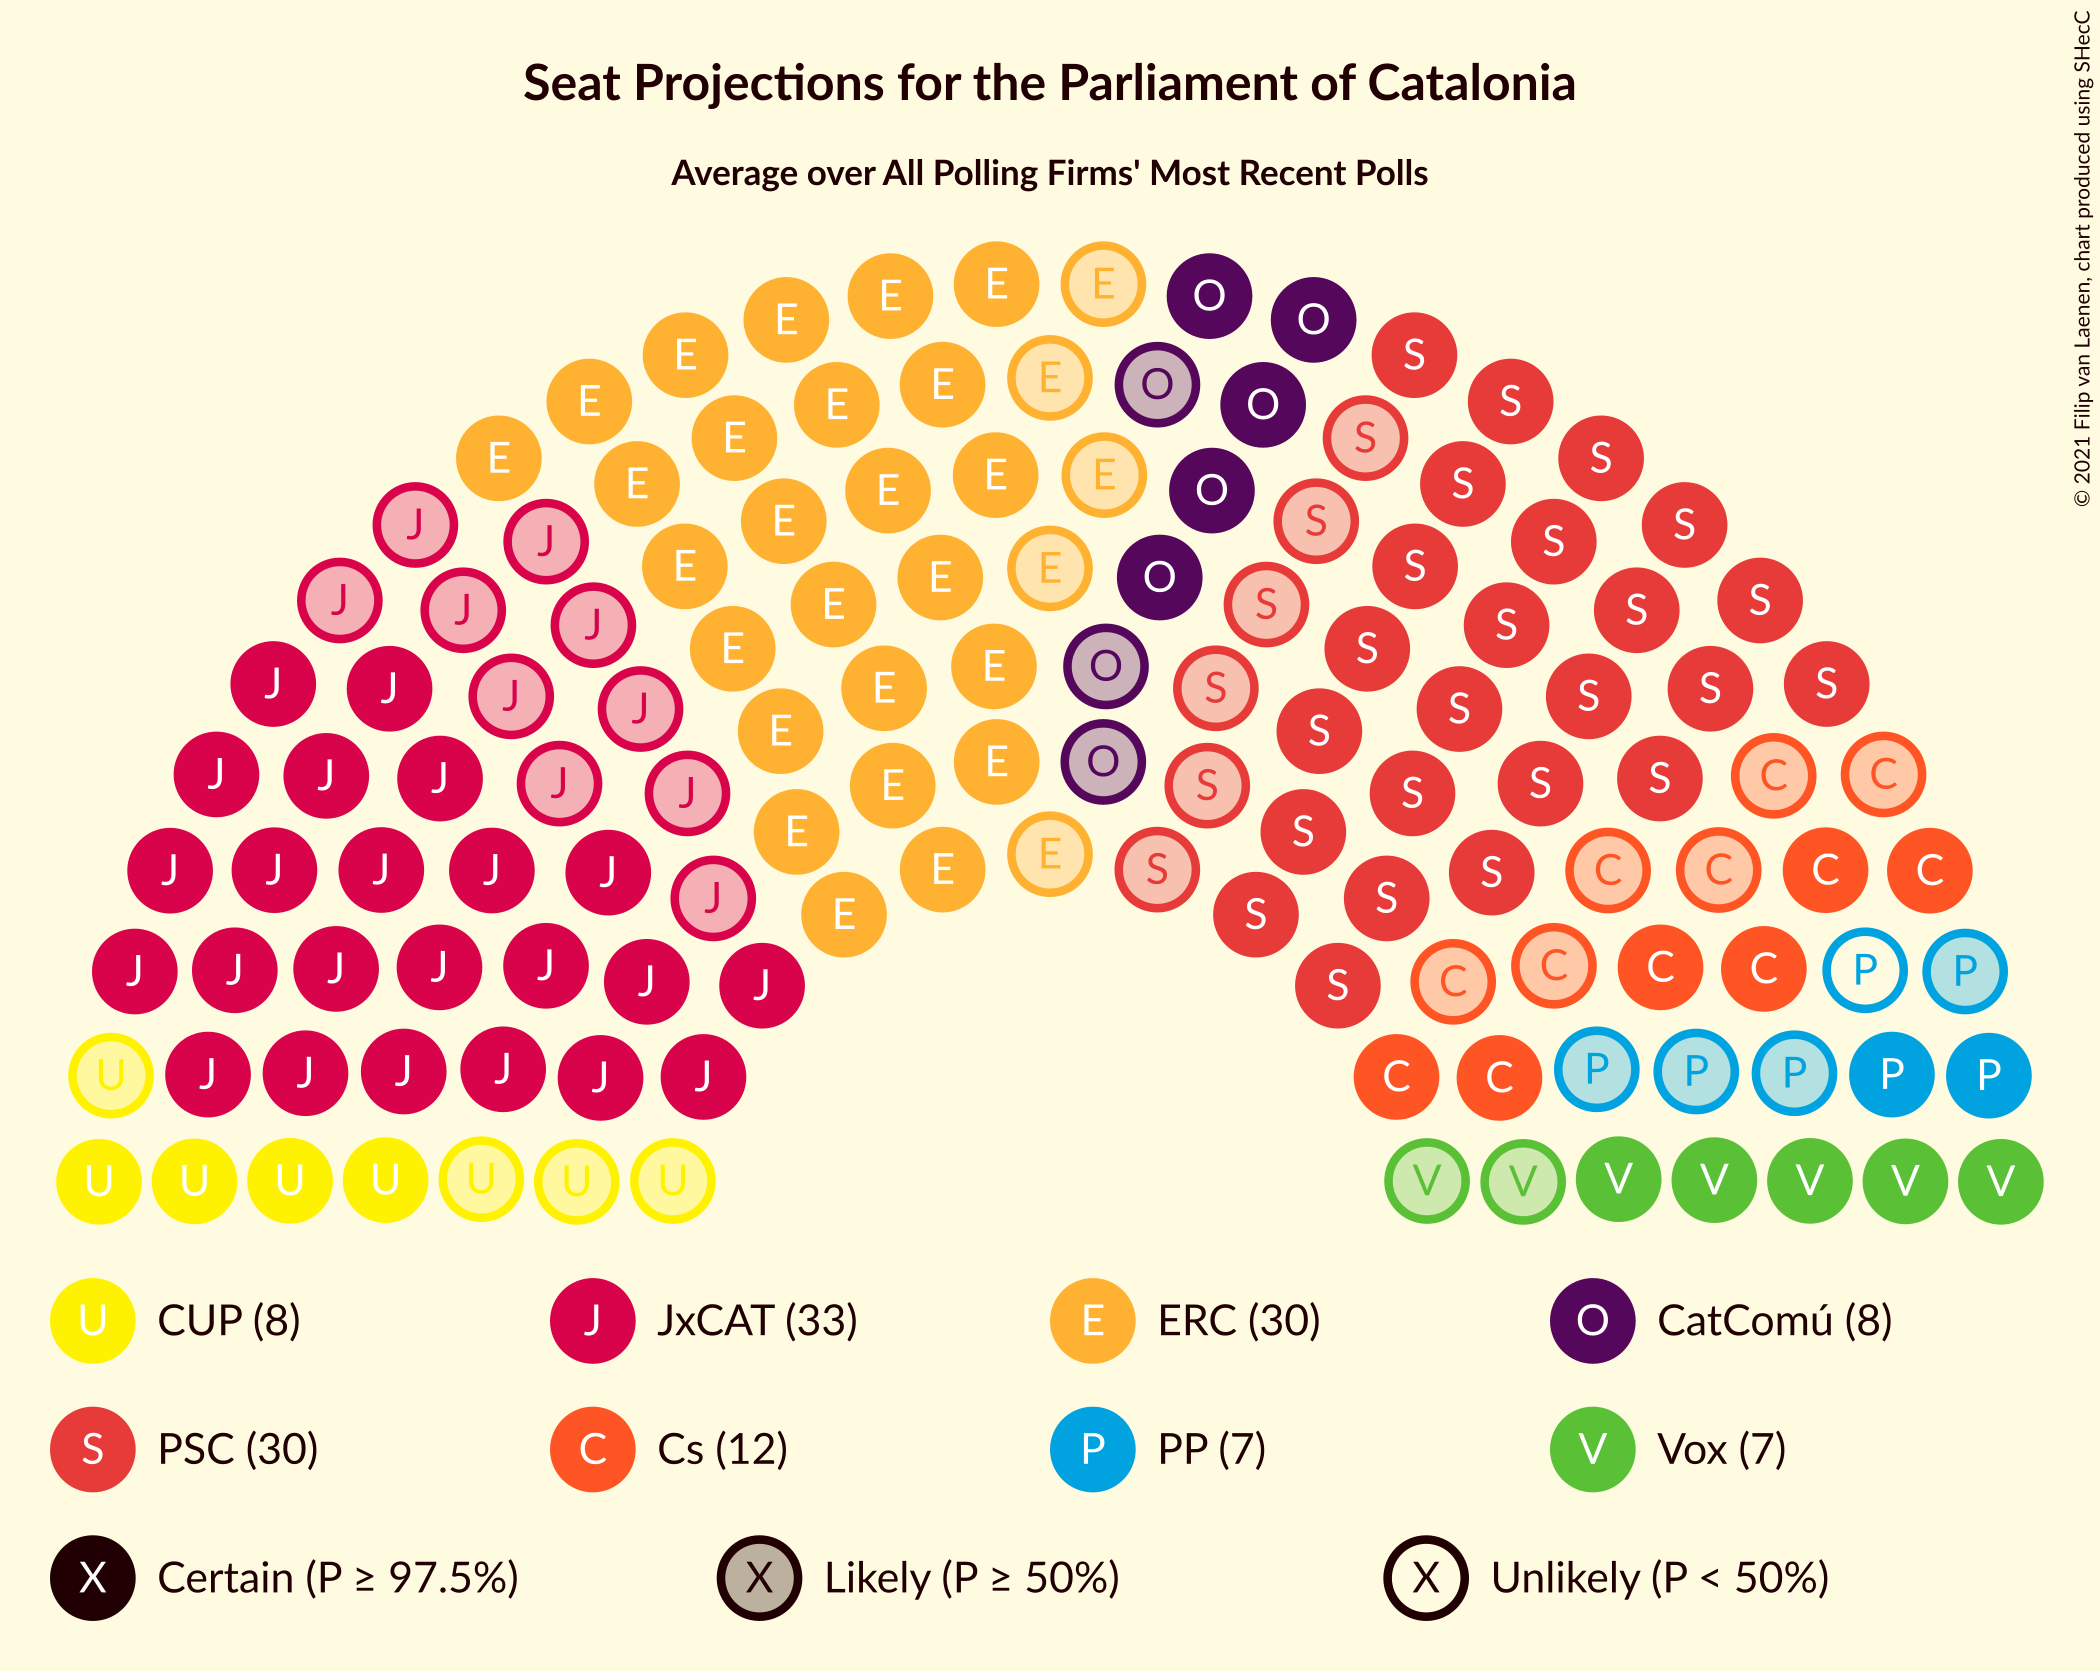
Confidence Intervals
| Party | Last Result | Median | 80% Confidence Interval | 90% Confidence Interval | 95% Confidence Interval | 99% Confidence Interval |
|---|---|---|---|---|---|---|
| Ciutadans–Partido de la Ciudadanía | 36 | 12 | 7–16 | 6–16 | 6–18 | 5–19 |
| Junts per Catalunya | 34 | 33 | 29–37 | 25–38 | 23–39 | 22–42 |
| Esquerra Republicana–Catalunya Sí | 32 | 30 | 27–35 | 26–37 | 25–38 | 23–40 |
| Partit dels Socialistes de Catalunya (PSC-PSOE) | 17 | 30 | 25–34 | 24–35 | 24–35 | 23–37 |
| Catalunya en Comú–Podem | 8 | 8 | 6–11 | 5–11 | 5–12 | 4–13 |
| Candidatura d’Unitat Popular | 4 | 8 | 6–9 | 5–10 | 4–11 | 3–12 |
| Partit Popular | 4 | 6 | 3–8 | 3–9 | 2–9 | 0–11 |
| Vox | 0 | 7 | 5–11 | 5–12 | 5–13 | 3–14 |
| Partit Demòcrata Europeu Català | 0 | 0 | 0–1 | 0–4 | 0–5 | 0–6 |
Ciutadans–Partido de la Ciudadanía
For a full overview of the results for this party, see the Ciutadans–Partido de la Ciudadanía page.
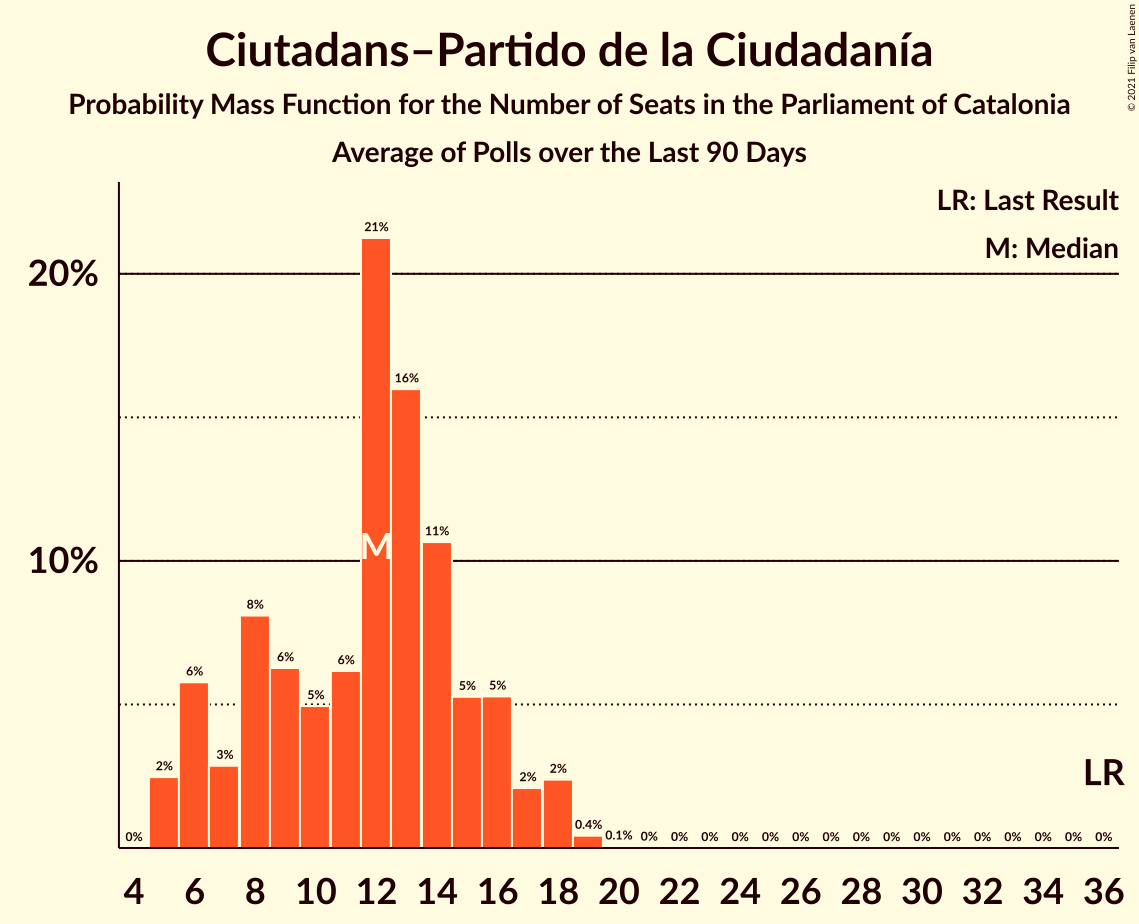
| Number of Seats | Probability | Accumulated | Special Marks |
|---|---|---|---|
| 5 | 2% | 100% | |
| 6 | 6% | 98% | |
| 7 | 3% | 92% | |
| 8 | 8% | 89% | |
| 9 | 6% | 81% | |
| 10 | 5% | 75% | |
| 11 | 6% | 70% | |
| 12 | 21% | 63% | Median |
| 13 | 16% | 42% | |
| 14 | 11% | 26% | |
| 15 | 5% | 16% | |
| 16 | 5% | 10% | |
| 17 | 2% | 5% | |
| 18 | 2% | 3% | |
| 19 | 0.4% | 0.5% | |
| 20 | 0.1% | 0.1% | |
| 21 | 0% | 0% | |
| 22 | 0% | 0% | |
| 23 | 0% | 0% | |
| 24 | 0% | 0% | |
| 25 | 0% | 0% | |
| 26 | 0% | 0% | |
| 27 | 0% | 0% | |
| 28 | 0% | 0% | |
| 29 | 0% | 0% | |
| 30 | 0% | 0% | |
| 31 | 0% | 0% | |
| 32 | 0% | 0% | |
| 33 | 0% | 0% | |
| 34 | 0% | 0% | |
| 35 | 0% | 0% | |
| 36 | 0% | 0% | Last Result |
Junts per Catalunya
For a full overview of the results for this party, see the Junts per Catalunya page.
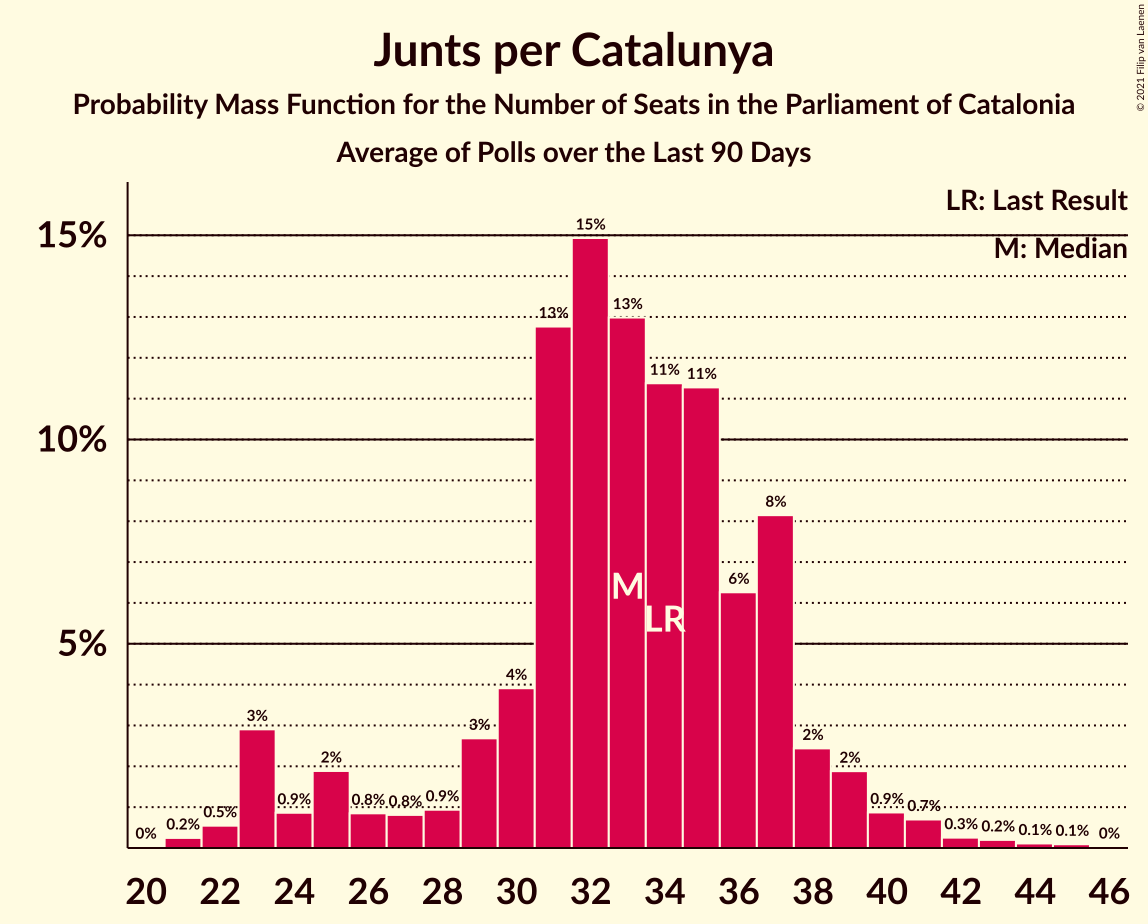
| Number of Seats | Probability | Accumulated | Special Marks |
|---|---|---|---|
| 21 | 0.2% | 100% | |
| 22 | 0.5% | 99.7% | |
| 23 | 3% | 99.2% | |
| 24 | 0.9% | 96% | |
| 25 | 2% | 95% | |
| 26 | 0.8% | 94% | |
| 27 | 0.8% | 93% | |
| 28 | 0.9% | 92% | |
| 29 | 3% | 91% | |
| 30 | 4% | 88% | |
| 31 | 13% | 84% | |
| 32 | 15% | 72% | |
| 33 | 13% | 57% | Median |
| 34 | 11% | 44% | Last Result |
| 35 | 11% | 32% | |
| 36 | 6% | 21% | |
| 37 | 8% | 15% | |
| 38 | 2% | 7% | |
| 39 | 2% | 4% | |
| 40 | 0.9% | 2% | |
| 41 | 0.7% | 1.4% | |
| 42 | 0.3% | 0.7% | |
| 43 | 0.2% | 0.4% | |
| 44 | 0.1% | 0.2% | |
| 45 | 0.1% | 0.1% | |
| 46 | 0% | 0% |
Esquerra Republicana–Catalunya Sí
For a full overview of the results for this party, see the Esquerra Republicana–Catalunya Sí page.
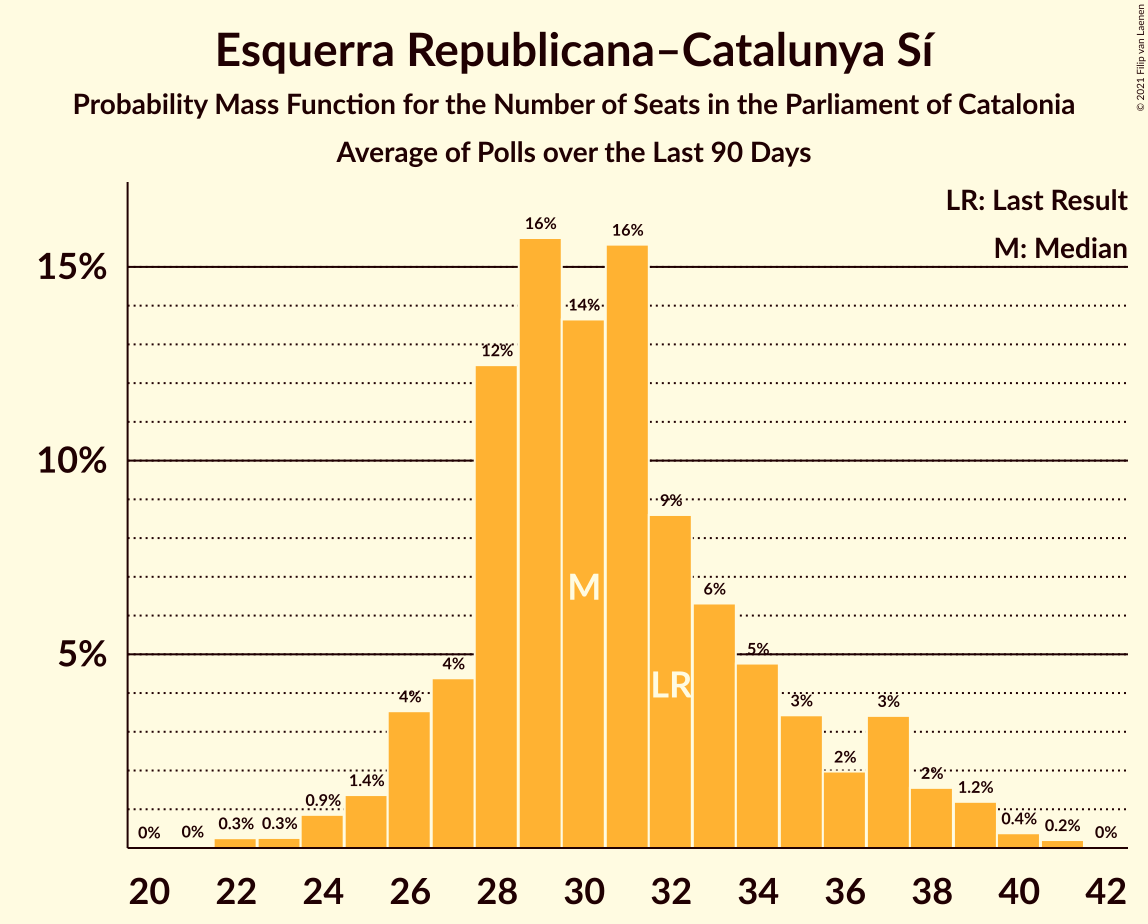
| Number of Seats | Probability | Accumulated | Special Marks |
|---|---|---|---|
| 21 | 0% | 100% | |
| 22 | 0.3% | 99.9% | |
| 23 | 0.3% | 99.7% | |
| 24 | 0.9% | 99.4% | |
| 25 | 1.4% | 98.6% | |
| 26 | 4% | 97% | |
| 27 | 4% | 94% | |
| 28 | 12% | 89% | |
| 29 | 16% | 77% | |
| 30 | 14% | 61% | Median |
| 31 | 16% | 47% | |
| 32 | 9% | 32% | Last Result |
| 33 | 6% | 23% | |
| 34 | 5% | 17% | |
| 35 | 3% | 12% | |
| 36 | 2% | 9% | |
| 37 | 3% | 7% | |
| 38 | 2% | 3% | |
| 39 | 1.2% | 2% | |
| 40 | 0.4% | 0.6% | |
| 41 | 0.2% | 0.3% | |
| 42 | 0% | 0% |
Partit dels Socialistes de Catalunya (PSC-PSOE)
For a full overview of the results for this party, see the Partit dels Socialistes de Catalunya (PSC-PSOE) page.
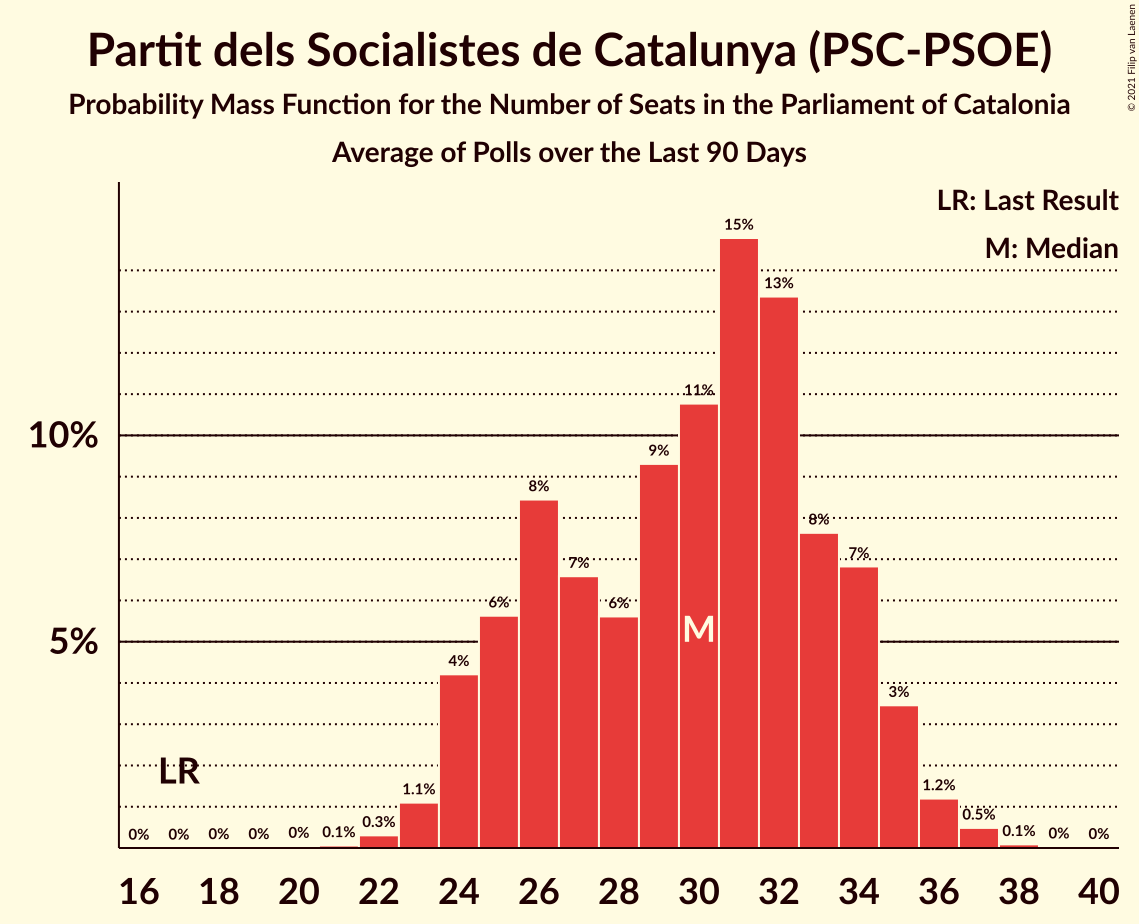
| Number of Seats | Probability | Accumulated | Special Marks |
|---|---|---|---|
| 17 | 0% | 100% | Last Result |
| 18 | 0% | 100% | |
| 19 | 0% | 100% | |
| 20 | 0% | 100% | |
| 21 | 0.1% | 99.9% | |
| 22 | 0.3% | 99.9% | |
| 23 | 1.1% | 99.6% | |
| 24 | 4% | 98% | |
| 25 | 6% | 94% | |
| 26 | 8% | 89% | |
| 27 | 7% | 80% | |
| 28 | 6% | 74% | |
| 29 | 9% | 68% | |
| 30 | 11% | 59% | Median |
| 31 | 15% | 48% | |
| 32 | 13% | 33% | |
| 33 | 8% | 20% | |
| 34 | 7% | 12% | |
| 35 | 3% | 5% | |
| 36 | 1.2% | 2% | |
| 37 | 0.5% | 0.6% | |
| 38 | 0.1% | 0.1% | |
| 39 | 0% | 0% |
Catalunya en Comú–Podem
For a full overview of the results for this party, see the Catalunya en Comú–Podem page.
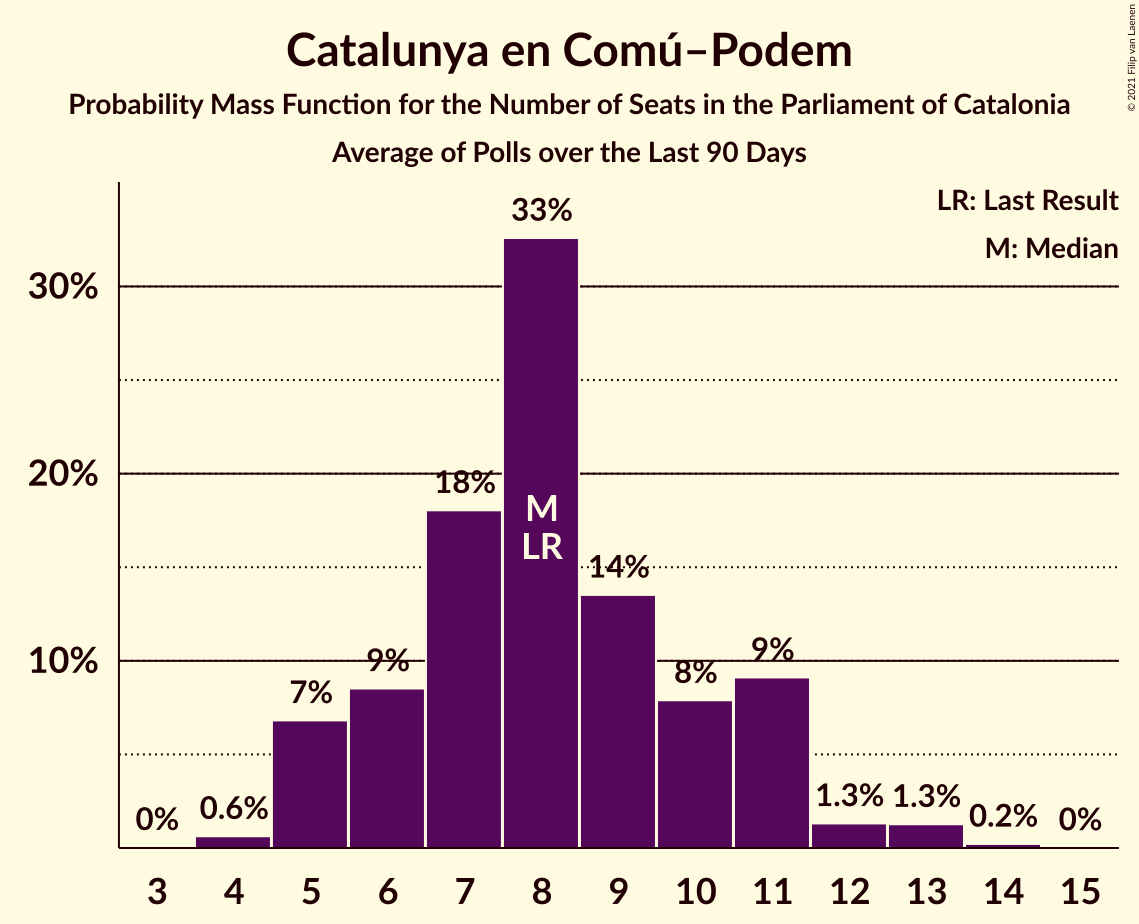
| Number of Seats | Probability | Accumulated | Special Marks |
|---|---|---|---|
| 4 | 0.6% | 100% | |
| 5 | 7% | 99.3% | |
| 6 | 9% | 93% | |
| 7 | 18% | 84% | |
| 8 | 33% | 66% | Last Result, Median |
| 9 | 14% | 33% | |
| 10 | 8% | 20% | |
| 11 | 9% | 12% | |
| 12 | 1.3% | 3% | |
| 13 | 1.3% | 2% | |
| 14 | 0.2% | 0.3% | |
| 15 | 0% | 0% |
Candidatura d’Unitat Popular
For a full overview of the results for this party, see the Candidatura d’Unitat Popular page.
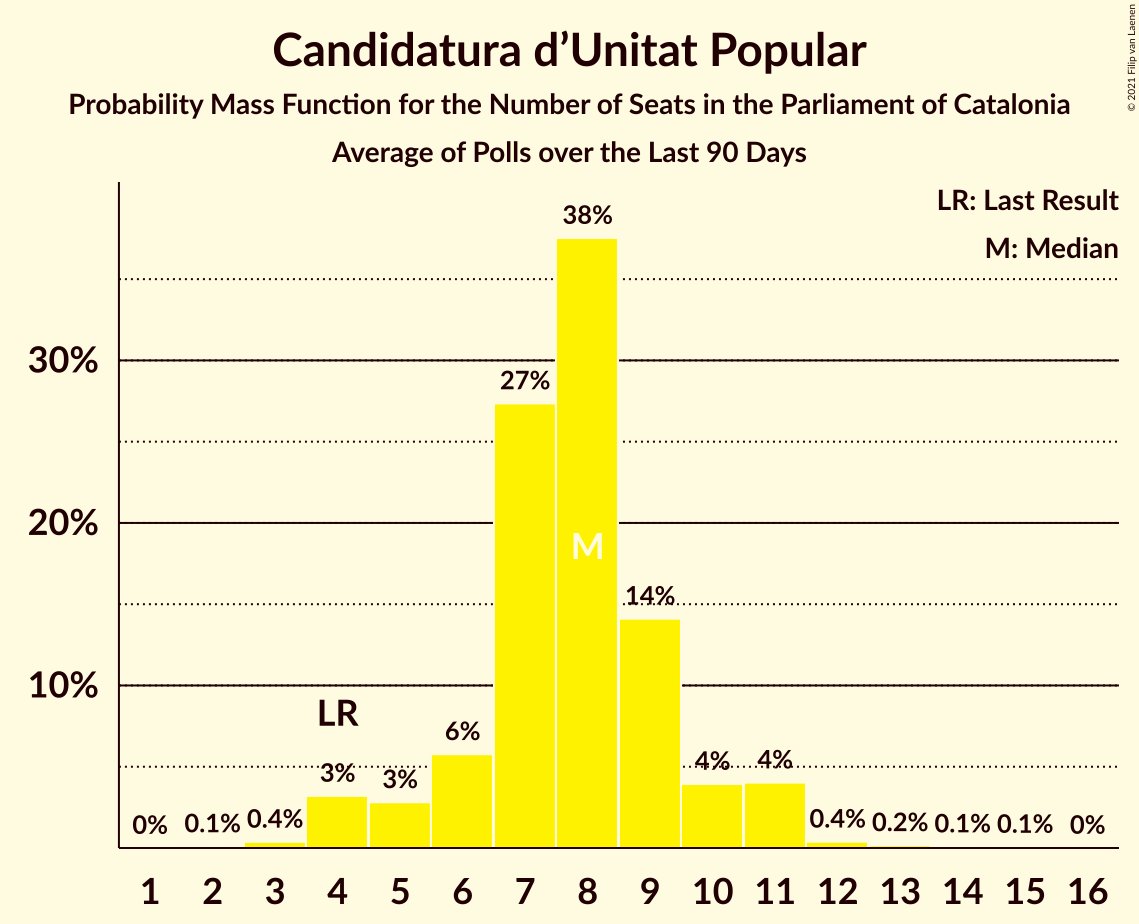
| Number of Seats | Probability | Accumulated | Special Marks |
|---|---|---|---|
| 2 | 0.1% | 100% | |
| 3 | 0.4% | 99.9% | |
| 4 | 3% | 99.5% | Last Result |
| 5 | 3% | 96% | |
| 6 | 6% | 93% | |
| 7 | 27% | 88% | |
| 8 | 38% | 60% | Median |
| 9 | 14% | 23% | |
| 10 | 4% | 9% | |
| 11 | 4% | 5% | |
| 12 | 0.4% | 0.7% | |
| 13 | 0.2% | 0.3% | |
| 14 | 0.1% | 0.2% | |
| 15 | 0.1% | 0.1% | |
| 16 | 0% | 0% |
Partit Popular
For a full overview of the results for this party, see the Partit Popular page.
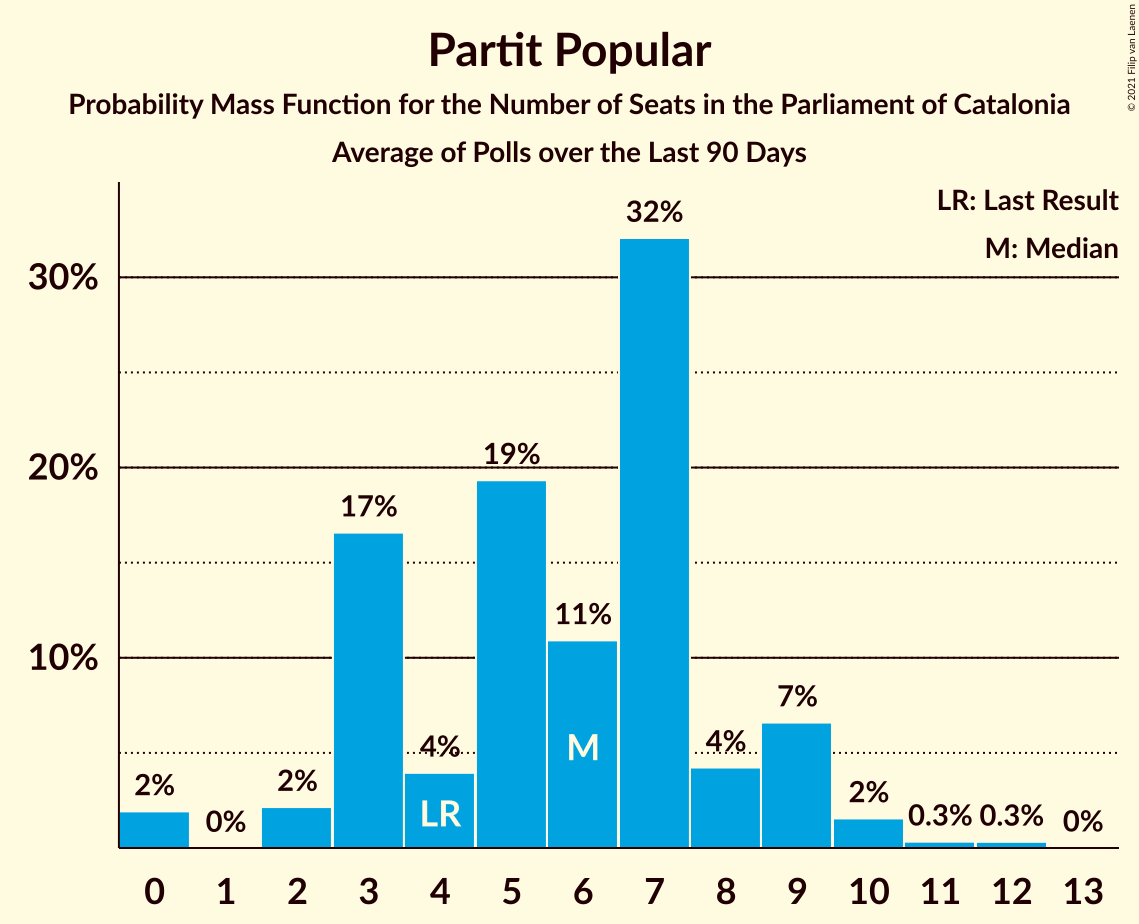
| Number of Seats | Probability | Accumulated | Special Marks |
|---|---|---|---|
| 0 | 2% | 100% | |
| 1 | 0% | 98% | |
| 2 | 2% | 98% | |
| 3 | 17% | 96% | |
| 4 | 4% | 79% | Last Result |
| 5 | 19% | 75% | |
| 6 | 11% | 56% | Median |
| 7 | 32% | 45% | |
| 8 | 4% | 13% | |
| 9 | 7% | 9% | |
| 10 | 2% | 2% | |
| 11 | 0.3% | 0.7% | |
| 12 | 0.3% | 0.4% | |
| 13 | 0% | 0% |
Vox
For a full overview of the results for this party, see the Vox page.
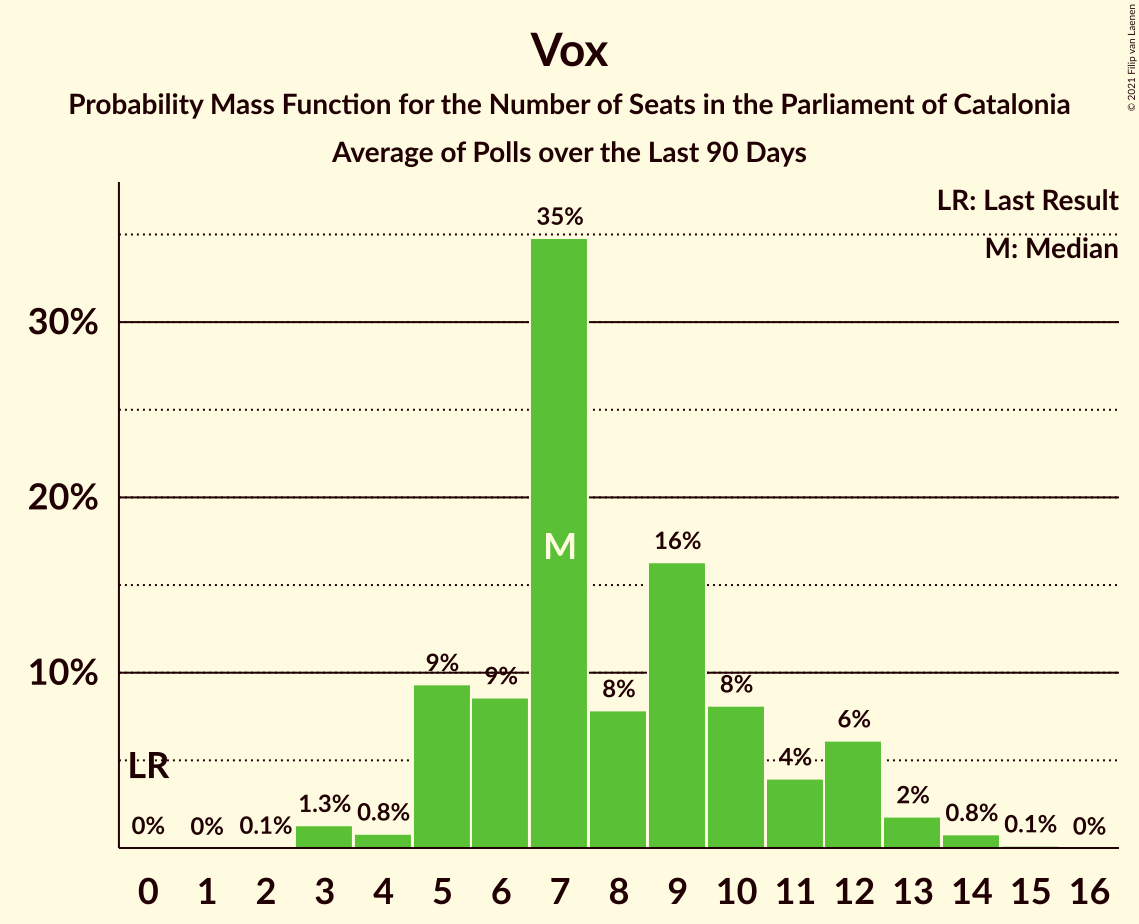
| Number of Seats | Probability | Accumulated | Special Marks |
|---|---|---|---|
| 0 | 0% | 100% | Last Result |
| 1 | 0% | 100% | |
| 2 | 0.1% | 100% | |
| 3 | 1.3% | 99.9% | |
| 4 | 0.8% | 98.6% | |
| 5 | 9% | 98% | |
| 6 | 9% | 88% | |
| 7 | 35% | 80% | Median |
| 8 | 8% | 45% | |
| 9 | 16% | 37% | |
| 10 | 8% | 21% | |
| 11 | 4% | 13% | |
| 12 | 6% | 9% | |
| 13 | 2% | 3% | |
| 14 | 0.8% | 0.9% | |
| 15 | 0.1% | 0.1% | |
| 16 | 0% | 0% |
Partit Demòcrata Europeu Català
For a full overview of the results for this party, see the Partit Demòcrata Europeu Català page.
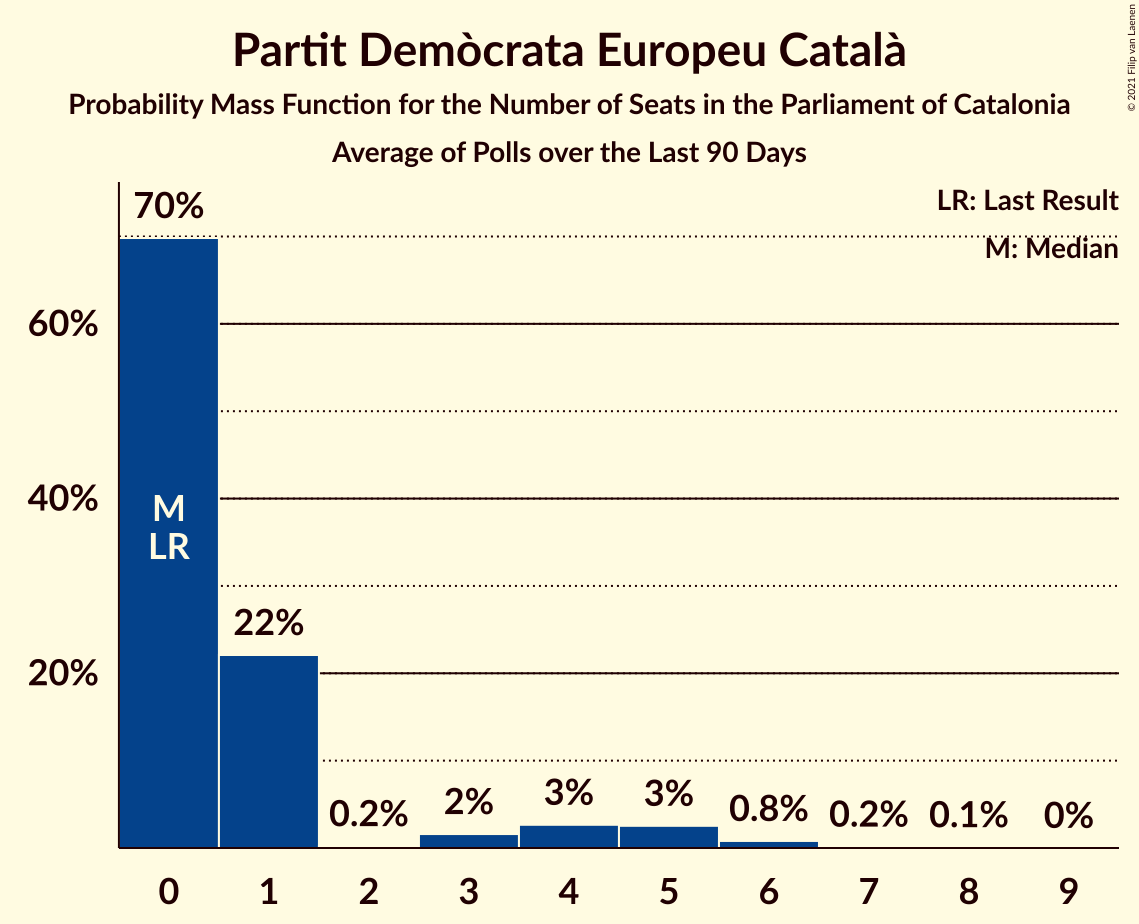
| Number of Seats | Probability | Accumulated | Special Marks |
|---|---|---|---|
| 0 | 70% | 100% | Last Result, Median |
| 1 | 22% | 30% | |
| 2 | 0.2% | 8% | |
| 3 | 2% | 8% | |
| 4 | 3% | 6% | |
| 5 | 3% | 4% | |
| 6 | 0.8% | 1.1% | |
| 7 | 0.2% | 0.3% | |
| 8 | 0.1% | 0.1% | |
| 9 | 0% | 0% |
Coalitions
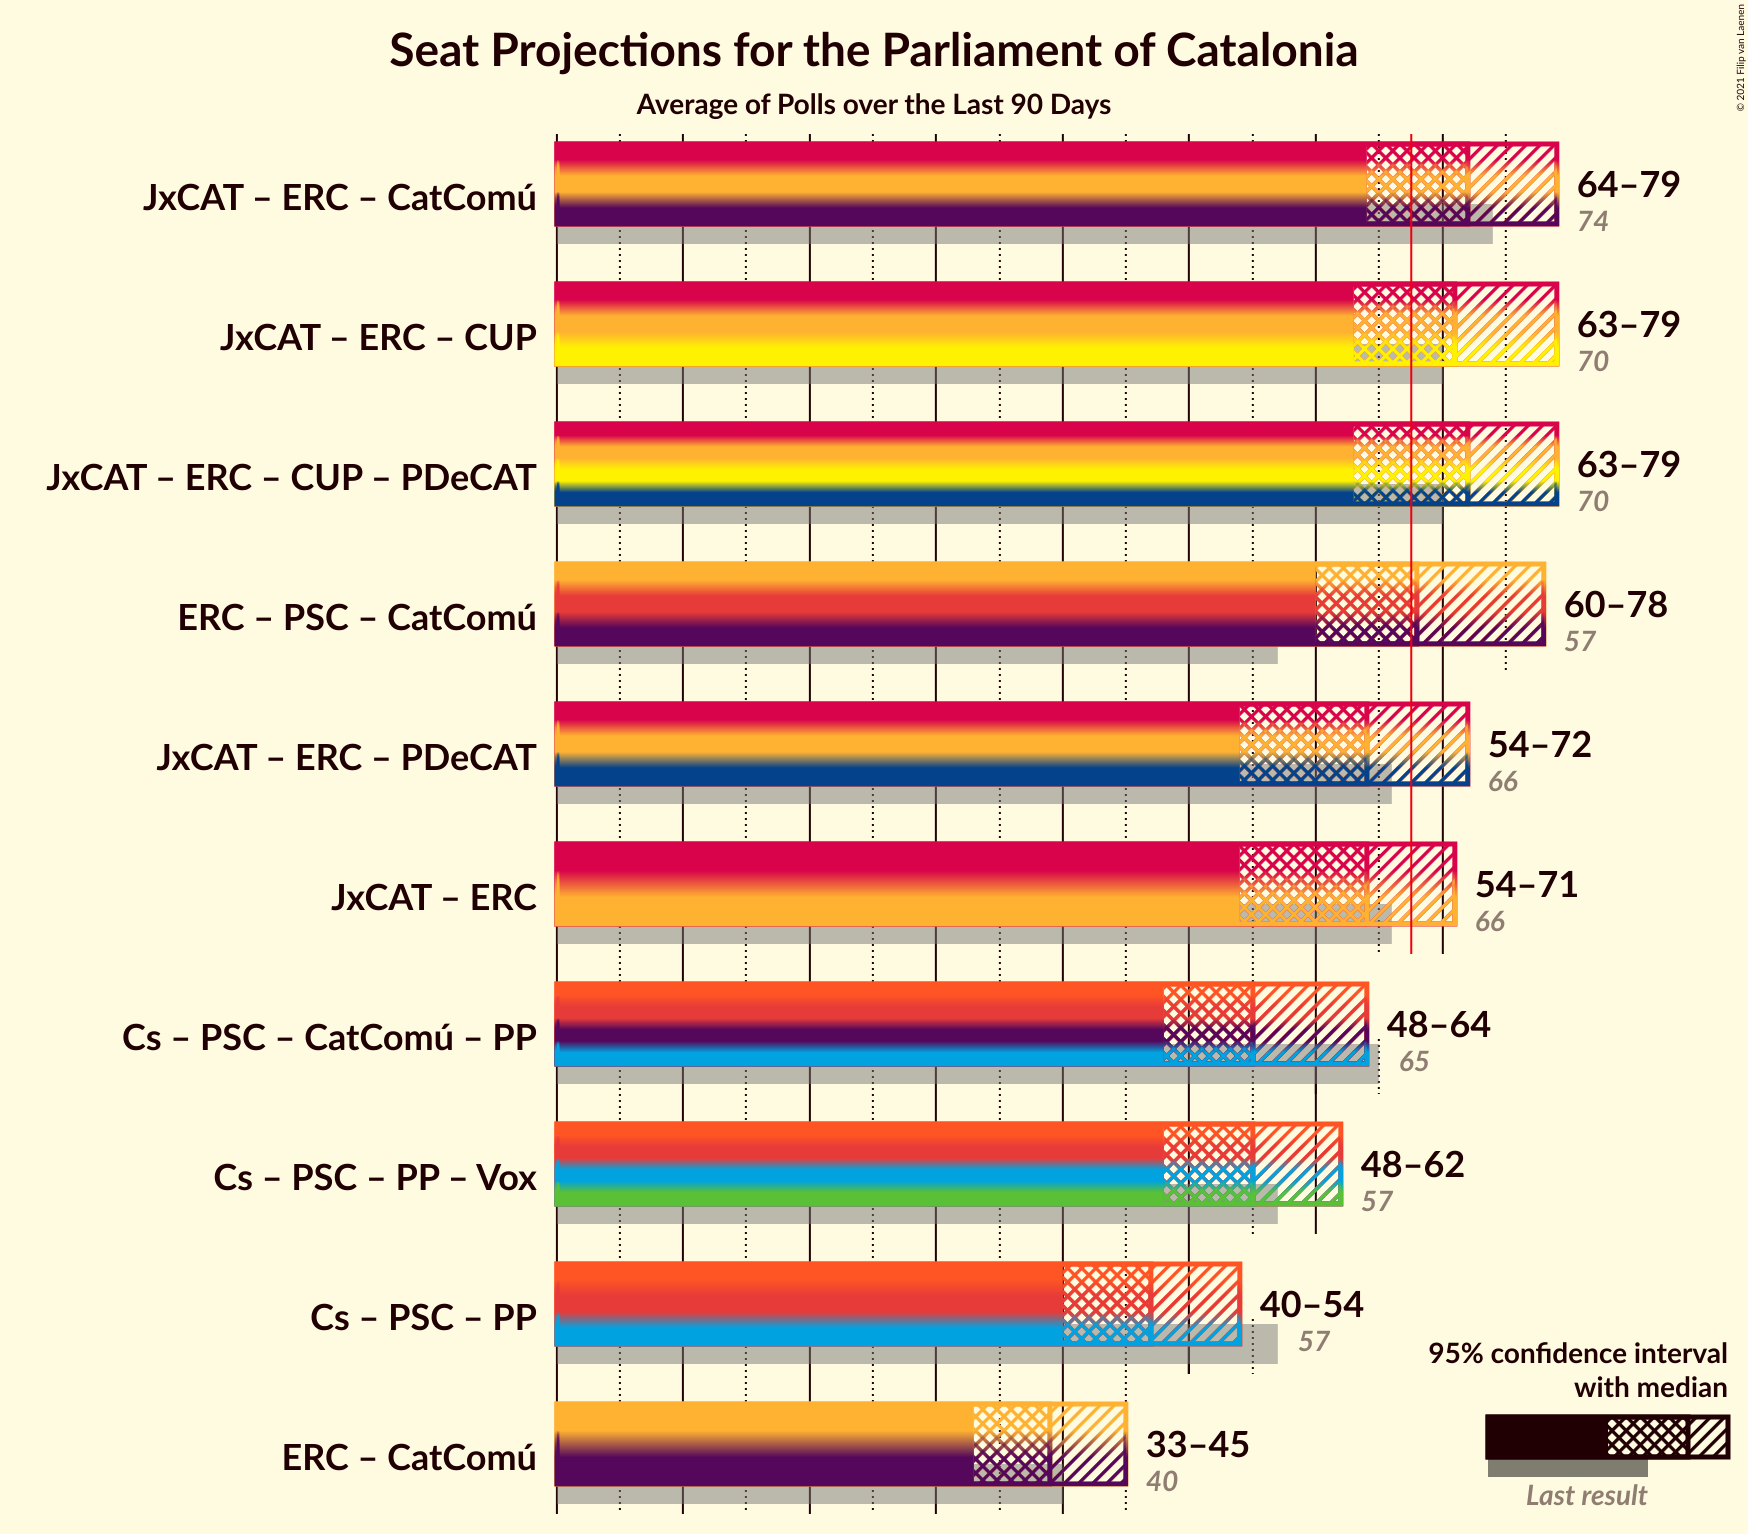
Confidence Intervals
| Coalition | Last Result | Median | Majority? | 80% Confidence Interval | 90% Confidence Interval | 95% Confidence Interval | 99% Confidence Interval |
|---|---|---|---|---|---|---|---|
| Junts per Catalunya – Esquerra Republicana–Catalunya Sí – Catalunya en Comú–Podem | 74 | 72 | 88% | 67–76 | 65–77 | 64–79 | 62–81 |
| Junts per Catalunya – Esquerra Republicana–Catalunya Sí – Candidatura d’Unitat Popular | 70 | 71 | 84% | 66–76 | 64–78 | 63–79 | 61–81 |
| Junts per Catalunya – Esquerra Republicana–Catalunya Sí – Candidatura d’Unitat Popular – Partit Demòcrata Europeu Català | 70 | 72 | 85% | 66–77 | 64–78 | 63–79 | 61–81 |
| Esquerra Republicana–Catalunya Sí – Partit dels Socialistes de Catalunya (PSC-PSOE) – Catalunya en Comú–Podem | 57 | 68 | 60% | 63–75 | 61–77 | 60–78 | 58–79 |
| Junts per Catalunya – Esquerra Republicana–Catalunya Sí – Partit Demòcrata Europeu Català | 66 | 64 | 18% | 59–69 | 55–71 | 54–72 | 52–73 |
| Junts per Catalunya – Esquerra Republicana–Catalunya Sí | 66 | 64 | 16% | 58–69 | 55–70 | 54–71 | 52–73 |
| Ciutadans–Partido de la Ciudadanía – Partit dels Socialistes de Catalunya (PSC-PSOE) – Catalunya en Comú–Podem – Partit Popular | 65 | 55 | 0.1% | 50–61 | 48–63 | 48–64 | 45–66 |
| Ciutadans–Partido de la Ciudadanía – Partit dels Socialistes de Catalunya (PSC-PSOE) – Partit Popular – Vox | 57 | 55 | 0% | 50–60 | 49–61 | 48–62 | 46–64 |
| Ciutadans–Partido de la Ciudadanía – Partit dels Socialistes de Catalunya (PSC-PSOE) – Partit Popular | 57 | 47 | 0% | 42–52 | 41–53 | 40–54 | 37–57 |
| Esquerra Republicana–Catalunya Sí – Catalunya en Comú–Podem | 40 | 39 | 0% | 35–43 | 34–44 | 33–45 | 31–47 |
Junts per Catalunya – Esquerra Republicana–Catalunya Sí – Catalunya en Comú–Podem
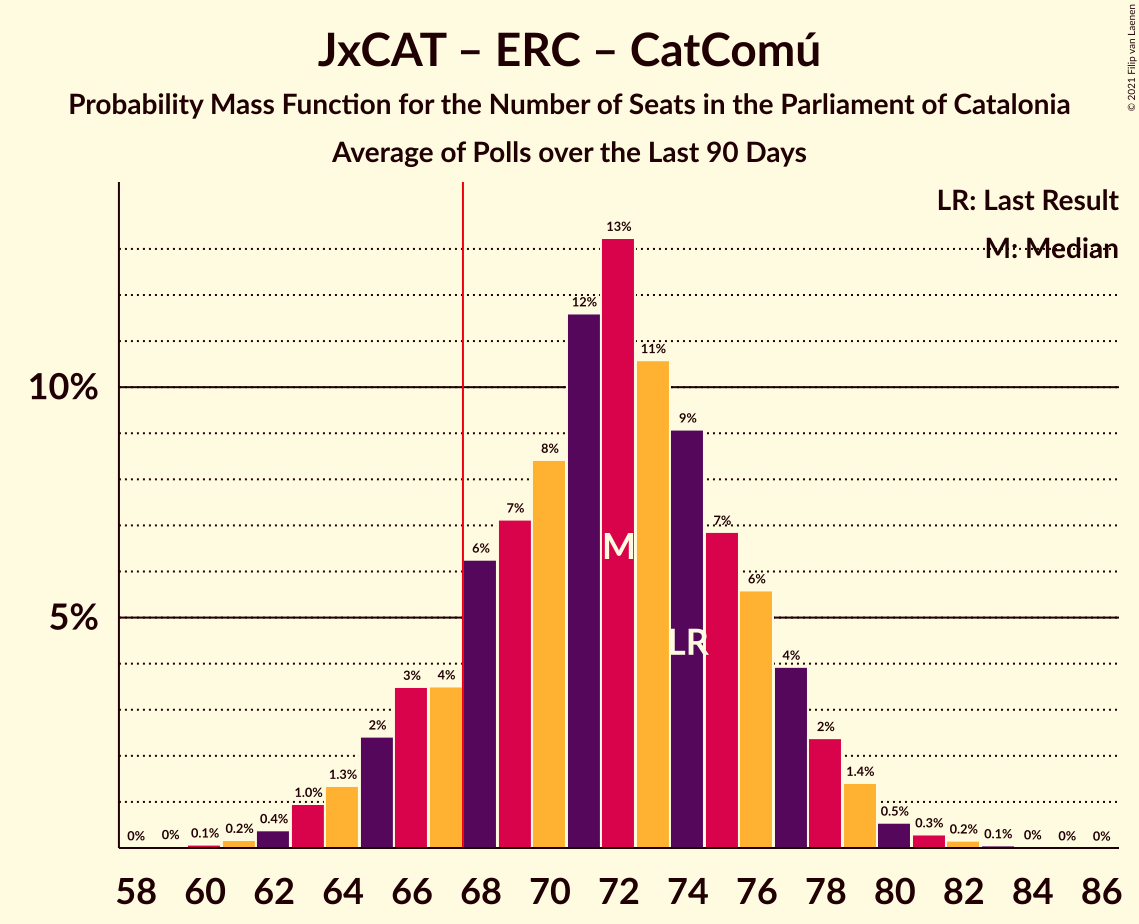
| Number of Seats | Probability | Accumulated | Special Marks |
|---|---|---|---|
| 59 | 0% | 100% | |
| 60 | 0.1% | 99.9% | |
| 61 | 0.2% | 99.9% | |
| 62 | 0.4% | 99.7% | |
| 63 | 1.0% | 99.3% | |
| 64 | 1.3% | 98% | |
| 65 | 2% | 97% | |
| 66 | 3% | 95% | |
| 67 | 4% | 91% | |
| 68 | 6% | 88% | Majority |
| 69 | 7% | 81% | |
| 70 | 8% | 74% | |
| 71 | 12% | 66% | Median |
| 72 | 13% | 54% | |
| 73 | 11% | 41% | |
| 74 | 9% | 30% | Last Result |
| 75 | 7% | 21% | |
| 76 | 6% | 14% | |
| 77 | 4% | 9% | |
| 78 | 2% | 5% | |
| 79 | 1.4% | 3% | |
| 80 | 0.5% | 1.1% | |
| 81 | 0.3% | 0.6% | |
| 82 | 0.2% | 0.3% | |
| 83 | 0.1% | 0.1% | |
| 84 | 0% | 0.1% | |
| 85 | 0% | 0% |
Junts per Catalunya – Esquerra Republicana–Catalunya Sí – Candidatura d’Unitat Popular
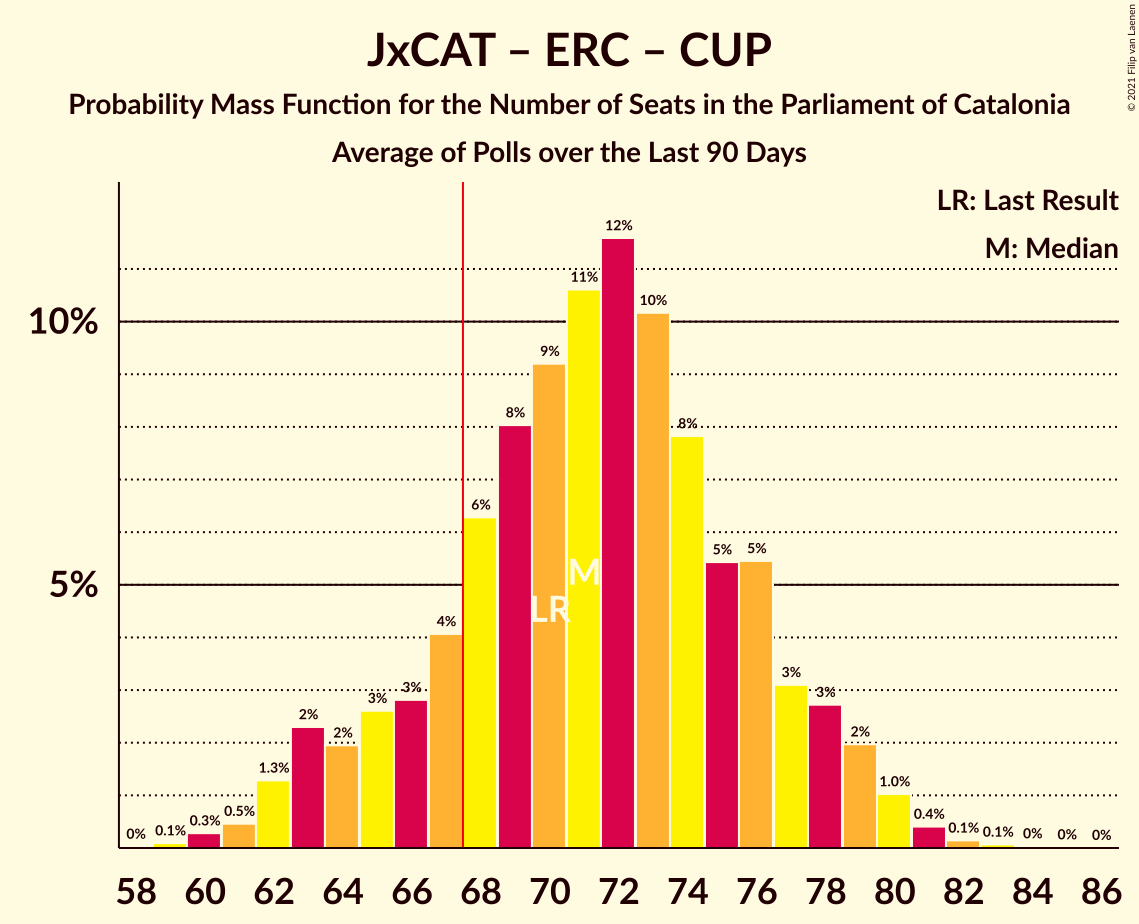
| Number of Seats | Probability | Accumulated | Special Marks |
|---|---|---|---|
| 59 | 0.1% | 100% | |
| 60 | 0.3% | 99.9% | |
| 61 | 0.5% | 99.6% | |
| 62 | 1.3% | 99.1% | |
| 63 | 2% | 98% | |
| 64 | 2% | 96% | |
| 65 | 3% | 94% | |
| 66 | 3% | 91% | |
| 67 | 4% | 88% | |
| 68 | 6% | 84% | Majority |
| 69 | 8% | 78% | |
| 70 | 9% | 70% | Last Result |
| 71 | 11% | 61% | Median |
| 72 | 12% | 50% | |
| 73 | 10% | 38% | |
| 74 | 8% | 28% | |
| 75 | 5% | 20% | |
| 76 | 5% | 15% | |
| 77 | 3% | 10% | |
| 78 | 3% | 6% | |
| 79 | 2% | 4% | |
| 80 | 1.0% | 2% | |
| 81 | 0.4% | 0.7% | |
| 82 | 0.1% | 0.3% | |
| 83 | 0.1% | 0.1% | |
| 84 | 0% | 0.1% | |
| 85 | 0% | 0% |
Junts per Catalunya – Esquerra Republicana–Catalunya Sí – Candidatura d’Unitat Popular – Partit Demòcrata Europeu Català
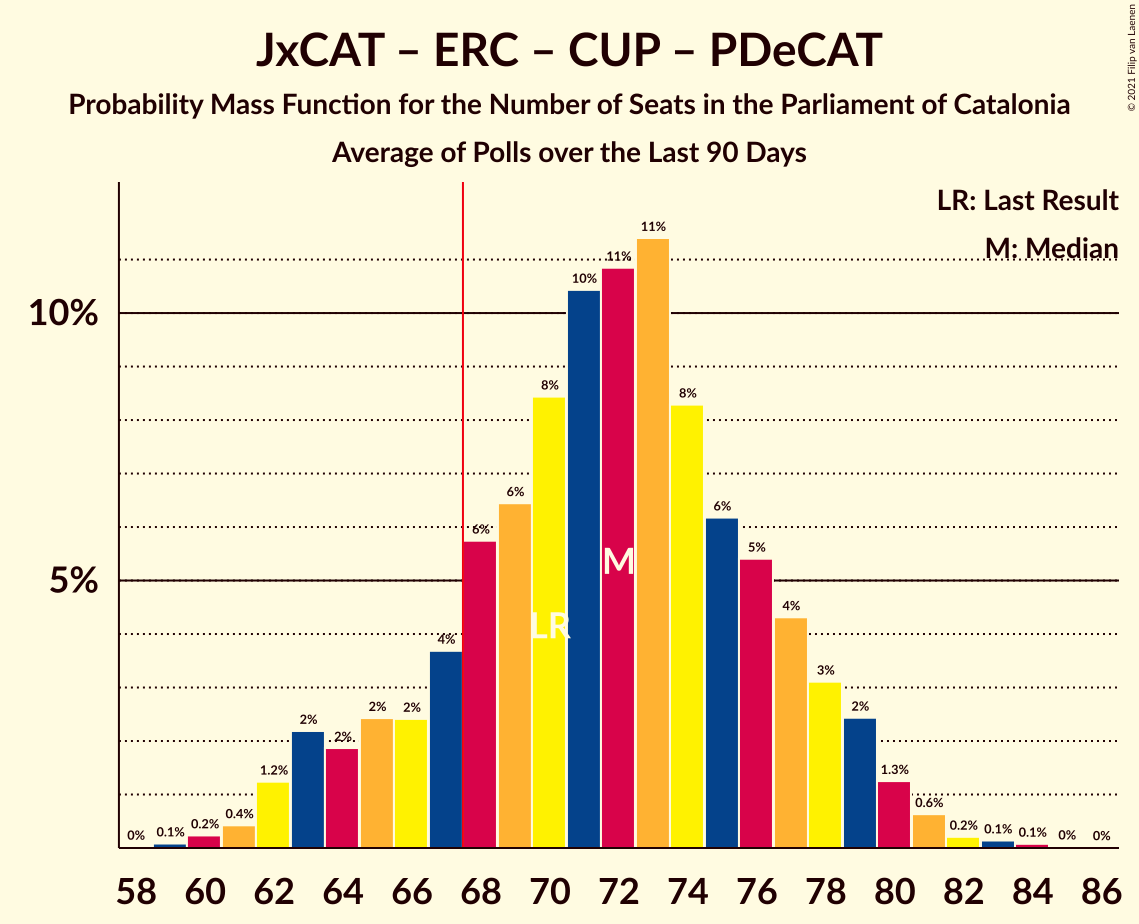
| Number of Seats | Probability | Accumulated | Special Marks |
|---|---|---|---|
| 59 | 0.1% | 100% | |
| 60 | 0.2% | 99.9% | |
| 61 | 0.4% | 99.7% | |
| 62 | 1.2% | 99.2% | |
| 63 | 2% | 98% | |
| 64 | 2% | 96% | |
| 65 | 2% | 94% | |
| 66 | 2% | 92% | |
| 67 | 4% | 89% | |
| 68 | 6% | 85% | Majority |
| 69 | 6% | 80% | |
| 70 | 8% | 73% | Last Result |
| 71 | 10% | 65% | Median |
| 72 | 11% | 54% | |
| 73 | 11% | 43% | |
| 74 | 8% | 32% | |
| 75 | 6% | 24% | |
| 76 | 5% | 18% | |
| 77 | 4% | 12% | |
| 78 | 3% | 8% | |
| 79 | 2% | 5% | |
| 80 | 1.3% | 2% | |
| 81 | 0.6% | 1.1% | |
| 82 | 0.2% | 0.5% | |
| 83 | 0.1% | 0.3% | |
| 84 | 0.1% | 0.1% | |
| 85 | 0% | 0% |
Esquerra Republicana–Catalunya Sí – Partit dels Socialistes de Catalunya (PSC-PSOE) – Catalunya en Comú–Podem
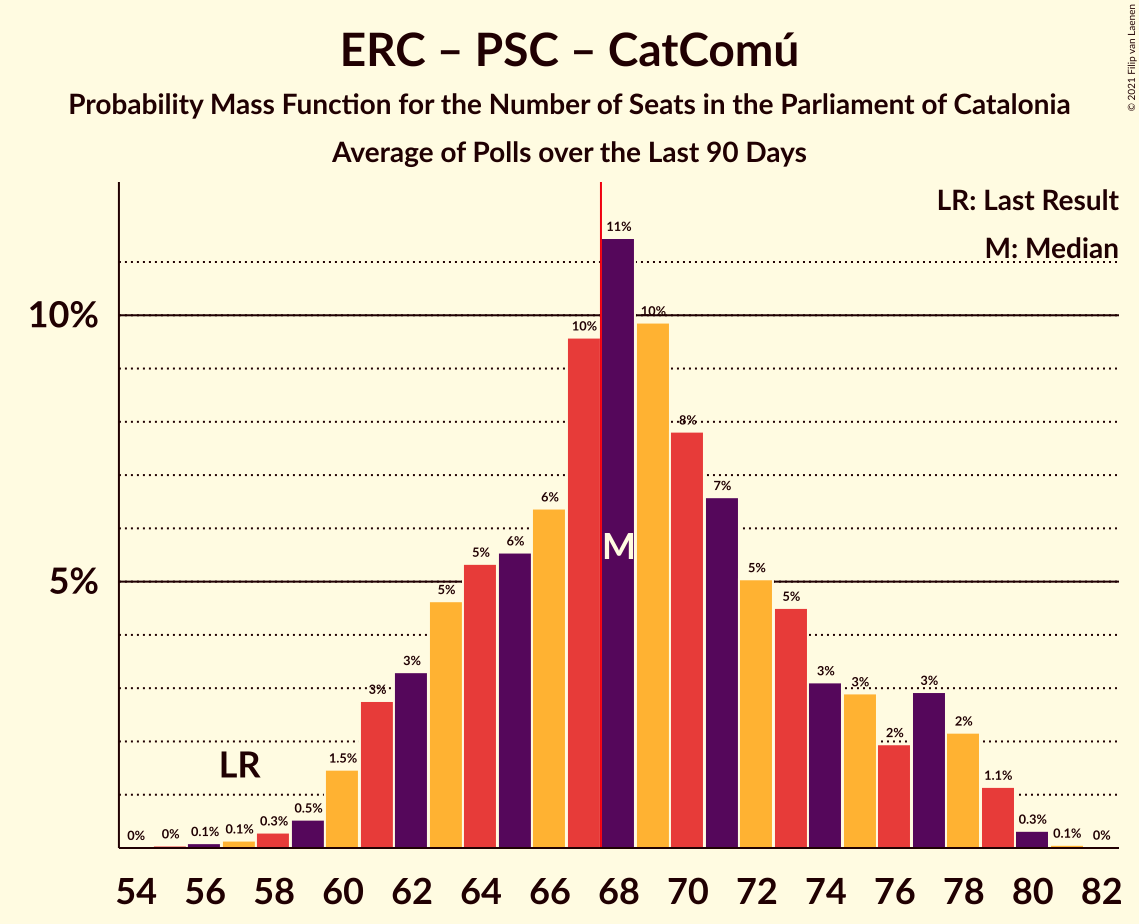
| Number of Seats | Probability | Accumulated | Special Marks |
|---|---|---|---|
| 55 | 0% | 100% | |
| 56 | 0.1% | 99.9% | |
| 57 | 0.1% | 99.8% | Last Result |
| 58 | 0.3% | 99.7% | |
| 59 | 0.5% | 99.4% | |
| 60 | 1.5% | 98.9% | |
| 61 | 3% | 97% | |
| 62 | 3% | 95% | |
| 63 | 5% | 91% | |
| 64 | 5% | 87% | |
| 65 | 6% | 81% | |
| 66 | 6% | 76% | |
| 67 | 10% | 69% | |
| 68 | 11% | 60% | Median, Majority |
| 69 | 10% | 48% | |
| 70 | 8% | 39% | |
| 71 | 7% | 31% | |
| 72 | 5% | 24% | |
| 73 | 5% | 19% | |
| 74 | 3% | 15% | |
| 75 | 3% | 11% | |
| 76 | 2% | 9% | |
| 77 | 3% | 7% | |
| 78 | 2% | 4% | |
| 79 | 1.1% | 2% | |
| 80 | 0.3% | 0.4% | |
| 81 | 0.1% | 0.1% | |
| 82 | 0% | 0% |
Junts per Catalunya – Esquerra Republicana–Catalunya Sí – Partit Demòcrata Europeu Català
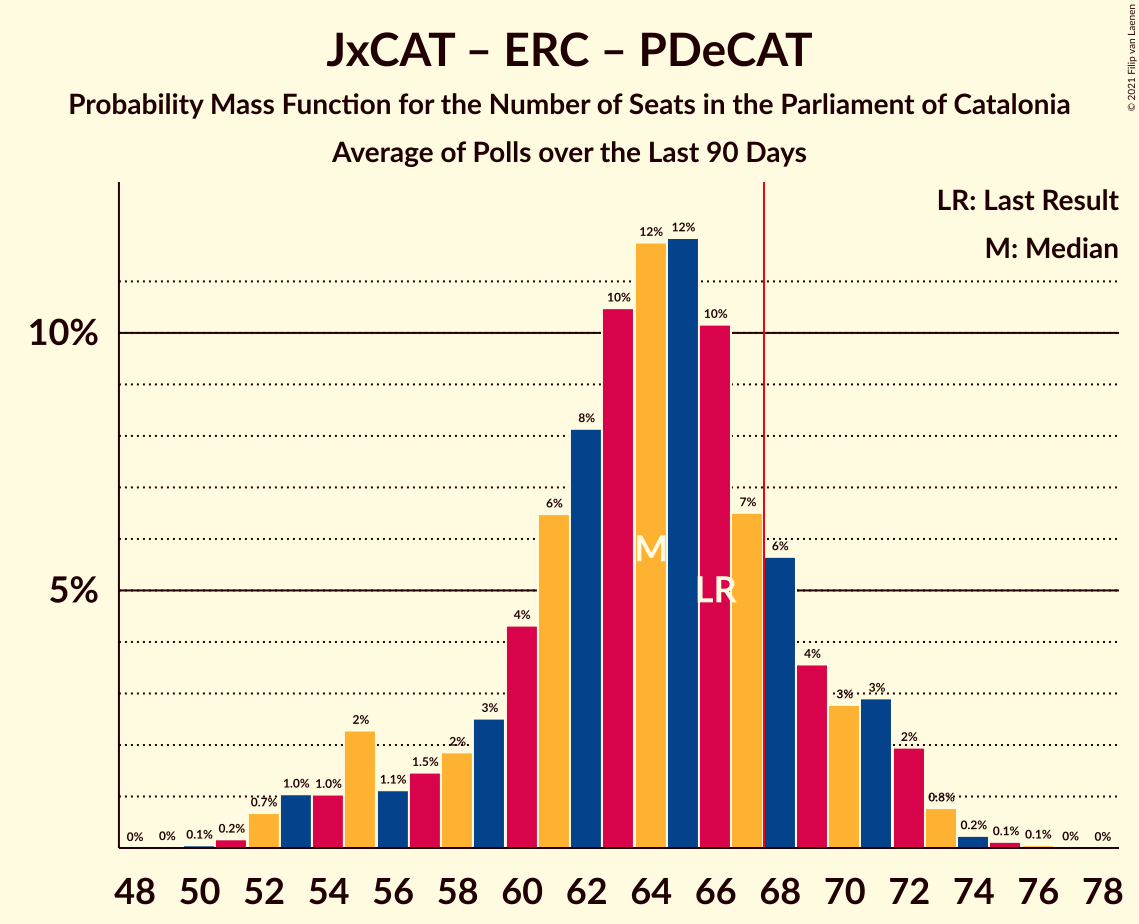
| Number of Seats | Probability | Accumulated | Special Marks |
|---|---|---|---|
| 50 | 0.1% | 100% | |
| 51 | 0.2% | 99.9% | |
| 52 | 0.7% | 99.7% | |
| 53 | 1.0% | 99.1% | |
| 54 | 1.0% | 98% | |
| 55 | 2% | 97% | |
| 56 | 1.1% | 95% | |
| 57 | 1.5% | 94% | |
| 58 | 2% | 92% | |
| 59 | 3% | 90% | |
| 60 | 4% | 88% | |
| 61 | 6% | 83% | |
| 62 | 8% | 77% | |
| 63 | 10% | 69% | Median |
| 64 | 12% | 58% | |
| 65 | 12% | 47% | |
| 66 | 10% | 35% | Last Result |
| 67 | 7% | 25% | |
| 68 | 6% | 18% | Majority |
| 69 | 4% | 12% | |
| 70 | 3% | 9% | |
| 71 | 3% | 6% | |
| 72 | 2% | 3% | |
| 73 | 0.8% | 1.2% | |
| 74 | 0.2% | 0.4% | |
| 75 | 0.1% | 0.2% | |
| 76 | 0.1% | 0.1% | |
| 77 | 0% | 0% |
Junts per Catalunya – Esquerra Republicana–Catalunya Sí
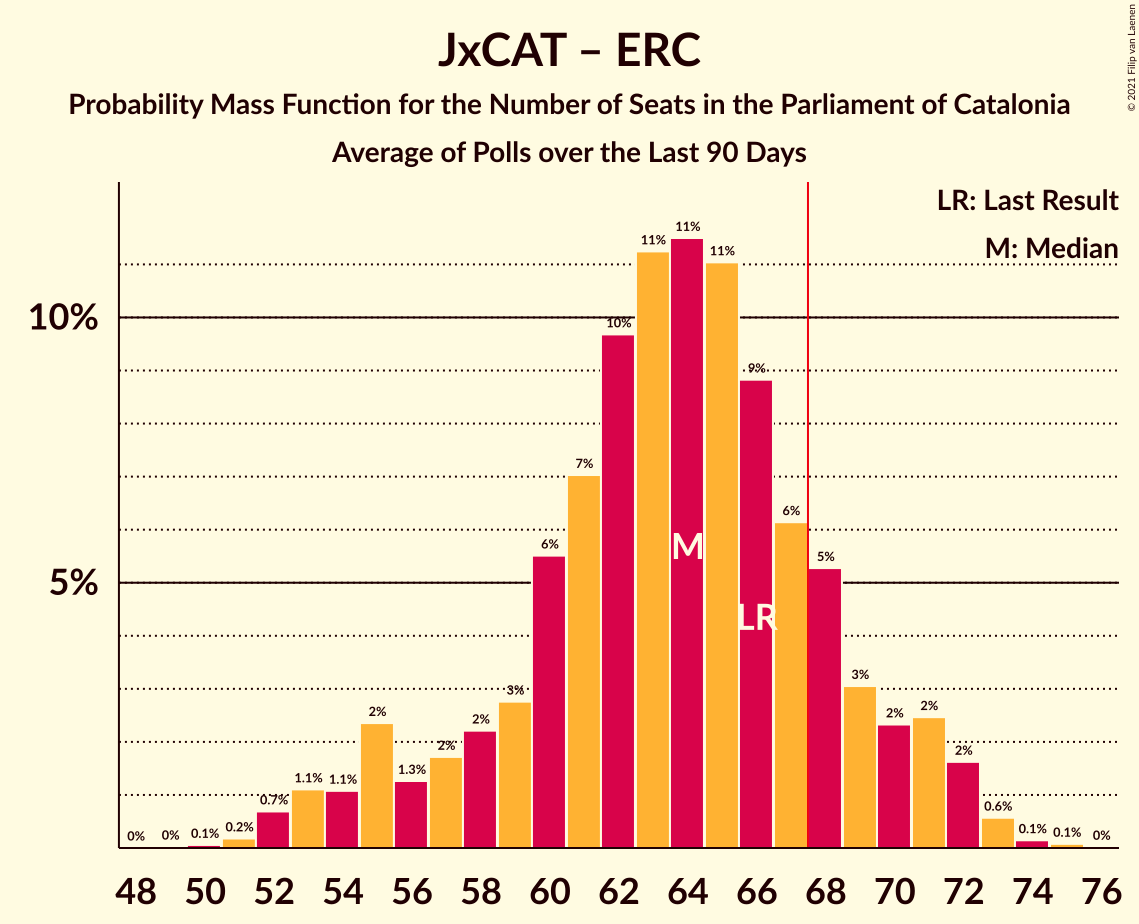
| Number of Seats | Probability | Accumulated | Special Marks |
|---|---|---|---|
| 50 | 0.1% | 100% | |
| 51 | 0.2% | 99.9% | |
| 52 | 0.7% | 99.7% | |
| 53 | 1.1% | 99.0% | |
| 54 | 1.1% | 98% | |
| 55 | 2% | 97% | |
| 56 | 1.3% | 95% | |
| 57 | 2% | 93% | |
| 58 | 2% | 92% | |
| 59 | 3% | 89% | |
| 60 | 6% | 87% | |
| 61 | 7% | 81% | |
| 62 | 10% | 74% | |
| 63 | 11% | 64% | Median |
| 64 | 11% | 53% | |
| 65 | 11% | 42% | |
| 66 | 9% | 31% | Last Result |
| 67 | 6% | 22% | |
| 68 | 5% | 16% | Majority |
| 69 | 3% | 10% | |
| 70 | 2% | 7% | |
| 71 | 2% | 5% | |
| 72 | 2% | 2% | |
| 73 | 0.6% | 0.8% | |
| 74 | 0.1% | 0.3% | |
| 75 | 0.1% | 0.1% | |
| 76 | 0% | 0% |
Ciutadans–Partido de la Ciudadanía – Partit dels Socialistes de Catalunya (PSC-PSOE) – Catalunya en Comú–Podem – Partit Popular
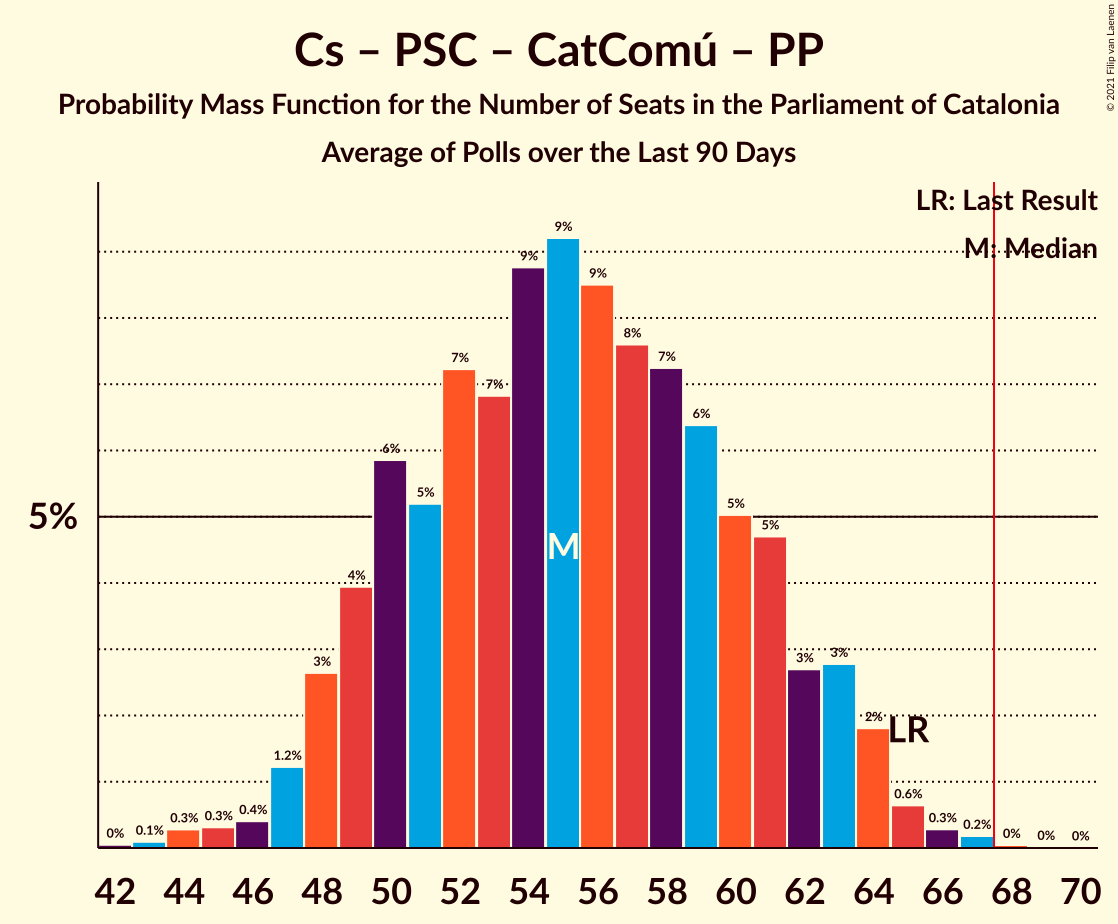
| Number of Seats | Probability | Accumulated | Special Marks |
|---|---|---|---|
| 42 | 0% | 100% | |
| 43 | 0.1% | 99.9% | |
| 44 | 0.3% | 99.8% | |
| 45 | 0.3% | 99.5% | |
| 46 | 0.4% | 99.2% | |
| 47 | 1.2% | 98.8% | |
| 48 | 3% | 98% | |
| 49 | 4% | 95% | |
| 50 | 6% | 91% | |
| 51 | 5% | 85% | |
| 52 | 7% | 80% | |
| 53 | 7% | 73% | |
| 54 | 9% | 66% | |
| 55 | 9% | 57% | |
| 56 | 9% | 48% | Median |
| 57 | 8% | 39% | |
| 58 | 7% | 32% | |
| 59 | 6% | 25% | |
| 60 | 5% | 18% | |
| 61 | 5% | 13% | |
| 62 | 3% | 8% | |
| 63 | 3% | 6% | |
| 64 | 2% | 3% | |
| 65 | 0.6% | 1.2% | Last Result |
| 66 | 0.3% | 0.5% | |
| 67 | 0.2% | 0.3% | |
| 68 | 0% | 0.1% | Majority |
| 69 | 0% | 0% |
Ciutadans–Partido de la Ciudadanía – Partit dels Socialistes de Catalunya (PSC-PSOE) – Partit Popular – Vox
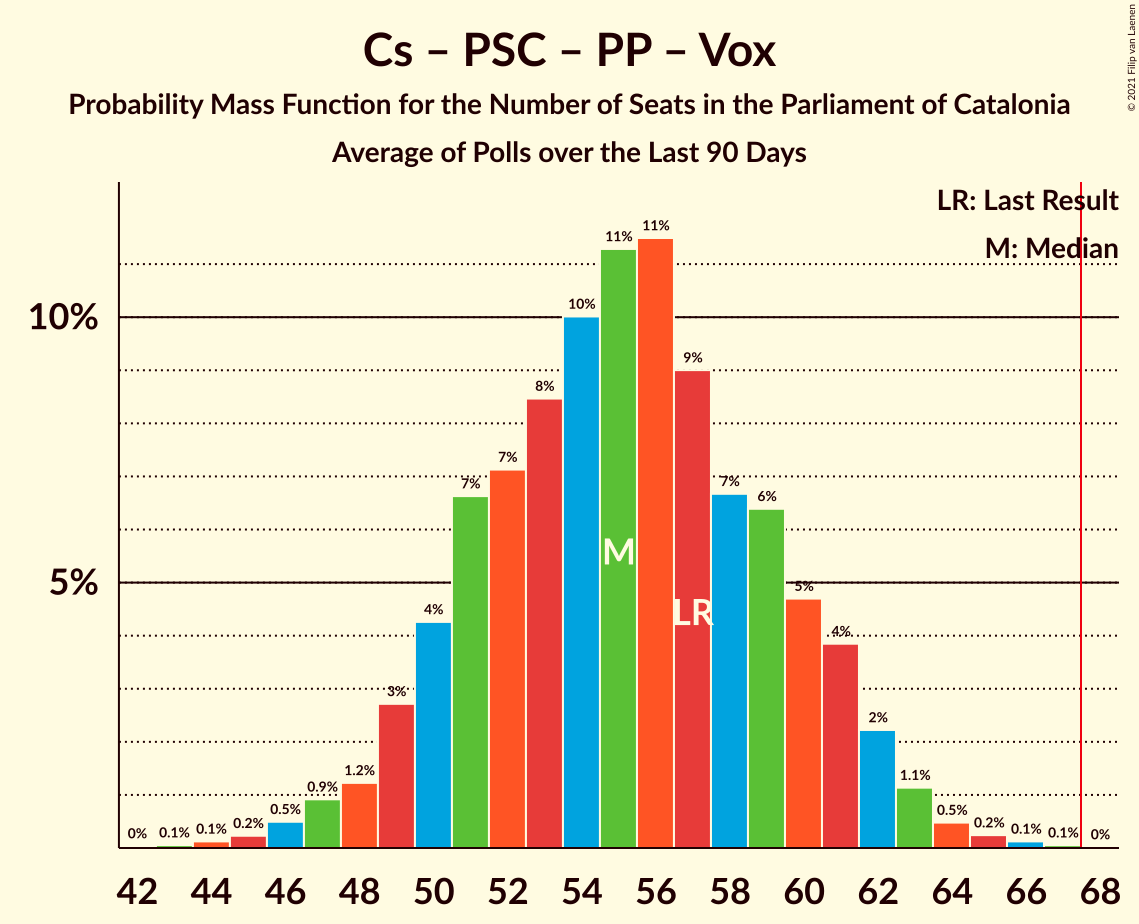
| Number of Seats | Probability | Accumulated | Special Marks |
|---|---|---|---|
| 42 | 0% | 100% | |
| 43 | 0.1% | 99.9% | |
| 44 | 0.1% | 99.9% | |
| 45 | 0.2% | 99.8% | |
| 46 | 0.5% | 99.5% | |
| 47 | 0.9% | 99.0% | |
| 48 | 1.2% | 98% | |
| 49 | 3% | 97% | |
| 50 | 4% | 94% | |
| 51 | 7% | 90% | |
| 52 | 7% | 83% | |
| 53 | 8% | 76% | |
| 54 | 10% | 68% | |
| 55 | 11% | 58% | Median |
| 56 | 11% | 46% | |
| 57 | 9% | 35% | Last Result |
| 58 | 7% | 26% | |
| 59 | 6% | 19% | |
| 60 | 5% | 13% | |
| 61 | 4% | 8% | |
| 62 | 2% | 4% | |
| 63 | 1.1% | 2% | |
| 64 | 0.5% | 0.9% | |
| 65 | 0.2% | 0.5% | |
| 66 | 0.1% | 0.2% | |
| 67 | 0.1% | 0.1% | |
| 68 | 0% | 0% | Majority |
Ciutadans–Partido de la Ciudadanía – Partit dels Socialistes de Catalunya (PSC-PSOE) – Partit Popular
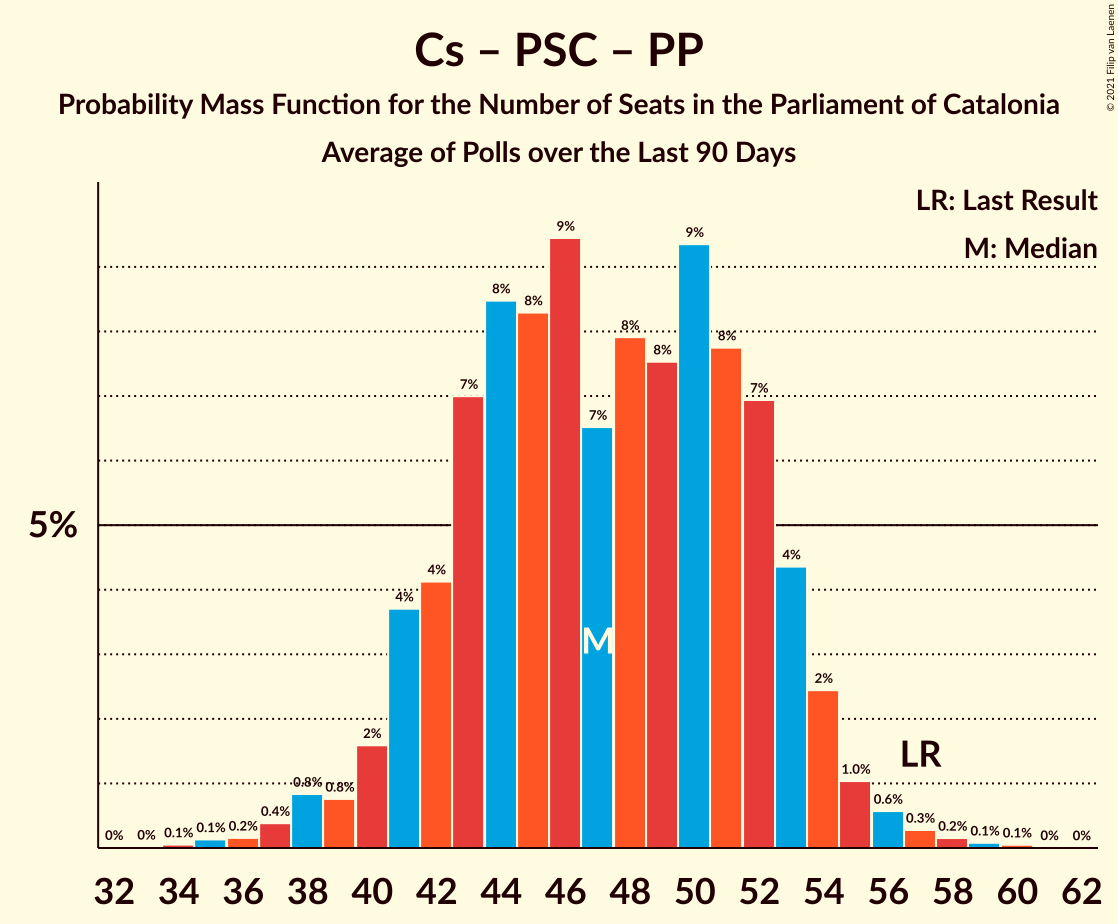
| Number of Seats | Probability | Accumulated | Special Marks |
|---|---|---|---|
| 34 | 0.1% | 100% | |
| 35 | 0.1% | 99.9% | |
| 36 | 0.2% | 99.8% | |
| 37 | 0.4% | 99.6% | |
| 38 | 0.8% | 99.2% | |
| 39 | 0.8% | 98% | |
| 40 | 2% | 98% | |
| 41 | 4% | 96% | |
| 42 | 4% | 92% | |
| 43 | 7% | 88% | |
| 44 | 8% | 81% | |
| 45 | 8% | 73% | |
| 46 | 9% | 64% | |
| 47 | 7% | 55% | |
| 48 | 8% | 48% | Median |
| 49 | 8% | 41% | |
| 50 | 9% | 33% | |
| 51 | 8% | 24% | |
| 52 | 7% | 16% | |
| 53 | 4% | 9% | |
| 54 | 2% | 5% | |
| 55 | 1.0% | 2% | |
| 56 | 0.6% | 1.2% | |
| 57 | 0.3% | 0.6% | Last Result |
| 58 | 0.2% | 0.3% | |
| 59 | 0.1% | 0.2% | |
| 60 | 0.1% | 0.1% | |
| 61 | 0% | 0% |
Esquerra Republicana–Catalunya Sí – Catalunya en Comú–Podem
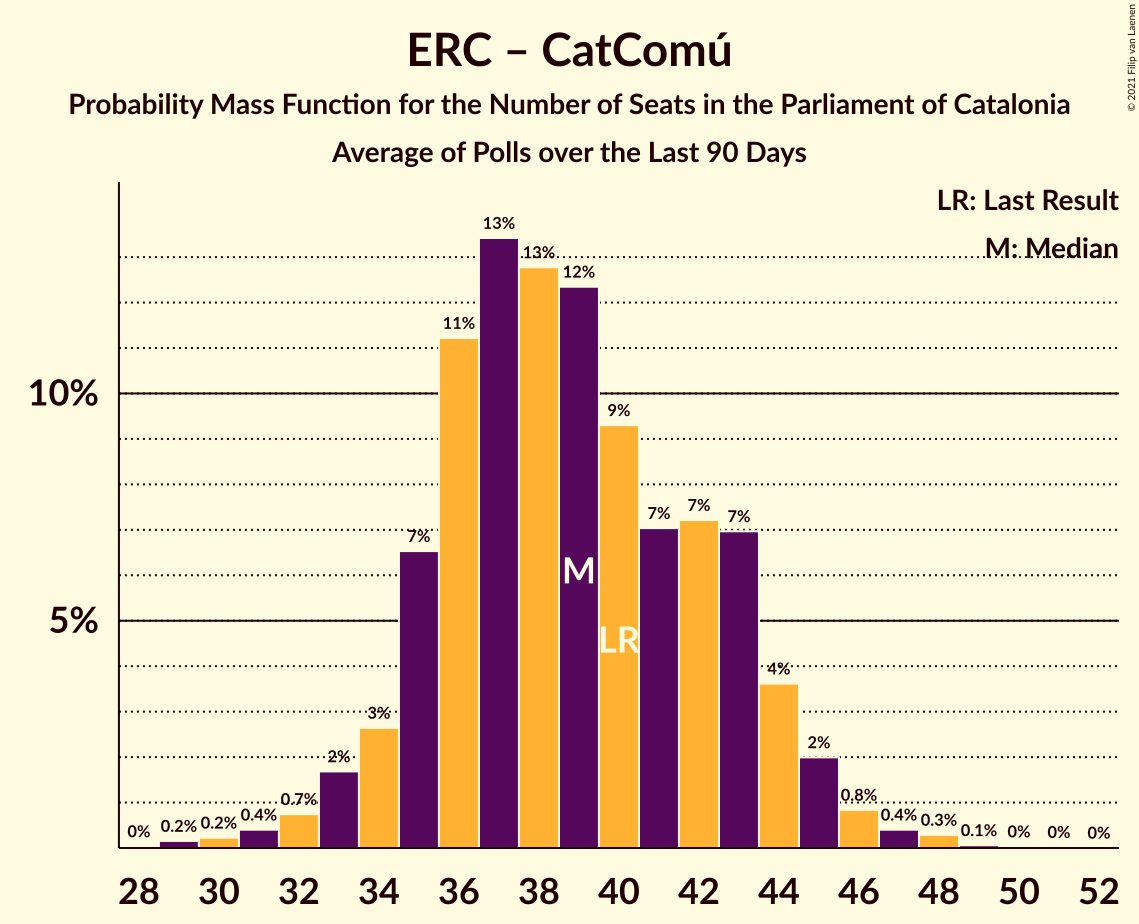
| Number of Seats | Probability | Accumulated | Special Marks |
|---|---|---|---|
| 28 | 0% | 100% | |
| 29 | 0.2% | 99.9% | |
| 30 | 0.2% | 99.8% | |
| 31 | 0.4% | 99.6% | |
| 32 | 0.7% | 99.2% | |
| 33 | 2% | 98% | |
| 34 | 3% | 97% | |
| 35 | 7% | 94% | |
| 36 | 11% | 88% | |
| 37 | 13% | 76% | |
| 38 | 13% | 63% | Median |
| 39 | 12% | 50% | |
| 40 | 9% | 38% | Last Result |
| 41 | 7% | 28% | |
| 42 | 7% | 21% | |
| 43 | 7% | 14% | |
| 44 | 4% | 7% | |
| 45 | 2% | 4% | |
| 46 | 0.8% | 2% | |
| 47 | 0.4% | 0.8% | |
| 48 | 0.3% | 0.4% | |
| 49 | 0.1% | 0.1% | |
| 50 | 0% | 0.1% | |
| 51 | 0% | 0% |
Technical Information
- Number of polls included in this average: 16
- Lowest number of simulations done in a poll included in this average: 1,048,576
- Total number of simulations done in the polls included in this average: 16,777,216
- Error estimate: 3.19%